

Abstract
Retinal ganglion cells are categorized into multiple classes, including multiple types of bistratified ganglion cells (BGCs). The recent use of transgenic mouse lines with specific type(s) of ganglion cells that are labeled by fluorescent markers has facilitated the morphological and physiological studies of BGCs, particularly the directional-selective BGCs. The most important benefit from using transgenic animals is the capability to perform in vivo gene manipulation. In particular, the Cre/LoxP recombination system has become a powerful tool, allowing gene deletion, over-expression, and ectopic expression in a cell type-specific and temporally controlled fashion. The key to this tool is the availability of Cre mouse lines with cell or tissue type-specific expression of Cre recombinase. In this study, we characterized the Cre-positive retinal ganglion cells in a PCP2 (Purkinje cell protein 2)-cre mouse line. We found that all of the Cre-positive retinal ganglion cells were BGCs. Based on morphological criteria, we determined that they can be grouped into five types. The On- and Off-dendrites of three of these types stratified outside of the cholinergic bands and differed from directional selective ganglion cells (DSGCs) morphologically. These cells were negative for Brn-3b and positive for both calretinin and CART retina markers. The remaining two types were identified as putative On-Off and On-DSGCs. This Cre mouse line could be useful for further studies of the molecular and functional properties of BGCs in mice.
Keywords: Cre-transgenic mouse, bistratified retinal ganglion cell, directional selective retinal ganglion cell, mouse
Introduction
Retinal ganglion cells (GCs) are the output neurons in the retina. GCs are morphologically and functionally heterogeneous. It is commonly believed that each type codes for different features of visual information, such as motion, color, and contrast, and carries the visual information in parallel to higher visual centers of the brain (Roska and Werblin, 2001; Wässle, 2004). The morphology and stratification of the dendrites of GCs reflect the sampling area and possible synaptic contacts in the specific laminae of the inner plexiform layer (IPL). Recently, 12 - 22 morphological types of GCs have been identified based on the size, shape, and stratification level of their dendrites in rats (Huxlin and Goodchild, 1997; Sun et al., 2002a), rabbits (Amthor et al., 1983; Rockhill et al., 2002), and mice (Sun et al., 2002b; Badea and Nathans, 2004; Kong et al., 2005; Coombs et al., 2006; Volgyi et al., 2009).
Of the described GCs, 2-6 types are bistratified GCs (BGCs), whose dendrites terminate in two different laminae in the IPL. The most studied BGCs are the On-Off direction-selective GC type (DSGC), which belongs to a group of GCs that are sensitive to the direction of a moving object (Barlow and Hill, 1963; Barlow et al., 1964; Vaney et al., 2012). The On-Off DSGCs stratify in the Off- and On-sublaminae of the IPL, where they cofasciculate with the dendrites of cholinergic amacrine cells (Famiglietti, 1992). Other DSGC types are less numerous and are represented by On-DSGCs (Barlow et al., 1964). The dendrites of the On-DSGCs are mostly confined to the On-sublamina, where they also co-stratify with or slightly below the processes of cholinergic amacrine cells (Famiglietti, 1992; Hoshi et al., 2011). In addition, a few dendritic branches ascend further to the Off-sublamina in the IPL (Buhl and Peichl, 1986; Amthor et al., 1989; Famiglietti, 1992; He and Masland, 1998). Thus, these cells have also been classified as BGCs (Famiglietti, 2009). In addition to the direction-selective BGCs, multiple non-direction-selective BGCs have been previously characterized in rabbits and have been described as uniformity detectors, local edge detectors, orientation detectors, and transient On-Off GCs (Levick, 1967; Amthor et al., 1989; Famiglietti, 2009; Sivyer et al., 2011).
Transgenic mice have become increasingly popular animal models for retinal research. Recently, the availability of transgenic mouse lines with fluorescent markers under the control of specific promoters and limited to a subtype of BGCs has enabled detailed morphological and physiological studies of several types of DSGCs (Yonehara et al., 2008; Huberman et al., 2009; Yonehara et al., 2009; Kim et al., 2010; Kay et al., 2011; Rivlin-Etzion et al., 2011; Trenholm et al., 2011). However, the morphological and functional properties of the non-direction selective BGCs have not been examined in the mouse retina due to the rarity of these cells and the lack of transgenic mouse lines with labeled BGCs.
The most important benefit to using transgenic animals is the capability to perform in vivo gene manipulation. In particular, the Cre/LoxP recombination system has become a powerful tool, allowing gene deletion, over-expression, and ectopic expression in a cell type-specific and temporally controlled fashion (Nagy, 2000; Branda and Dymecki, 2004). The key to this tool is the availability of Cre mouse lines with cell or tissue type-specific expression of Cre recombinase. In this study, we report a mouse line with a Cre recombinase targeted to multiple types of BGCs. With the help of Cre-mediated expression of fluorescence proteins, we visualized and characterized five morphological types of BGCs. Two of the cell types co-stratified with cholinergic bands and were identified as putative On-Off and On-DSGCs. The other three types stratified just outside the cholinergic bands and differed in their morphological properties. We also examined their central projections and molecular markers.
Materials and Methods
Animals
Pcp2-cre/GFP (Tg(Pcp2-cre)1Amc/J (referred to as Pcp2-Cre) mice were purchased from Jackson Laboratory (Stock #: 0006207; Bar Harbor, ME, USA). The transgenic mice were generated by driving Cre recombinase with L7-deltaAUG promoter enhancer or also called Purkinje cell protein 2 (Pcp2) promoter enhancer (Lewis et al., 2004). These mice also carry a GFP transgene that co-integrated with the Tg(Pcp2-cre)1Amc/J transgene. GFP expression was observed in bipolar cells and a population of retinal ganglion cells; however, the GFP fluorescence signal was relatively weak, especially in retinal ganglion cells (Ivanova et al., 2010). To enhance the fluorescence signal and to examine the expression pattern and efficacy of the Cre recombinase, the line was crossed with a reporter mouse line with a strong red fluorescent protein variant, tdTomato: B6.Cg-Gt(ROSA)26Sortm9(CAG-tdTomato)Hze/J (Madisen et al., 2010), purchased from Jackson Laboratory (Stock #: 0007909). The offspring were genotyped for the presence of Cre recombinase by PCR using DNA prepared from tail biopsies and the following primer pairs: ACCAGCCAGCTATCAACTCG and TTACATTGGTCCAGCCACC. The expression of tdTomato in the PCP2-Cre-positive mice could be identified by looking directly into the animals’ eyes under the x4 objective of a microscope. All animal handling procedures were approved by the Institutional Animal Care and Use Committee at Wayne State University and were in accordance with the NIH Guide for the Care and Use of Laboratory Animals.
Virus and cholera toxin B injections
PCP2-Cre-positive tdTomato-negative mice were injected with rAAV, a serotype 2 (rAAV2) virus that carries an inverted channelrhodopsin-mCherry fusion construct flanked by two loxP sites under the control of the elongation factor-1 alpha (EF-1 alpha) promoter (Gradinaru et al., 2010). Viral vectors were packaged and affinity purified at the Vector Core in the School of Medicine Gene Therapy Program at the University of Pennsylvania (Philadelphia, PA). Briefly, 1-month-old mice were anesthetized by intraperitoneal injection of a mixture of 120 mg/kg ketamine and 15 mg/kg xylazine. Under a dissecting microscope, a small perforation was made in the temporal sclera region with a needle. A total of 1.5 μl viral vector suspension in saline was injected into the intravitreal space through the hole with a Hamilton syringe. To label individual ganglion cells (GCs), a low viral concentration of 1 × 10¹¹ genome copies (GC)/ml was injected. For the brain projection study, one eye of the PCP2-Cre mice was first injected with the high virus concentration of 6 × 10¹² GC/ml. One month later, both eyes of the same animals were injected as described above with 2 μl of 0.1% of cholera toxin B (CTB, in saline) coupled with Alexa 488 (Molecular Probes). Four days later, the mice were sacrificed for the immunocytochemical study.
Immunocytochemical staining
Mice at one to two months of age were deeply anesthetized with CO2 and decapitated. The retinas were fixed in the eyecups with 4% paraformaldehyde in 0.1 M phosphate buffer (PB, pH=7.3) for 20 minutes. The expression of tdTomato fluorescence was examined in retinal whole mounts and vertical sections. For whole mounts, after fixation, the retina was dissected and separated in PB solution, flat-mounted on slides, and cover-slipped. For retinal vertical sections, the retinas were cryoprotected in a sucrose gradient (10%, 20%, and 30% w/v in PB), and 20 μm-thick cryostat sections were cut. For the brain projection study, three mice were perfusion fixed with 4 % PA for 10 min. The brains were removed and postfixed for 1 h in 4 % PA. After cryoprotection in a sucrose gradient, brain sections were cut at 30 μm. CTB fluorescence was further enhanced with an anti-CTB antibody.
For immunostaining, retinal or brain sections were blocked for 1 h in a solution containing 5% Chemiblocker (membrane-blocking agent, Chemicon), 0.5% Triton X-100 and 0.05% sodium azide (Sigma). The primary antibodies were diluted in the same solution and applied overnight, followed by incubation for 1 h in the appropriate secondary antibody, which was conjugated to Alexa 594 (1:500; red fluorescence, Molecular Probes) or Alexa 488 (1:500; green fluorescence, Molecular Probes). For retinal whole-mounts, the incubation solutions and antibodies concentrations were the same as above, but the incubation time was extended to 48 h for the primary antibodies and 12 h for the secondary antibodies. All steps were carried out at room temperature.
All the antibodies used in this study are listed in Table 1.
Table 1.
Primary antibodies
| Antigen | Immunogen | Manufacturer, species antibody was raised in, mono- vs. polyclonal, lot number | Dilution |
|---|---|---|---|
| DsRed | DsRed-Express (a variant of Discosoma sp. red fluorescent protein) | Clontech, rabbit polyclonal, #632496 | 1:500 |
| Choline Acetyl Transferase | Purified Human Placental Choline Acetyl Transferase | Chemicon, goat polyclonal, #AB144P | 1:2000 |
| Cholera Toxin B | choleragenoid | List Biological Laboratories, goat polyclonal, #703 | 1:2500 |
| Cocaine- and Amphetamine-Regulated Transcript | Rat CART Peptide aa 55-102 | Phoenix Pharmaceuticals, rabbit polyclonal, #H-003-62 | 1:5000 |
| Brn-3b | C-terminus of Brn-3b of human origin (aa 397-410)* | Santa Cruz Biotechnology, goat polyclonal, #sc6026 | 1:2000 |
| Calretinin | Recombinant Rat Calretinin | Chemicon, mouse, monoclonal, #MAB1568 | 1:1000 |
Based on matrix-assisted laser desorption/ionization-time-of-flight and liquid chromatography mass spectrometry performed by Poche and colleagues (Poche et al., 2008).
The DsRed antiserum recognized a specific band of approximately 30-38 kDa on a western blot of lysate from HEK 293 cells stably expressing DsRed (manufacturer's datasheet). This antibody has been characterized previously for use in mouse retina and brain (Gallagher et al., 2010). In the current study this antibody recognizes both red fluorescent proteins: mCherry and tdTomato. The tdTomato fluorescence without antibody enhancement was sufficient to visualize the tdTomato-expressing cells. To reveal fine dendritic structure and reduce bleaching, specimens were stained with the antibodies against DsRed. Anti-ChAT antibody is a well-established marker for retinal cholinergic amacrine cells (Haverkamp et al., 2009). The ChAT antiserum recognized a 70 kDa band on a western blot of mouse brain lysate (manufacturer's datasheet).
The CART antiserum recognized a 5 kDa band on a western blot of rat brain lysate (manufacturer's datasheet). Staining of the retinal tissue produced a pattern of CART immunoreactivity that was identical with previous descriptions (Kay et al., 2011). The calretinin antiserum recognized a single 31 kDa band on a western blot of mouse brain lysate (manufacturer's datasheet). The antibody has been carefully tested in the retina and produced similar staining pattern as other antisera against calretinin (Haverkamp and Wässle, 2000; Haverkamp et al., 2009).
The specificity of the antibodies against CTB has been tested in similar applications (Hattar et al., 2006). In the current study the immunoreactivity was absent in brains from mice not injected with CTB.
The antiserum against Brn3 (C-13) (sc-6026P; Santa Cruz) was raised against the c-terminal of human Brn3b from amino acid 397-410 (manufacturer's datasheet). Immunostaining pattern produced by this antibody coincides with in situ data (Pan et al., 2005). The specificity of the antibodies was also confirmed by preadsorption with the Brn3b blocking peptide (Poche et al., 2008; Jain et al., 2012). The labeling of the GCs observed in the current study was restricted to the nuclei of the cells in the ganglion cell layer similar to the staining achieved by using another antibody against Brn3 (Xiang et al., 1993). In the retina three members of Brn3 family of POU-domain transcription factors have been identified: Brn3a, Brn3b, and Brn3c (Xiang et al., 1993; Xiang et al., 1995). By performing double immunofluorescence labeling in the mouse retina, Brn3a, Brn3b, and Brn3c were reported to label distinct classes of GCs, indicating that these antibodies do not cross react (Jian et al., 2012). Thus, not all Brn3 positive GCs are expected to be labeled with the antibody against Brn3b used in the current study.
Morphological analysis
The images of mCherry-labeled GCs were collected with the x20 objective of a Zeiss Apotome microscope at 0.8 μm Z-stack steps to photograph the entire dendritic trees. Optical sections were taken in Zeiss AxioVision program and saves as original files. All further manipulations including contrast and brightness adjustments as well as morphological measurements were carried out in ImageJ program (obtained from NIH). To minimize the variations of the dendritic diameter due to the change of eccentricity, all the cells analyzed in this study were taken from the region of the retina approximately 2/3 of the radius from the optic nerve. The labeled GCs (PCP2-GCs) were classified using several criteria: soma size, dendritic field sizes in the On- and Off-sublaminae and their ratio, density of the dendritic fields, symmetry of the cell, branch order, the ratio of diving dendrites to the total number of dendrites going to the Off-layer, and stratification levels. To estimate dendritic size, a separate convex polygon was drawn by linking the outermost tips of dendrites in the On- and Off-sublaminae. For On-DSGCs the area of the Off-dendritic field was calculated as the sum of all areas in the Off- layer; the calculated areas were then converted back to a diameter by assuming circular dendritic fields. The soma diameter was calculated in the same way. The ratio between the sizes of dendritic tiers was calculated by dividing the diameter of the field in the On-sublamina by the diameter of the field in the Off-sublamina. The density of the dendritic fields was calculated as total dendritic length of a field divided by the area of the field. The symmetry index was defined as the distance between the centers of the On-dendritic tier and the soma divided by the diameter of the On-tier. Branch order was the largest number of times a dendrite branched.
The stratification of each PCP2-GC was analyzed in the retinas that were stained with the antibodies against ChAT. Z-stack images of PCP2-GC dendrites and ChAT were taken with a Plan Neofluar 40x oil objective with a numerical aperture of 1.3. The objective features an infinity color-corrected optical system. Therefore, additional corrections for wavelength shifted are not needed. The z-stack was taken with the Apotome grid in optical sectioning mode. The z-stack steps were 0.48 μm. Using the ImageJ program, a small rectangle (~1500 μm2) was placed on the distal part of the GC dendritic field, and the total fluorescence of the mCherry-labeled dendrites and ChAT-labeled cholinergic cells was counted within the marked area for each image in the stack. The normalized sum fluorescence was plotted against the number of the images in the stack. The stratification levels in the On- and Off-sublaminae were defined at the maximum fluorescence. The positions of On- and Off-ChAT bands were assigned at 40% and 70% of the inner plexiform layer (IPL), respectively. The stratification levels of the PCP2-GCs were calculated relative to the ChAT-positive bands. For each investigated GC, the measurements were taken at different locations of the rectangle. The vertical retinal images showing stratification of the cells relatively to the cholinergic bands were produced by 90 degree rotation of a thin sliver of the Z-stack image along its x-axis. All data are presented as the mean ± standard deviation.
Cluster Analysis
Cluster analysis was performed using Statistica software (StatSoft, Inc., Tulsa, OK, USA) on seven different parameters: soma size, dendritic field diameters in On- and Off-sublaminae, dendritic densities in the On-sublaminae, the ratio of diving dendrites, and stratification levels of both dendritic tiers. These values were standardized using means and standard deviations in order to prevent larger scaled parameters from having an unequal influence. Two different methods of cluster analysis were chosen: k-means (Kong et al., 2005) and hierarchal clustering (Coombs et. al., 2006). K-means analysis, involves selecting an initial predetermined number of clusters as a “guess”. The analysis then attempts to maximize the distances between each cluster while minimizing the differences between the members within a single cluster. The hierarchical clustering does not require a predetermined number of clusters. This analysis begins by treating each member as its own individual cluster, and the clusters are then grouped together based on similarities in the defined parameters. The features of the individual cells become less important to the result as the cluster analysis proceeds. The final result produces a dendrogram, where two cells with greater similarity are linked together at a lower linkage distance.
Density Recovery profile, nearest neighbor analysis, and coverage factors
The mosaics of the PCP2-GCs were analyzed in 3 retinal whole-mounts from the PCP2-Cre/tdTomato. The retinas with the highest number of tdTomato-positive GCs were chosen (N = 2568 cells, N = 1883 cells, and N = 2090 cells). The images of the entire retina were taken under the x10 objective of a Zeiss Apotome microscope, and a photo merge was created. Cell number and coordinates were obtained in the ImageJ program. The density recovery profile (Rodieck, 1991) and nearest neighbor analysis (Clark and Evans, 1954) were performed in a custom-written Java program. The regularity index was calculated as the ratio of the mean nearest neighbor distance to the standard deviation (Cook, 1996). The coverage factor was calculated as the cell density multiplied by the averaged area of the dendritic field.
Results
Morphological properties of PCP2-cre-positive retinal ganglion cells
Cre-positive retinal ganglion cells in the PCP2-Cre line were visualized by crossing the PCP2-Cre line to a tdTomato reporter mouse line. In retinal whole-mounts (Fig. 1A), the tdTomato labeled cells located in the ganglion cell layer (GCL) were evenly distributed throughout the retina, with no preferences as to the retinal poles. After enhancement of the tdTomato fluorescence with antibodies, the cells were found to have axons (data not shown) and therefore were identified as PCP2-positive ganglion cells (PCP2-GCs). On average, we found 1650 ± 625 (from 6 retinas) PCP2-GCs in a retina. The number of the PCP2-GCs in the retina varied among mice within a range of 1032 to 2568 cells but was similar in both eyes of the same animal. At a higher magnification (Fig. 1B), a fairly regular distribution of PCP2-GCs can be observed. In a few cases, two or three somas were localized close to each other (Fig. 1B, arrows). The punctate structures around PCP2-GCs were the axon terminals of bipolar cells previously described in this mouse line (Ivanova et al., 2010). We further analyzed the spatial distribution of PCP2-GCs using the density recovery profile (Rodieck, 1991) and the nearest neighbor analysis (Clark and Evans, 1954). The cells maintained an effective radius of exclusion of ~24 μm (Fig. 1C), the distance from the center of any PCP2-GC where no other PCP2-GC can be found. The averaged nearest neighbor distance was 44 ± 19 μm (Fig. 1D). For a single type of GCs, the effective radius and the averaged nearest neighbor distance were reported to range from 38-90 and 63-260 μm, respectively (Wässle et al., 1981a and b; Yonehara et al., 2008; Rivlin-Etzion et al., 2011). Our results therefore suggest that PCP2-GCs do not belong to a single type of GCs. We also compared the distribution of our cells with the theoretical random distribution using the regularity index. The regularity index for the same retinas was 2.32 versus a value of 1.91 for a random distribution (p<0.0001). Although, values greater than 2 typically indicate a non-random distribution (Cook, 1996), the regularity index for a single type of GCs was reported to range from 2.6 to 5.2 (Wässle et al., 1981a and b; Rivlin-Etzion et al., 2011). Thus, the PCP2-GCs form a rather imprecise mosaic, again suggesting the presence of more than one type of GCs.
Fig. 1.

Distribution of PCP2-positive GCs in a retinal whole mount and a vertical section. A: Retinal whole-mount with tdTomato labeled GCs photographed at the GCL. White box shows region enlarged in B. B: High magnification of a retinal whole-mount viewed at the GCL. Most the PCP2-positive GC somas were evenly distributed but occasionally two or three somas were found in close proximity (shown by arrows). C: In a density recovery profile, a horizontal bar marks an average cell density (~185 cells / mm2), vertical bar indicates effective radius (~24 μm). D: Nearest neighbor analysis shows the most frequent distances between the neighboring cells (~40 μm). E: In a retinal vertical section, tdTomato fluorescence was detected in photoreceptors, bipolar cells, and a PCP2-positive GC (arrow). F: In a retinal whole mount, the virus-mediated expression of mCherry can be found in Cre-positive GCs. G: In the enlarged area from F, the somas, dendrites, and axons of the mCherry-expressing individual GCs can be clearly seen. ONL: outer nuclear layer; OPL: outer plexiform layer; INL: inner nuclear layer; IPL: inner plexiform layer; GCL: ganglion cell layer. Scale bar = 1000 μm in A and F; 100 μm in B; 25 μm in E; 200 μm in G.
Next, we tried to identify what types of GCs were PCP2-GCs. In the retinal whole mounts and the vertical sections (Fig. 1E), the stratification of their dendrites could not be determined because they were masked by the axon terminals of the brightly tdTomato-labeled bipolar cells. To overcome this problem, we took advantage of the viral-mediated expression of a membrane-anchored red fluorescent protein, channelrhodopsin (ChR2)-mCherry, using the Cre-loxP system specific to Cre-positive retinal GCs. We employed an adeno-associated virus serotype 2 vector (AAV2) that carried an inverted ChR2-mCherry flanked by two loxP sites and driven by the Eflα promoter. After intravitreal injection into the eyes of the PCP2-Cre (tdTomato negative) mice, we found that the virus predominantly infected cells in the GCL. Very few bipolar cells were infected. The expression of the transgene, mCherry, in the infected bipolar cells was barely detectable. Thus, this system provided a way to label the Cre-positive cells in the GCL by ChR2-mCherry following the Cre recombinase-mediated inversion of the floxed ChR2-mCherry (Fig. 1F). To sparsely label individual cells in the GCL, we injected a low concentration of the virus vector into the eyes of PCP2-Cre mice. Indeed, all ChR2-mCherry labeled cells in the injected retinas were found to be GCs because their axons and dendrites could be clearly visualized (Fig. 1G).
Furthermore, as shown in the projection images taken through the GCL to the On-sublamina (Fig. 2A) and through the Off-sublamina (Fig. 2B) of the inner plexiform layer (IPL) (Fig. 2), all of the PCP2-GCs had dendrites stratified both in the On sublamina and the Off sublamina, indicating that all of the PCP2-GCs are bistratified GCs (BGCs). We did not observe any monostratified GCs. Recently, the antibody against cocaine- and amphetamine-regulated transcript (CART) was reported to be a marker for bistratified On-Off DSGCs (Kay et al., 2011). Therefore, we labeled the retina of a PCP2-Cre/tdTomato mouse with a CART antibody. All PCP2-GCs were found to be positive for CART (Fig. 2C-E). Similar results were obtained in the virus-injected retinas that were labeled for CART (data not shown).
Fig. 2.

Morphology and CART immunostaining of PCP2-GCs. A: Projection of the optical sections was taken from GCL through On-sublamina of the IPL. B: Projection of the optical sections in the same region as in A was taken through Off-sublamina. C-E: PCP2-tdTomato positive GCs (C) were stained for CART (D). All tdTomato positive GCs were found to express CART (E). Scale bar = 100 μm in A (applies to B); 50 μm in E (applies to C and D).
To quantitatively determine the subtypes of BGCs contained in the Pcp2-Cre mouse line, we performed cluster analysis of 45 labeled cells from 6 retinas taken from 6 different mice. Seven morphological parameters including their stratification relative to the cholinergic bands were used (see Methods). Two algorithms of cluster analysis were applied to identify the cells: k-means and hierarchal analysis (Fig. 3). To determine the line separating the groups the linkage distance for each successive clustering step was plotted (Fig. 3, insert). A sharp rise in the linkage distance indicated a strong difference between the groups and its value was chosen to separate the cell types (indicated by a dashed line). The hierarchical method yielded five different groups of cells (Fig. 3). Two cell types were similar to the On-DSGCs and On-Off DSGCs previously reported in the mouse retina. Three other types have not been characterized in the mouse retina. We named these three cell types, based on the size of their inner dendritic tiers, as small-, middle-, and big-BGCs. On the cluster tree (Fig. 3) the two types of putative DSGCs were clustered closely to one another. Similar results were obtained with the k-means method (data not shown). Also, it should note here that the middle-BGC appears to be the most heterogeneous based on the results of the cluster analysis (see Fig. 3). It is possible that the middle-BGCs contain more than one type.
Fig. 3.
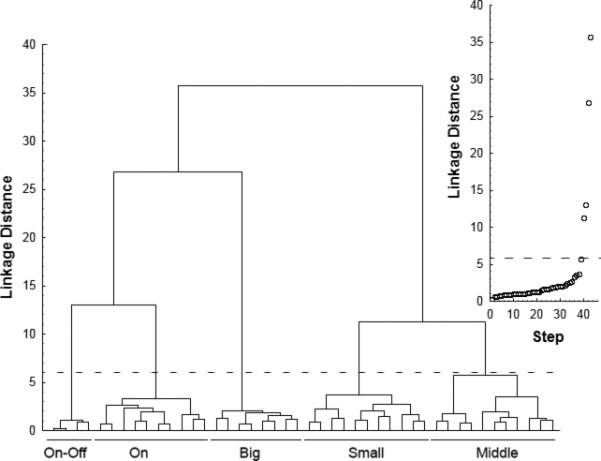
Cluster dendrogram. The linkage distance shows the relative similarities of the cells. The insert shows the linkage distance of each clustering step. The dashed line on the main image and the insert marks abrupt increases in dissimilarity. Cells linked together below the dashed line are defined as cell types: On-Off DSGCs, On-DSGCs, Big-, Small-, and Middle-BGCs.
Figure 4 shows the morphology and stratification of the five types of BGCs. The morphological parameters are summarized in Table 2. The most abundant PCP2-GC type was the middle-BGC (m-BGC, Fig. 4A-F). Up to 37% of the total labeled cells (n = 33) were found to be this cell type. The cells in this group were the most heterogeneous (see the results of the cluster analysis on Fig. 3). Their dendrites were flat-stratified and occupied two narrow strata in the inner IPL (33 ± 1%) and outer IPL (80 ± 2%), outside the laminae formed by the dendrites of the starburst amacrine cells (SACs, Fig. 4D-F). The size of the inner dendritic tier (219 ± 25 μm) (Fig. 4A) was always larger than the outer tier (148 ± 24 μm) (Fig. 4B). The ratio of the inner to outer dendritic tiers was 1.5 ± 0.1. The cells had an average soma diameter of 14.6 ± 1.6 μm. The somas were found anywhere from the middle of the dendritic tree to the very edge (Fig. 4A and B, marked by an asterisk in B), with a symmetricity index of 0.18 ± 0.12. The cells had 3-4 primary dendrites, which sparsely branched with an order of branching of 3-7 in the On-sublamina. In the On-sublamina, some major dendrites, especially in the asymmetric cells, ran parallel to each other. These cells often had varicosities, which might have resulted from a combination of anatomical properties and the fixation protocol. The dendrites occasionally had a few spines, mostly in the Off-sublamina. The number of the dendrites going to the Off-sublamina was 9.2 ± 1.6 (open circles on Fig. 4A and B); one or two (20 ± 20%) of which dived back to the On-sublamina after having reached the Off-stratification level (triangles on Fig. 4A and B).
Fig. 4.

Dendritic morphology and stratification of five types of PCP2-GCs. A, G, M, S, and Y: Projection of the optical sections were taken from GCL through On-sublamina of the IPL. The axons are indicated by arrows. The origins of the dendrites which ascend to the Off-sublamina are labeled by circles; the dendrites which dive back from the Off-sublamina into the On-sublamina are marked by triangles. B, H, N, T, and Z: Dendritic trees of the same cells shown in A, G, M, S, and Y, respectively, also stratified in the outer half of the IPL. The positions of the somas are indicated by asterisks. C, I, O, U, and AA: Normalized fluorescence intensity plotted against the levels of the IPL (green line for ChAT dendrites, magenta line for the PCP2-GC dendrites). The On- and Off-ChAT bands were assigned to 40% and 70% of the IPL, respectively. D, J, P, V, and BB: Z-stack projections taken from GCL through Off-sublamina for the areas marked by dashed areas on both dendritic tiers. The number of optical sections for each projection was 33, 31, 20, 20, and 20, respectively. E, K, Q, W, and CC: Rotated 90 degree along x-axis projections shown on D, J, P, V, and BB respectively. The same projections (magenta) superimposed with the corresponded images of the ChaT bands (green) are shown in F, L, R, X, and DD. Scale bar: 100 μm. Scale bar = 100 μm in Z (applies to A, B, G, H, M, N, S, T, and Y); 100 μm in BB (applies to D, J, P, and V); 10 μm in F, L, R, X, and DD.
Table 2.
Morphological properties of PCP2-GCs
| Type (Cell No.) | Subla mina | Dendritic strat. (% in IPL) | Dendritic diameter | Density of dendritic field | Ratio of On/Off dendritic diameters | Soma diameter (μm) | Symm. index | % of Diving dendrites |
|---|---|---|---|---|---|---|---|---|
| m- BGC (n = 11) | On | 33 ± 1 | 219 ± 25 | 0.034 ± 0.003 | 1.5 ± 0.1 | 14.6 ± 1.6 | 0.18 ± 0.12 | 20 ± 20 |
| Off | 80 ± 2 | 148 ± 24 | 0.035 ± 0.006 | |||||
| s-BGC (n = 11) | On | 33 ± 2 | 155 ± 18 | 0.039 ± 0.003 | 1.1 ± 0.2 | 13.6 ± 0.9 | 0.17 ± 0.10 | 50 ± 10 |
| Off | 78 ± 2 | 138 ± 15 | 0.033 ± 0.009 | |||||
| b-BGC (n = 7) | On | 31 ± 1 | 291 ± 18 | 0.026 ± 0.001 | 1.4 ± 0.2 | 18.2 ± 0.8 | 0.07 ± 0.05 | 10 ± 10 |
| Off | 78 ± 2 | 214 ± 27 | 0.023 ± 0.005 | |||||
| ON-DSGC (n = 10) | On | 40 ± 0 | 295 ± 33 | 0.029 ± 0.003 | 4.3 ± 1.0 | 16.6 ± 1.3 | 0.17 ± 0.09 | 30 ± 20 |
| Off | 70 ± 0 | 72 ± 18 | n.a. | |||||
| ON-OFF-DSGC (n = 4) | On | 40 ± 0 | 172 ± 6 | 0.034 ± 0.002 | 1.1 ± 0.1 | 17.4 ± 0.4 | 0.13 ± 0.03 | 0 ± 0 |
| Off | 70 ± 0 | 159 ± 15 | 0.036 ± 0.003 |
ChAT bands: ON – 40%, OFF – 70%; n.a. – not applicable, strat. – stratification, symm. - symmetricity. Data presented as a mean ± SD
The second most common type was the small-BGC (s-BGC, Fig. 4G-L), which accounted for approximately 35% of the labeled cells (n = 32). As with the m-BGC, these cells also stratified in the inner IPL (33 ± 2%) and outer IPL (78 ± 2%), just outside the cholinergic strata (Fig. 4J-L). However, unlike the m-BGC, their dendrites occupied two broad bands in both sublaminae (wide peaks marked by a magenta line on Fig. 4I). The diameter of the inner and outer dendritic tiers were similar (155 ± 18 μm and 138 ± 15 μm, respectively), with a ratio of the inner to outer dendritic tiers of 1.1 ± 0.2. The cells had an average soma diameter of 13.6 ± 0.9 μm. Many of these cells were also asymmetric, with a symmetricity index of 0.17 ± 0.1. The cells usually had four primary dendrites branching 3-7 times in the On-sublamina. In the On-sublamina, all cells had spines; some spines were also present in the Off-sublamina. The cells had 15 ± 3 dendrites going to the Off-layer, half of which (50 ± 10%) dived back to the On-layer. The dendrites that returned from the Off-layer usually branched a few times in the On-layer. Because of the broad stratifications in the strata and high number of diving dendrites, the dendritic tree had a “broken” appearance.
The third type was the big-BGC (b-BGC, Fig. 4M-R). These cells were less often observed (~9%; n = 8). As with the other two types, b-BGCs also stratified outside the cholinergic bands in the inner IPL (31 ± 1%) and outer IPL (78 ± 2%). The cells had large On- and Off-dendritic trees. Like the m-BGCs, the On-dendritic tiers (291 ± 18 μm) were larger than the Off-tiers (214 ± 27 μm), with a ratio of the inner to outer dendritic tiers of 1.4 ± 0.2. The cells had a large soma, with an average soma diameter of 18.2 ± 0.8 μm. The somas were located in the center of the dendritic tree, with a symmetricity index of 0.07 ± 0.05. The cells had, on average, four primary dendrites that branched 3-7 times in the On-sublamina. The dendrites in the On-layer were straight, narrowly stratified, and extended radially from the body. These cells had no or a very few (10 ± 10%) diving dendrites, which did not branch in the On-layer. Spines were rarely observed in these cells.
The last two PCP2-GC types were presumably the well-characterized direction-selective GCs (DSGCs). Approximately 14% (n = 13) of the observed cells were On-DSGCs (Fig. 4S-X), and 4% (n = 4) were On-Off DSGCs (Fig. 4Y-DD). The On- and Off-dendrites for both On-DSGCs and On-Off DSGCs were stratified at the same levels of the two cholinergic bands (Fig. 4U and 4AA). The On-DSGCs had large dendritic tiers in the On-sublamina (295 ± 33 μm) (Fig. 4S). The cells had an average soma diameter of 16.6 ± 1.3 μm and a symmetricity index of 0.17 ± 0.09. The dendrites were highly branched (4-11 orders), smooth, and wavy. They had an average of 11 ± 3 (30 ± 20%) branches going to the Off-layer, with a few of the branches returning to the On-sublamina. The Off-tier was represented by a few very short branches (Fig. 4T).
For On-Off DSGCs, the On-tiers (172 ± 6 μm) were slightly larger than the Off-tiers (159 ± 15 μm), with a ratio of the inner and outer dendritic tiers of 1.1 ± 0.1. The cells had an average soma diameter of 17.4 ± 0.4 μm and a symmetricity index of 0.13 ± 0.03. Their dendrites were wavy, highly branched (5-10 orders), and regularly spaced. A number of very short branches (spines) were present in both sublaminae. No diving dendrites were spotted.
Dendritic overlap of the PCP2-GCs
We calculated the coverage factors for the two most frequent types of PCP2-GCs. The eye with the highest number of the PCP2-Cre/tdTomato GCs (2568 cells / retina) was used to determinate the cell density. The density for the individual type was estimated based on the encounter frequency in our entire data pull. The coverage factor for m-BGC was 2.9 and 1.3 for On- and Off-dendritic field, respectively. Thus, the m-BGCs exhibited significant overlap in the On sublamina and much less in the Off-sublamina. The s-BGCs had little overlap in the On-sublamina (the coverage factor 1.4) and were tiling the retina in the Off-sublamina (the coverage factor 1.1).
Dendritic interactions between PCP2-GCs and SACs
Next, we examined the fine morphological features of the PCP2-GC dendrites and their co-stratification with SAC processes. As expected, the dendrites of the DSGCs, On-Off DSGCs and On-DSGCs, were colocalized with the ChAT-positive processes (Fig. 5). These DSGCs were contained within the On- and Off-ChAT bands, and their dendrites co-localized with the ChAT-positive puncta. The dendrites of the On-Off DSGCs were covered by spines. For all DSGCs encountered in the current study, the majority of the dendrites followed the ChAT-positive plexus without crossing large areas that did not contain cholinergic processes. In contrast to the DSGCs, the rest of the PCP2-positive GCs stratified outside the cholinergic plexus (Fig. 6). Few processes came close to the cholinergic strata. Also, the processes did not follow the cholinergic plexus but rather crossed the ChAT-positive processes or occupied a space between them. Figure 6 shows in focus the On-dentritic tiers of the m-BGC (A), s-BGC (F), and big-BGC (K). The cholinergic stratum is out-of-focus for all three images (Fig. 6B, G, and L). The dendrites of the m-BGCs and the b-BGCs had a similar branching pattern, straight with a few branches, except that the dendrites of m-BGCs had more varicosities (Fig. 6A and K). In contrast, the dendrites of the s-BGCs had numerous spines and different orientations (Fig. 6F).
Fig. 5.

Comparison of dendritic stratification of two types of the putative DSGCs with the On-cholinergic plexus. A, F: On-dendritic tier of On-Off DSGC (A) and On-DSGC (F). B, G: Both cells shown in A and F (magenta, in focus) stratified at the On-ChAT band and followed the cholinergic plexus (green, in focus). C-E, H-J: Z-stack projection rotated 90 degree along the x-axis from the boxed area shown in B and G respectively. The number of optical sections for each projection was 20. Scale bar = 10 μm in G (applies to A, B, and F); 10 μm in E and J.
Fig. 6.

Stratification of the dendrites of m-, s-, and b-BGCs in the On-sublamina. A, F, and K: On-dendritic tier of m-BGC (A), s-BGC (F), and b-BGC (K). B, G, and L: Cells shown in A, F, and K (magenta, in focus) stratified below the On-ChAT (green, out of focus). C-E, H-J, and M-O: Z-stack projection rotated 90 degree along the x-axis from the boxed area shown in B, G, and L respectively. The number of optical sections for each projection was 33, 31, and 17, respectively. Scale bar = 10 μm in L (applies to A, B, F, G, and K); 10 μm in E, J, and O.
Molecular differences of the PCP2-GCs
We then examined the distribution of common GC immunocytochemical markers in the PCP2-GCs. Two antibodies were chosen. One antibody targets a protein, Brn3, which belongs to the family of transcription factors that are expressed exclusively in GCs and recognizes the Brn3b isoform (Xiang et al., 1993; Jain et al., 2012). Another antibody recognizes a calcium-binding protein, calretinin, which is expressed in ~86% of all retina GCs (Lee et al., 2010).
In this set of experiments, we used retinas with a low number of viral infection-labeled GCs. The PCP2-GC types were identified based on their morphological properties, and at least 6-7 representative cells were analyzed for each staining. Figure 7 shows the results for the labeling. We found that all PCP2-GCs, m-BGCs, s-BGCs, and b-BGCs, which did not costratify with the cholinergic bands, were negative for Brn3b, as shown in Fig. 7A-B for m-BGCs and in Fig. 7E-F for b-BGCs with the exception that sometimes weak labeling of Brn3b was observed in s-BGCs, as can be seen in Fig. 7C-D. All the above cells were positive for calretinin (Fig. 7I-O). In contrast, the On-DSGCs were always positive for Brn3b (Fig. 7G-H) but negative for calretinin (Fig. 7P-Q). We were not able to reliably characterize the On-Off DSGCs because they were rarely encountered.
Fig. 7.

Immunostaining of PCP2-BGCs for Brn-3b and calretinin. A-B: The nucleus of m-BGC (A, arrow) was negative for Brn-3b (B, arrow). C-D: The nucleus of the s-BGC (C, arrow) was sometimes weakly stained with the antibody against Brn-3b (D, arrow). E-F: b-BGCs were negative for Brn-3b (arrow). G-H: On-DSGCs were positive for Brn-3b (arrows). I-O: The somas of m-BGC (I-J, arrow), s-BGC (K-L, arrow), and b-BGC (M-O, arrow) were positive for calretinin. P-Q: The somas of the two putative On-DSGCs (arrows) were negative for calretinin. bv - blood vessel. Scale bar = 50 μm in Q (applies to all panels).
Central projections of the PCP2-GCs
Finally, we examined the central projection of the PCP2-GCs. For this experiment, one eye of a PCP2-Cre positive mouse was injected with a high virus concentration so that as many PCP2-GCs were labeled as possible. Four days prior to sacrificing the animals, both eyes of the mouse were injected with cholera toxin b subunit (CTB) to label all GCs in the retina. Figure 8 shows the projection patterns of the CTB labeled GCs (green; first row) and the PCP2-GCs (magenta; second row) in four different cross-sections of the brain: lateral geniculate nucleus (LGN), superior colliculus (SC), medial terminal nucleus (MTN), and suprachiasmatic nucleus (SCN). On the ipsilateral side of the brain, very few labeled processes were detected in the LGN and SC (data not shown). In the contralateral side, the axons of PCP2-positive cells were projecting to both the dorsal and ventral LGN (dLGN and vLGN) (Fig. 8B) and the SC (Fig. 8E). In the vLGN, the processes were confined to a thin superficial layer just beneath the optic tract. Within the dLGN, the projections were found in an area located close to the optic tract and in a ventral area close to the IGL. No processes were found in the intergeniculate leaflet of the lateral geniculate complex (IGL) and the olivary pretectal nucleus (OPN).
Fig. 8.

Central projection patterns of PCP2-GCs. All sections were photographed in the brain of the same mouse. The axon terminals of all GCs in both eyes were labeled by cholera toxin b subunit coupled to Alexa 488 (CTB, A, D, G, and J). Four different cross-section levels of the brain, LGN, SC, MTN, and SCN, contralateral to the eye injected with the viral vectors carrying a cre-excisable reporter gene (mCherry, B, E, H, and K) are shown. A-C: In the coronal section through the LGN, the projections of the PCP2-GCs were observed in the lateral part of the vLGN and ventro-lateral part of the dLGN. They were absent from the IGL and the OPN (C). D-F: The projections of the PCP2-GCs were located predominantly within a narrow superficial sublamina of the SC. G-I: Very weak mCherry-fluorescence was detected in the MTN. J-L: No mCherry-positive fibers were detected in the SCN region but were observed in the nearby OT. vLGN – ventral lateral geniculate nucleus; dLGN - dorsal lateral geniculate nucleus; SC – superior colliculus; IGL – intergeniculate leaflet of the lateral geniculate complex; OPN – olivary pretectal nucleus; MTN – medial terminal nucleus; SCN – suprachiasmatic nucleus; OT – optic tract. Scale bar = 450 μm in C and F; 200 μm in I and L.
In the SC, the axons were stratifying in a very thin, mostly superficial lamina (Fig. 8E). In the MTN nucleus, only a very weak fluorescence was detected (Fig. 8H). Projections were not detected in the SCN (Fig. 8K).
Discussion
In this study, we characterized the Cre-positive retinal GCs in the PCP2-cre mouse line. Although Cre is also expressed in many bipolar cells in this mouse line (Ivanova et al., 2010), we took the advantage of the fact that the Cre-dependent AAV 2 vector with Eflα promoter through intravitreal injection predominantly infects GCs. Thus, the AAV vector-mediated labeling allowed us to study the fine morphological features of the PCP2-GCs'dendritic trees without their being masked by the axon terminals of the Cre-positive bipolar cells. Our results determined that all of the Cre-positive retinal ganglion cells were BGCs. Our studies indicated that there were five types of Cre-positive BGCs based on morphological criteria. Three of the five types had On- and Off-dendrites that stratified outside of the cholinergic bands, and these three types differed from DSGCs morphologically. These cells were negative for Brn-3b and positive for calretinin and CART retinal cell markers. The remaining two types had tight cofasciculation of their On- and Off-dendrites with cholinergic bands and were identified as putative On-Off and On-DSGCs.
Comparison with previous morphological studies
The morphological classification of retinal GCs in mice has been addressed by a number of previous studies, which have identified 12 – 22 GC types (Doi et al., 1995; Sun et al., 2002b; Badea and Nathans, 2004; Kong et al., 2005; Coombs et al., 2006; Volgyi et al., 2009). These previous studies utilized methods such as such as the random labeling of cells after horseradish peroxidase injections (Doi et al., 1995), DiI/DiO labeling (Sun et al., 2002b; Kong et al., 2005; Coombs et al., 2006), neurobiotin/Lucifer Yellow injections (Kong et al., 2005; Coombs et al., 2006; Volgyi et al., 2009), random Cre-mediated alkaline phosphatase expression in a small fraction of cells (Badea and Nathans, 2004), and GFP expression in transgenic mouse lines (Kong et al., 2005; Coombs et al., 2006). To facilitate the comparison of our identified GC types with those previously reported classes, we adapted the commonly used classification criteria, such as soma size, dendritic field diameters in On- and Off-sublaminae, dendritic densities in the On-sublaminae, the ratio of diving dendrites, ratio of the dendritic field diameters, and stratification levels of both dendritic tiers in the IPL to characterize the PCP2-GCs in this study. In particular, we directly compared the On- and Off-dendritic stratification of the PCP2-GCs with the ChAT bands in addition to their On and Off stratification levels in the IPL because, due to the variability within a cell type and the different ways to conduct the measurements, the stratification level for a single cell type can vary significantly (Sun et al., 2002b; Volgyi et al., 2009).
One of the two most abundant BGCs found in the PCP2-cre line in this study is the m-BGC. This group was also morphologically most heterogeneous, possibly containing more than one type (see Fig. 3). The most prominent features for the m-BGC are the following: 1) the stratification of their On- and Off-dendritic trees outside the cholinergic bands; and 2) the intermediate size of the dendritic tree, with the inner tier significantly larger than the outer tier. The only GC type that resembles the m-BGC is the G12 cell, described by Volgyi and colleagues (2009). In both cells, the inner dendritic tiers are very close in size to ~200 μm and are larger than the outer ones. Overall, both cells exhibited sparse branching and irregular architecture of the dendritic trees. However, the stratification of the On- and Off-dendritic trees of the G12 cell relative to the ChAT bands is not known because the previous study measured the stratification according to the IPL borders (Volgyi et al., 2009).
The s-BGC, another abundant BGCs in this mouse line, morphologically resembled the previously reported D1-cell (Sun et al., 2002b), a bistratified cell with Brn3c morphology (Badea and Nathans, 2011), Type-3 GC (Schubert et al., 2005). Like the s-BGCs, these cells had small somas, small dendritic fields with equal sizes of On- and Off-dendritic tiers, and a “broken” dendritic appearance. In addition, these cells had a high number of diving dendrites (Badea and Nathans, 2011) and a “very spiny morphology” (Schubert et al., 2005), both of which are also unique features of the s-BGCs. Furthermore, the cells had broad stratification and occupied thick bands around the cholinergic processes. Unfortunately, of these previous studies, only Schubert and colleagues (2005) described the stratification levels of the cells relative to the ChAT bands. However, the authors interpreted the stratification of their Type 3 cells as inside the cholinergic bands, although in Fig. 3C and 6C of their paper, dendrites that stratified outside the cholinergic bands can also been seen. Thus, the discrepancy in the stratification levels may result from the way the stratification level was defined.
The b-BGC type was rare in our samples. We could not match the morphology of these cells to any previously reported BGC type in the mouse retina (Sun et al., 2002b; Schubert et al., 2005; Coombs et al., 2006; Volgyi et al., 2009). The cells possessed large “radiate” inner dendritic tires and smaller irregular outer dendritic tiers. Their large somas were located in the center of the dendritic field. Overall, the cells had a symmetrical appearance.
The remaining two infrequently encountered types of BGCs in the PCP2-Cre mouse line closely resembled the On-DSGC and On-Off DSGC seen in rabbits (Amthor et al., 1984; Buhl and Peichl, 1986; Amthor et al., 1989) and mice (Sun et al., 2002b; Coombs et al., 2006; Schubert et al., 2005). Like the On-Off DSGCs or D2 (Sun et al., 2002b), M12 (Coombs et al., 2006), or type 2 (Schubert et al., 2005) cell types previously described in mice, our On-Off DSGCs co-stratified with ChAT bands and had a high order of branching and relatively large somas. The dendritic field diameter of our On-Off DSGCs was ~170 μm, which is comparable with BD DSGCs (Kim et al., 2010) but is on the lower side of the 154-385 μm range for D2 cells (Sun et al., 2002b). Additionally, like the On-DSGCs previously described in mice, such as the C1 (Sun et al., 2002b) or M4a (Coombs et al., 2006) types, our On-DSGCs had few dendrites going up to the Off-cholinergic plexus (Buhl and Peichl, 1986; Amthor et al., 1989; Famiglietti, 1992; He and Masland, 1998; Sun et al., 2006). Functionally, the On-Off DSGCs are subdivided into four subtypes, each responding to motion in one cardinal direction: anterior, posterior, superior, or inferior (Barlow and Hill, 1963; Oyster and Barlow, 1967). On-DSGCs are subdivided into three classes, with preferred directions corresponding roughly to superior, inferior, and anterior in the visual field (Oyster and Barlow, 1967; Oyster, 1968). It would be interesting to determine whether the Cre-positive DSGCs of the PCP2-cre line are a specific subtype of the On-Off DSGCs and On-DSGCs.
Mosaics of the PCP2-GCs
The important characteristics of the cell type in the retina are a regular distribution of its members across the retina and the tiling the retina by their dendritic fields, so that every point of the visual space is “seen” by at least one GC of each physiological type (Wässle et al., 1981c). We estimated the dendritic coverage and tiling of the retina for the two most frequently encountered Pcp2-GCs types: m-BGCs and s-BGCs. The calculated coverage factors for m-BGC suggest significant overlap in their dendritic fields in the On-sublamina and some overlap in the Off-sublamina. The calculated coverage factors also suggest that the retina was tiled by the dendrites of s-BGCs in both sublaminae. Thus, based on the density, regularity index, and dendritic coverage, these two types may form mosaics. However, it should note that coverage analysis for the labeled cells in transgenic mouse lines has its limitation, that is, not necessary all the members of a single cell type express the transgene in transgenic mouse lines. Therefore, it is possible the coverage factors for m-BGCs and s-BGCs could be underestimated. In fact, the very low density of the two types of the putative DSGCs observed in this line suggests that not all cells of these two types of DSGCs express cre recombinase in this mouse line. This is also likely to be the case for the b-BGCs.
Molecular markers of PCP2-GCs
We have also investigated the possible molecular markers for the BGCs revealed in the PCP2-cre line. The antibodies to CART were previously described as specific marker for On-Off DSGCs (Kay et al., 2011). Surprisingly, all PCP2-GCs in our sample were also positive for CART. Bearing in mind that our s-, m-, and b-BGCs neither co-fasciculate with ChAT bands, as do classic DSGCs, nor have particularly asymmetric dendritic tree shapes, as do JAM-B GCs (Kim et al., 2008). Thus, our results suggest that the antibodies to CART label a broader group of bistratified GCs. In addition, we found that m-, s- and b-BGCs were negative for Brn-3b transcription factor and positive for calretinin, with the exception of s-BGCs, which were occasionally weakly labeled with Brn-3b. It may be possible that our s-, m-, and b-BGCs form a genetically related group containing these molecular markers. Consistent with this notion, a recent study reported that three isoforms of Brn-3 antibodies, Brn-3a, Brn-3b, and Brn-3c, identify distinct types of retinal GCs (Jain et al., 2012). The differential expression of three Brn3 transcription factors in morphologically distinct GCs has also been reported (Badea and Nathans, 2011; Jain et al., 2012). In particular, the Brn-3b positive GCs were reported to be morphologically similar to melanopsin-expressing GCs (Badea and Nathans, 2011). Interestingly, Lee and colleagues (2010) found that 31% of their BGCs in the mouse retina were positive for calretinin (Lee et al., 2010). Because all three types of non-directional selective BGCs in our study were negative for calretinin, it is possible that their BGCs contained not only DSGCs and but also other bistratified cells. It has been shown that molecular markers can be used to distinguish closely related neuronal subtypes (Kay et al., 2011). Thus, our results suggest that the combination of calretinin and Brn-3 markers may be used to identify subgroups of BGCs.
Brain projections of PCP2-GCs
In the brain, PCP2-GCs strongly innervate the lateral margin of the vLGN and the ventro-lateral area of the dLGN as well as the superficial layers of SC nuclei. Because the two types of PCP2-GCs, s-BGC and m-BGCs, together compose approximately 72% of PCP2-GCs in this mouse line and also because the viral-mediated transfections could only target up to 20 - 30% of Cre expressing GCs in the retina (Ivanova and Pan, 2009), the projection patterns are likely to reflect primarily those of these two BGC types. The projections had some similarities with those of On-Off DSGCs (Huberman et al., 2009; Kim et al., 2010; Kay et al., 2011; Rivlin-Etzion et al., 2011; Trenholm et al., 2011). They were found predominantly in contralaterally innervated regions, with few terminals on the ipsilateral side. The axon terminals were absent in the suprachiasmatic nucleus, and very few were present in MTN, which may result from the projection of the less common PCP2-GCs, such as ON-DSGCs. In the dLGN, the axon terminals were detected in a superficial lamina, and in the superior colliculus, they were confined in a narrow superficial region. However, in contrast to most DSGCs, we detected strong projections in the vLGN, an area that is commonly excluded from the targeting of DSGCs (Huberman et al., 2009; Kim et al., 2010; Kay et al., 2011). Only some projections of a subtype of DSGCs that is responsible for the detection of nasally moving objects (the TRHR mouse line) have been observed in the vLGN (Rivlin-Etzion et al., 2011). We do not know whether m- and s-BGCs play role in direction selectivity. However, they have much in common with On-Off DSGCs.
An accumulating body of evidence suggests that BGCs in the mouse retina contain not only “classic” DSGCs but also include other GCs whose functions are yet to be studied, in part due to a lack of labeled cell types. Thus, the PCP2-Cre mouse line provides a unique opportunity to investigate these types of BGCs. As shown in this study, when crossed with a strong reporter mouse, such as the tdTomato reporter line, the expression of the fluorescence marker is sufficient for targeting cells in the living retina. Fine morphological features of the cells can be revealed after virus-mediated expression of a membrane-anchored fluorescence protein. More importantly, the capability to perform gene manipulation with the Cre/LoxP recombination system can enable further studies of the molecular and functional properties of these BGCs.
Acknowledgements
This work was supported by NIH grant EY17130 to Z.-H. P., the Wayne State University (WSU) MD/PhD program (P.L.), and core grant EY04068 to Department of Anatomy and Cell Biology at Wayne State University, the Ligon Research Center of Vision, and Research to Prevent Blindness to Department of Ophthalmology at Wayne State University.
We thank T. Ganjawala and Q. Lu for technical assistance.
Footnotes
Conflict of interest statement
The authors declare that they have no conflicts of interest.
Role of authors
Study concept and design: Ivanova and Pan. Acquisition of data: Ivanova. Analysis and interpretation of data: Ivanova and Lee. Drafting of the manuscript: Ivanova and Pan. Critical revision of the manuscript for important intellectual content: Ivanova and Pan. Statistical analysis: Ivanova and Lee. Obtained funding: Pan
Literature cited
- Amthor FR, Oyster CW, Takahashi ES. Morphology of on-off direction-selective ganglion cells in the rabbit retina. Brain Res. 1984;298:187–190. doi: 10.1016/0006-8993(84)91167-3. [DOI] [PubMed] [Google Scholar]
- Amthor FR, Oyster CW, Takahashi ES. Quantitative morphology of rabbit retinal ganglion cells. Proc R Soc Lond B Biol Sci. 1983;217:341–355. doi: 10.1098/rspb.1983.0014. [DOI] [PubMed] [Google Scholar]
- Amthor FR, Takahashi ES, Oyster CW. Morphologies of rabbit retinal ganglion cells with complex receptive fields. J Comp Neurol. 1989;280:97–121. doi: 10.1002/cne.902800108. [DOI] [PubMed] [Google Scholar]
- Badea TC, Nathans J. Quantitative analysis of neuronal morphologies in the mouse retina visualized by using a genetically directed reporter. J Comp Neurol. 2004;480:331–351. doi: 10.1002/cne.20304. [DOI] [PubMed] [Google Scholar]
- Badea TC, Nathans J. Morphologies of mouse retinal ganglion cells expressing transcription factors Brn3a, Brn3b, and Brn3c: analysis of wild type and mutant cells using genetically-directed sparse labeling. Vision Res. 2011;51:269–279. doi: 10.1016/j.visres.2010.08.039. [DOI] [PMC free article] [PubMed] [Google Scholar]
- Barlow HB, Hill RM. Selective sensitivity to direction of movement in ganglion cells of the rabbit retina. Science. 1963;139:412–414. doi: 10.1126/science.139.3553.412. [DOI] [PubMed] [Google Scholar]
- Barlow HB, Hill RM, Levick WR. Retinal ganglion cells responding selectively to direction and speed of image motion in the rabbit. J Physiol. 1964;173:377–407. doi: 10.1113/jphysiol.1964.sp007463. [DOI] [PMC free article] [PubMed] [Google Scholar]
- Branda CS, Dymecki SM. Talking about a revolution: The impact of site-specific recombinases on genetic analyses in mice. Dev Cell. 2004;6:7–28. doi: 10.1016/s1534-5807(03)00399-x. [DOI] [PubMed] [Google Scholar]
- Buhl EH, Peichl L. Morphology of rabbit retinal ganglion cells projecting to the medial terminal nucleus of the accessory optic system. J Comp Neurol. 1986;253:163–174. doi: 10.1002/cne.902530204. [DOI] [PubMed] [Google Scholar]
- Clark PJ, Evans FC. Distance to Nearest Neighbor As A Measure of Spatial Relationships in Populations. Ecology. 1954;35:445–453. [Google Scholar]
- Cook JE. Spatial properties of retinal mosaics: An empirical evaluation of some existing measures. Vis Neurosci. 1996;13:15–30. doi: 10.1017/s0952523800007094. [DOI] [PubMed] [Google Scholar]
- Coombs J, Van Der LD, Wang GY, Chalupa LM. Morphological properties of mouse retinal ganglion cells. Neuroscience. 2006;140:123–136. doi: 10.1016/j.neuroscience.2006.02.079. [DOI] [PubMed] [Google Scholar]
- Doi M, Uji Y, Yamamura H. Morphological classification of retinal ganglion cells in mice. J Comp Neurol. 1995;356:368–386. doi: 10.1002/cne.903560305. [DOI] [PubMed] [Google Scholar]
- Famiglietti EV. Dendritic co-stratification of ON and ON-OFF directionally selective ganglion cells with starburst amacrine cells in rabbit retina. J Comp Neurol. 1992;324:322–335. doi: 10.1002/cne.903240303. [DOI] [PubMed] [Google Scholar]
- Famiglietti EV. Bistratified ganglion cells of rabbit retina: neural architecture for contrast-independent visual responses. Vis Neurosci. 2009;26:195–213. doi: 10.1017/S0952523808080929. [DOI] [PubMed] [Google Scholar]
- Gallagher SK, Witkovsky P, Roux MJ, Low MJ, Otero-Corchon V, Hentges ST, Vigh J. Beta-Endorphin expression in the mouse retina. J Comp Neurol. 2010;518:3130–48. doi: 10.1002/cne.22387. [DOI] [PMC free article] [PubMed] [Google Scholar]
- Gradinaru V, Zhang F, Ramakrishnan C, Mattis J, Prakash R, Diester I, Goshen I, Thompson KR, Deisseroth K. Molecular and cellular approaches for diversifying and extending optogenetics. Cell. 2010;141:154–165. doi: 10.1016/j.cell.2010.02.037. [DOI] [PMC free article] [PubMed] [Google Scholar]
- Hattar S, Kumar M, Park A, Tong P, Tung J, Yau KW, Berson DM. Central projections of melanopsin-expressing retinal ganglion cells in the mouse. J Comp Neurol. 2006;497:326–49. doi: 10.1002/cne.20970. [DOI] [PMC free article] [PubMed] [Google Scholar]
- Haverkamp S, Inta D, Monyer H, Wassle H. Expression analysis of green fluorescence protein in retinal neurons of four transgenic mouse lines. Neurosci. 2009;160:126–139. doi: 10.1016/j.neuroscience.2009.01.081. [DOI] [PubMed] [Google Scholar]
- Haverkamp S, Wässle H. Immunocytochemical analysis of the mouse retina. J Comp Neurol. 2000;424:1–23. [PubMed] [Google Scholar]
- He S, Masland RH. ON direction-selective ganglion cells in the rabbit retina: dendritic morphology and pattern of fasciculation. Vis Neurosci. 1998;15:369–375. doi: 10.1017/s095252389815215x. [DOI] [PubMed] [Google Scholar]
- Hoshi H, Tian LM, Massey SC, Mills SL. Two distinct types of ON directionally selective ganglion cells in the rabbit retina. J Comp Neurol. 2011;519:2509–2521. doi: 10.1002/cne.22678. [DOI] [PMC free article] [PubMed] [Google Scholar]
- Huberman AD, Wei W, Elstrott J, Stafford BK, Feller MB, Barres BA. Genetic identification of an On-Off direction-selective retinal ganglion cell subtype reveals a layer-specific subcortical map of posterior motion. Neuron. 2009;62:327–334. doi: 10.1016/j.neuron.2009.04.014. [DOI] [PMC free article] [PubMed] [Google Scholar]
- Huxlin KR, Goodchild AK. Retinal ganglion cells in the albino rat: revised morphological classification. J Comp Neurol. 1997;385:309–323. [PubMed] [Google Scholar]
- Ivanova E, Hwang GS, Pan ZH. Characterization of transgenic mouse lines expressing Cre recombinase in the retina. Neuroscience. 2010;165:233–243. doi: 10.1016/j.neuroscience.2009.10.021. [DOI] [PMC free article] [PubMed] [Google Scholar]
- Ivanova E, Pan ZH. Evaluationof the adeno-associated virus mediated long-term expression of channelrhopsin-2 in the mouse retina. Mol Vis. 2009;15:1680–9. [PMC free article] [PubMed] [Google Scholar]
- Jain V, Ravindran E, Dhingra NK. Differential expression of Brn3 transcription factors in intrinsically photosensitive retinal ganglion cells in mouse. J Comp Neurol. 2012;520:742–755. doi: 10.1002/cne.22765. [DOI] [PubMed] [Google Scholar]
- Kay JN, De lH I, Kim IJ, Zhang Y, Yamagata M, Chu MW, Meister M, Sanes JR. Retinal ganglion cells with distinct directional preferences differ in molecular identity, structure, and central projections. J Neurosci. 2011;31:7753–7762. doi: 10.1523/JNEUROSCI.0907-11.2011. [DOI] [PMC free article] [PubMed] [Google Scholar]
- Kim IJ, Zhang Y, Meister M, Sanes JR. Laminar restriction of retinal ganglion cell dendrites and axons: subtype-specific developmental patterns revealed with transgenic markers. J Neurosci. 2010;30:1452–1462. doi: 10.1523/JNEUROSCI.4779-09.2010. [DOI] [PMC free article] [PubMed] [Google Scholar]
- Kim IJ, Zhang Y, Yamagata M, Meister M, Sanes JR. Molecular identification of a retinal cell type that responds to upward motion. Nature. 2008;452:478–482. doi: 10.1038/nature06739. [DOI] [PubMed] [Google Scholar]
- Kong JH, Fish DR, Rockhill RL, Masland RH. Diversity of ganglion cells in the mouse retina: unsupervised morphological classification and its limits. J Comp Neurol. 2005;489:293–310. doi: 10.1002/cne.20631. [DOI] [PubMed] [Google Scholar]
- Lee ES, Lee JY, Jeon CJ. Types and density of calretinin-containing retinal ganglion cells in mouse. Neurosci Res. 2010;66:141–150. doi: 10.1016/j.neures.2009.10.008. [DOI] [PubMed] [Google Scholar]
- Levick WR. Receptive fields and trigger features of ganglion cells in the visual streak of the rabbits retina. J Physiol. 1967;188:285–307. doi: 10.1113/jphysiol.1967.sp008140. [DOI] [PMC free article] [PubMed] [Google Scholar]
- Lewis PM, Gritli-Linde A, Smeyne R, Kottmann A, McMahon AP. Sonic hedgehog signaling is required for expansion of granule neuron precursors and patterning of the mouse cerebellum. Dev Biol. 2004;270:393–410. doi: 10.1016/j.ydbio.2004.03.007. [DOI] [PubMed] [Google Scholar]
- Madisen L, Zwingman TA, Sunkin SM, Oh SW, Zariwala HA, Gu H, Ng LL, Palmiter RD, Hawrylycz MJ, Jones AR, Lein ES, Zeng H. A robust and high-throughput Cre reporting and characterization system for the whole mouse brain. Nat Neurosci. 2010;13:133–140. doi: 10.1038/nn.2467. [DOI] [PMC free article] [PubMed] [Google Scholar]
- Nagy A. Cre recombinase: the universal reagent for genome tailoring. Genesis. 2000;26:99–109. [PubMed] [Google Scholar]
- Oyster CW. The analysis of image motion by the rabbit retina. J Physiol. 1968;199:613–635. doi: 10.1113/jphysiol.1968.sp008671. [DOI] [PMC free article] [PubMed] [Google Scholar]
- Oyster CW, BARLOW HB. Direction-selective units in rabbit retina: distribution of preferred directions. Science. 1967;155:841–842. doi: 10.1126/science.155.3764.841. [DOI] [PubMed] [Google Scholar]
- Pan L, Yang Z, Feng L, Gan L. Functional equivalence of Brn3 POU-domain transcription factors in mouse retinal neurogenesis. Development. 2005;132:703–712. doi: 10.1242/dev.01646. [DOI] [PubMed] [Google Scholar]
- Poché RA, Furuta Y, Chaboissier MC, Schedl A, Behringer RR. Sox9 is expressed in mouse multipotent retinal progenitor cells and functions in Müller glial cell development. JCN. 2008;510:237–250. doi: 10.1002/cne.21746. [DOI] [PMC free article] [PubMed] [Google Scholar]
- Rivlin-Etzion M, Zhou K, Wei W, Elstrott J, Nguyen PL, Barres BA, Huberman AD, Feller MB. Transgenic mice reveal unexpected diversity of on-off direction-selective retinal ganglion cell subtypes and brain structures involved in motion processing. J Neurosci. 2011;31:8760–8769. doi: 10.1523/JNEUROSCI.0564-11.2011. [DOI] [PMC free article] [PubMed] [Google Scholar]
- Rockhill RL, Daly FJ, MacNeil MA, Brown SP, Masland RH. The diversity of ganglion cells in a mammalian retina. J Neurosci. 2002;22:3831–3843. doi: 10.1523/JNEUROSCI.22-09-03831.2002. [DOI] [PMC free article] [PubMed] [Google Scholar]
- Rodieck RW. The density recovery profile: a method for the analysis of points in the plane applicable to retinal studies. Vis Neurosci. 1991;6:95–111. doi: 10.1017/s095252380001049x. [DOI] [PubMed] [Google Scholar]
- Roska B, Werblin F. Vertical interactions across ten parallel, stacked representations in the mammalian retina. Nature. 2001;410:583–587. doi: 10.1038/35069068. [DOI] [PubMed] [Google Scholar]
- Schubert T, Maxeiner S, Kruger O, Willecke K, Weiler R. Connexin45 mediates gap junctional coupling of bistratified ganglion cells in the mouse retina. J Comp Neurol. 2005;490:29–39. doi: 10.1002/cne.20621. [DOI] [PubMed] [Google Scholar]
- Sivyer B, Venkataramani S, Taylor WR, Vaney DI. A novel type of complex ganglion cell in rabbit retina. J Comp Neurol. 2011;519:3128–3138. doi: 10.1002/cne.22720. [DOI] [PMC free article] [PubMed] [Google Scholar]
- Sun W, Deng Q, Levick WR, He S. ON direction-selective ganglion cells in the mouse retina. J Physiol. 2006;576:197–202. doi: 10.1113/jphysiol.2006.115857. [DOI] [PMC free article] [PubMed] [Google Scholar]
- Sun W, Li N, He S. Large-scale morophological survey of rat retinal ganglion cells. Vis Neurosci. 2002a;19:483–493. doi: 10.1017/s0952523802194107. [DOI] [PubMed] [Google Scholar]
- Sun W, Li N, He S. Large-scale morphological survey of mouse retinal ganglion cells. J Comp Neurol. 2002b;451:115–126. doi: 10.1002/cne.10323. [DOI] [PubMed] [Google Scholar]
- Trenholm S, Johnson K, Li X, Smith RG, Awatramani GB. Parallel mechanisms encode direction in the retina. Neuron. 2011;71:683–694. doi: 10.1016/j.neuron.2011.06.020. [DOI] [PMC free article] [PubMed] [Google Scholar]
- Vaney DI, Sivyer B, Taylor WR. Direction selectivity in the retina: symmetry and asymmetry in structure and function. Nat Rev Neurosci. 2012;13:194–208. doi: 10.1038/nrn3165. [DOI] [PubMed] [Google Scholar]
- Volgyi B, Chheda S, Bloomfield SA. Tracer coupling patterns of the ganglion cell subtypes in the mouse retina. J Comp Neurol. 2009;512:664–687. doi: 10.1002/cne.21912. [DOI] [PMC free article] [PubMed] [Google Scholar]
- Wässle H. Parallel processing in the mammalian retina. Nat Rev Neurosci. 2004;5:747–757. doi: 10.1038/nrn1497. [DOI] [PubMed] [Google Scholar]
- Wässle H, Boycott BB, Illing RB. Morphology and mosaic of on- and off-beta cells in the cat retina and some functional considerations. Proc R Soc Lond B Biol Sci. 1981a;212:177–95. doi: 10.1098/rspb.1981.0033. [DOI] [PubMed] [Google Scholar]
- Wässle H, Peich L, Boycott BB. Morphology and topography of on- and off-alpha cells in the cat retina. Proc R Soc Lond B Biol Sci. 1981b;212:157–175. doi: 10.1098/rspb.1981.0032. [DOI] [PubMed] [Google Scholar]
- Wässle H, Peich L, Boycott BB. Dendritic territories of cat retinal ganglion cells. Nature. 1981c;292:344–345. doi: 10.1038/292344a0. [DOI] [PubMed] [Google Scholar]
- Xiang M, Zhou L, Macke JF, Yoshioka T, Hendry SH, Eddy RL, Shows TB, Nathans J. The Brn-3 family of POU-domain factors: primary structure, binding specificity, and expression in subsets of retinal ganglion cells and somatosensory neurons. J Neurosci. 1995;15:4762–4785. doi: 10.1523/JNEUROSCI.15-07-04762.1995. [DOI] [PMC free article] [PubMed] [Google Scholar]
- Xiang M, Zhou L, Peng YW, Eddy RL, Shows TB, Nathans J. Brn-3b: a POU domain gene expressed in a subset of retinal ganglion cells. Neuron. 1993;11:689–701. doi: 10.1016/0896-6273(93)90079-7. [DOI] [PubMed] [Google Scholar]
- Yonehara K, Ishikane H, Sakuta H, Shintani T, Nakamura-Yonehara K, Kamiji NL, Usui S, Noda M. Identification of retinal ganglion cells and their projections involved in central transmission of information about upward and downward image motion. PLoS ONE. 2009;4:e4320. doi: 10.1371/journal.pone.0004320. [DOI] [PMC free article] [PubMed] [Google Scholar]
- Yonehara K, Shintani T, Suzuki R, Sakuta H, Takeuchi Y, Nakamura-Yonehara K, Noda M. Expression of SPIG1 reveals development of a retinal ganglion cell subtype projecting to the medial terminal nucleus in the mouse. PLoS ONE. 2008;3:e1533. doi: 10.1371/journal.pone.0001533. [DOI] [PMC free article] [PubMed] [Google Scholar]