

Abstract
We develop a novel and general approach to estimating the accuracy of multiple sequence alignments without knowledge of a reference alignment, and use our approach to address a new task that we call parameter advising: the problem of choosing values for alignment scoring function parameters from a given set of choices to maximize the accuracy of a computed alignment.
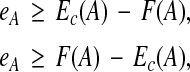
For protein alignments, we consider twelve independent features that contribute to a quality alignment. An accuracy estimator is learned that is a polynomial function of these features; its coefficients are determined by minimizing its error with respect to true accuracy using mathematical optimization. Compared to prior approaches for estimating accuracy, our new approach (a) introduces novel feature functions that measure nonlocal properties of an alignment yet are fast to evaluate, (b) considers more general classes of estimators beyond linear combinations of features, and (c) develops new regression formulations for learning an estimator from examples; in addition, for parameter advising, we (d) determine the optimal parameter set of a given cardinality, which specifies the best parameter values from which to choose.
Our estimator, which we call Facet (for “feature-based accuracy estimator”), yields a parameter advisor that on the hardest benchmarks provides more than a 27% improvement in accuracy over the best default parameter choice, and for parameter advising significantly outperforms the best prior approaches to assessing alignment quality.
Key words: sequence alignment, accuracy assessment, parameter choice, machine learning, feature functions
1. Introduction
Estimating the accuracy of a computed multiple sequence alignment (namely, how closely it agrees with the correct alignment of its sequences), without actually knowing the correct alignment, is an important problem. A good accuracy estimator has very broad utility: for example, from building a meta-aligner that selects the most accurate alignment output by a collection of aligners, to boosting the accuracy of a single aligner by choosing values for the parameters of its alignment scoring function to yield the best output from that aligner. The accuracy of a computed alignment is typically determined with respect to a reference alignment that represents the correct alignment of the sequences, by measuring the fraction of substitutions in the core columns1 of the reference alignment that are present in the computed alignment. We estimate the accuracy of a computed alignment without knowing a reference alignment by learning a function that combines several easily-evaluated features of the computed alignment into a single estimate of its accuracy value.
To explain the novel aspects of our approach to estimating accuracy, we first review related work.
1.1. Related work
Several approaches have been developed for assessing the quality of a computed alignment without knowing a reference alignment for its sequences. These approaches follow two general strategies for estimating the accuracy with which a computed alignment recovers the unknown correct alignment.2
The first general strategy, which we call scoring-function-based, is to develop a new scoring function on alignments that ideally is correlated with accuracy (Notredame et al. (1998), Thompson et al. (2001), Pei and Grishin (2001), and Ahola et al. (2008)). These scoring functions combine local attributes of an alignment into a score, and typically include a measure of the conservation of amino acids in alignment columns.
The second general strategy, which we call support-based, is to:
(a) examine a collection of alternate alignments of the same sequences, where the collection can be generated by changing the method used for computing the alignment, or by changing the input to a method; and then
(b) measure the support for the original computed alignment among the collection of alternate alignments.
(See Lassmann and Sonnhammer (2005), Landan and Graur (2007), Penn et al. (2010b), and Kim and Ma (2011).) In this strategy, the support for the computed alignment, which essentially measures the stability of the alignment to changes in the method or input, serves as a proxy for accuracy.
1.1.1. Scoring-function-based approaches
Approaches that assess alignment quality via a scoring function include COFFEE (Notredame, et al., 1998), AL2CO (Pei and Grishin, 2001), NorMD (Thompson et al., 2001), and PredSP (Ahola et al., 2008). We briefly describe each in turn.
COFFEE (Notredame et al., 1998) evaluates a multiple alignment by realigning its sequences pairwise; using the matches in all these pairwise alignments to determine transformed substitution scores for pairs of residues3 in the columns of the multiple alignment, where these position-dependent transformed scores are in the range [0, 1]; accumulating the weighted sum of scores of all induced pairwise alignments in the multiple alignment without penalizing gaps, where substitutions are evaluated using the above transformed scores; and finally normalizing by the weighted sum of the lengths of all induced pairwise alignments. COFFEE is a component of the T-Coffee alignment package (Notredame et al., 2000).
AL2CO (Pei and Grishin, 2001) uses conservation measures on alignment columns that are based on weighted frequencies of the amino acids in the column, and assesses an alignment by averaging this measure over all its columns.
NorMD (Thompson et al., 2001) develops an elaborate alignment scoring function that transforms standard amino acid substitution scores on pairs of aligned residues into a geometric substitution score defined on a 20-dimensional Euclidean space; takes a weighted average of all these substitution scores in a column; transforms this average substitution score through exponential decay; sums these transformed scores across columns; then includes affine gap penalties (Gotoh, 1982) and Wilbur-Lipman hash scores (Wilbur and Lipman, 1983) for normalization. NorMD is used in several systems, including RASCAL (Thompson et al., 2003), LEON (Thompson et al., 2004), and AQUA (Muller et al., 2010).
PredSP (Ahola et al., 2008) fits a beta distribution from statistics to the true accuracies associated with a sample of alignments, where the mean and variance of the distribution are transforms of a linear combination of four alignment features. The features they use are sequence percent identity, number of sequences, alignment length, and a conservation measure that is the fraction of residues in conserved columns as identified by a statistical model that takes into account amino acid background probabilities and substitution probabilities (Ahola et al., 2006). The accuracy that is predicted for the alignment is essentially the mean of the fitted beta distribution; a predicted confidence interval on the accuracy can also be quoted from the fitted distribution.
1.1.2. Support-based approaches
Approaches that assess alignment quality in terms of support from alternate alignments include MOS (Lassmann and Sonnhammer, 2005), HoT (Landan and Graur, 2007), GUIDANCE (Penn et al., 2010a), and PSAR (Kim and Ma, 2011). We briefly summarize each below.
MOS (Lassmann and Sonnhammer, 2005) takes a computed alignment together with a collection of alternate alignments of the same sequences, and over all residue pairs aligned by the computed alignment, measures the average fraction of alternate alignments that also align the residue pair. In other words, MOS measures the average support for the substitutions in the computed alignment by other alignments in the collection.
HoT (Landan and Graur, 2007) considers a single alternate alignment, obtained by running the aligner that generated the computed alignment on the reverse of the sequences and reversing the resulting alignment, and reports the MOS value of the original alignment with respect to this alternate alignment.
GUIDANCE (Penn et al., 2010b) assumes the computed alignment was generated by a so-called progressive aligner that uses a guide tree, and obtains alternate alignments by perturbing the guide tree and reinvoking the aligner. GUIDANCE reports the MOS value of the original alignment with respect to these alternate alignments.
PSAR (Kim and Ma, 2011) generates alternate alignments by probabilistically sampling pairwise alignments of each input sequence versus the hidden Markov model obtained by collapsing the original multiple alignment without the input sequence. PSAR reports the MOS value of the original alignment with respect to these alternates.
Note that in contrast to other approaches, HoT and GUIDANCE require access to the aligner that computed the alignment. They essentially measure the stability of the aligner to sequence reversal or guide tree alteration.
Note also that scoring-function-based approaches can estimate the accuracy of a single alignment, while support-based approaches inherently require a set of alignments.
1.2. Our contributions
The new approach we develop for accuracy estimation significantly improves on prior approaches, as we demonstrate through its performance on parameter advising: the task of choosing parameter values for an aligner (such as gap penalties and substitution scoring matrices) to obtain the most accurate computed alignment of the specific input sequences.
While our approach is within the general scoring-function-based category, compared to prior such approaches, we:
(a) introduce several novel feature functions that measure nonlocal properties of an alignment and have stronger correlation with accuracy (such as Secondary Structure Blockiness, described in Section 4),
(b) consider larger classes of estimators beyond linear combinations of features (such as quadratic polynomials, described in Section 2), and
(c) develop new regression formulations for learning an estimator from examples (such as difference fitting, described in Section 3).
Our approach can readily incorporate new feature functions into the estimator, and is easily tailored to a particular class of alignments by choosing appropriate features and performing regression.
In addition, for the task of parameter advising, we:
(d) determine the optimal parameter set of a given cardinality, which specifies the parameter values from which an advisor chooses (found by integer linear programming, as described in Section 5).
Compared to support-based approaches, our estimator does not degrade on difficult alignment instances, where for parameter advising, good accuracy estimation can have the greatest impact. As shown in our advising experiments, support-based approaches lose the ability to detect accurate alignments of hard-to-align sequences, since for such sequences most alternate alignments are poor and lend little support to the alignment that is actually most accurate.
In the experiments we present later, among scoring-function-based approaches we compare just to COFFEE, NorMD, and PredSP, since AL2CO is known to be dominated by NorMD (see Lassmann and Sonnhammer, 2005). Among support-based approaches, we compare just to MOS and HoT, as GUIDANCE requires alignments of at least four sequences (ruling out the many three-sequence protein reference alignments in suites such as BENCH (Edgar, 2009)), while PSAR is not yet implemented for protein alignments.
The experiments on parameter advising in Section 6 show our new estimator, which we call Facet (short for “feature-based accuracy estimator”), significantly outperforms COFFEE, NorMD, PredSP, MOS, and HoT in terms of the average true accuracy of the alignments output by an aligner using the resulting advisor on an optimal parameter set. Furthermore, parameter advising using Facet is highly effective: on the hardest benchmark sequences, the Facet advisor using an optimal set of 10 parameter choices provides more than a 27% improvement in the true accuracy of the computed alignment, compared to using the single best default parameter choice.
1.3. Overview
The structure of the paper is as follows. The next section presents the general form of accuracy estimators we consider, which are polynomials in the feature functions. Section 3 explains how we learn an estimator from examples with known reference alignments by linear and quadratic programming. Section 4 describes the set of feature functions we consider for our estimators, including a new, nonlocal, secondary-structure-based feature that we call Blockiness. Section 5 defines the parameter advising task to which we apply accuracy estimation, and explains how we find an optimal set of parameters for advising via integer linear programming. Section 6 then presents experimental results on benchmark alignments that compare the performance of our approach to other estimators for parameter advising. Section 7 concludes, and offers directions for further research.
2. Accuracy Estimators
Without knowing a reference alignment that establishes the ground truth against which the true accuracy of an alignment is measured, we are left with only being able to estimate the accuracy of an alignment. Our approach to obtaining an estimator for alignment accuracy is to (a) identify multiple features of an alignment that tend to be correlated with accuracy, and (b) combine these features into a single accuracy estimate. Each feature, as well as the final accuracy estimator, is a real-valued function of an alignment.
The simplest estimator is a linear combination of feature functions, where features are weighted by coefficients. These coefficients can be learned by training the estimator on example alignments whose true accuracy is known. This training process will result in a fixed coefficient or weight for each feature. Alignment accuracy is usually represented by a value in the range [0,1], with 1 corresponding to perfect accuracy. Consequently, the value of the estimator on an alignment should be bounded, no matter how long the alignment or how many sequences it aligns. For boundedness to hold when using fixed feature weights, the feature functions themselves must also be bounded. Hence, we assume that the feature functions also have the range [0,1]. We can then guarantee that the estimator has range [0,1] by ensuring that the coefficients found by the training process yield a convex combination of features.
In general, we consider estimators that are polynomial functions of alignment features. More precisely, suppose the features that we consider for alignments A are measured by the k feature functions fi(A) for 1≤i≤k. Then our accuracy estimator E(A) is a polynomial in the k variables fi(A). For a polynomial of degree d, our accuracy estimator E(A) has the general form,
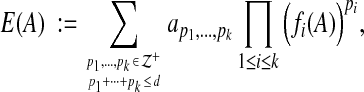 |
where  denotes the nonnegative integers, and the coefficients on the terms of the polynomial are given by the
  . In this summation, there are k index variables pi, and each possible assignment of nonnegative integers to the pi that satisfies
  specifies one term of the summation, and hence the powers for one term of the polynomial.
Learning an estimator from example alignments, as discussed in Section 3, corresponds to determining the coefficients for its terms. We can efficiently learn optimal values for the coefficients that minimize the error between the estimate E(A) and the actual accuracy of alignment A on a set of training examples, even for estimators that are polynomials of arbitrary degree d. This can be done for arbitrarily-large degree essentially because such an estimator can always be reduced to the linear case by a change of feature functions, as follows. For each term in the degree-d estimator, where the term is specified by the powers pi of the fi, define a new feature function
 |
that has an associated coefficient  . Then in terms of the new feature functions gj, the original degree-d estimator is equivalent to the linear estimator
 |
where t is the number of terms in the original polynomial. For a degree-d estimator with k original feature functions, the number of coefficients t in the linearized estimator is at least  , the number of integer partitions of d with k parts. This number of coefficients grows very fast with d, so overfitting can become an issue when learning a high-degree estimator. (Even a cubic estimator on 10 features already has 286 coefficients.) In our experiments, we focus on linear and quadratic estimators.
The coefficients of the estimator polynomial are found by mathematical optimization, as we describe next.
3. Learning the Estimator from Examples
To learn an accuracy estimator, we collect a training set of alignments whose true accuracy is known, and find coefficients for the estimator that give the best fit to true accuracy. We form the training set for our experiments by:
(1) collecting reference alignments from standard suites of benchmark protein multiple alignments;
(2) for each such reference alignment, generating alternate alignments of its sequences by calling a multiple sequence aligner with differing values for the parameters of its alignment scoring function, in particular by varying its substitution scoring matrix and gap penalties, which can yield markedly different alignments; and
(3) labeling each such alternate alignment by its accuracy with respect to the reference alignment for its sequences.
We use suites of benchmarks for which the reference alignments are obtained by structural alignment of the proteins using their known three-dimensional structures. The alternate alignments together with their labeled accuracies form the examples in our training set.
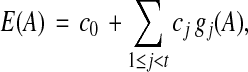
3.1. Fitting to accuracy values
A natural criterion for fitting the estimator on the example alignments is to minimize the error between the estimator and the true accuracy value. For alignment A in our training set  , let Ec(A) be its estimated accuracy where vector
  specifies the values for the coefficients of the estimator polynomial, and let F(A) be the true accuracy of example A.
Formally, minimizing the weighted error between estimated accuracy and true accuracy yields estimator  with coefficient vector
 |
where power p controls the degree to which large accuracy errors are penalized. Weights wA correct for sampling bias among the examples, as explained below.
When p = 2, this corresponds to minimizing the L2 norm between the estimator and the true accuracies. The absolute value in the objective function may be removed, and the formulation becomes a quadratic programming problem in variables c, which can be efficiently solved. (Note that Ec is linear in c.) If the feature functions all have range [0,1], we can ensure that the resulting estimator E* also has range [0,1] by adding to the quadratic program the linear inequalities,
 |
When p = 1, the formulation corresponds to minimizing the L1 norm. This is less sensitive to outliers than the L2 norm, which can be advantageous when the underlying features are noisy. Minimizing the L1 norm can be reduced to a linear programming problem as follows. In addition to variables c, we have a second vector of variables e with an entry eA for each example  to capture the absolute value in the L1 norm, along with the inequalities,
 |
which are linear in variables c and e. We then minimize the linear objective function
 |
For n examples, the linear program has n + t variables and O(n) inequalities, which is solvable even for very large numbers of examples. We can also add inequalities as before that ensure E* has range [0,1].
The weights wA on examples aid in finding an estimator that is good across all accuracies. In the suites of protein alignment benchmarks that are commonly available, a predominance of the benchmarks consist of sequences that are easily alignable, meaning that standard aligners find high-accuracy alignments for these benchmarks.4 (See Section 6 for statistics on this overrepresentation of easy benchmarks.) In this situation, when training set  is generated as described earlier, most examples have high accuracy, with relatively few at moderate to low accuracies. Without weights on examples, the resulting estimator E* is strongly biased toward optimizing the fit for high accuracy alignments, at the expense of a poor fit at lower accuracies. To prevent this, we bin the examples in
  by their true accuracy, where
  is the set of alignments falling in the bin for example A, and then weight the error term for A by
  . (In our experiments, we form 10 bins equally spaced at 10% increments in accuracy.) In the objective function, this weights bins uniformly (rather than weighting examples uniformly) and weights the error equally across the full range of accuracies.
3.2. Fitting to accuracy differences
Many applications of an accuracy estimator E will use it to choose from a set of alignments the one that is estimated to be most accurate. (This occurs, for instance, in parameter advising as discussed in Section 5.) In such applications, the estimator is effectively ranking alignments, and all that is needed is for the estimator to be monotonic in true accuracy. Accordingly, rather than trying to fit the estimator to match accuracy values, we can instead fit it so that differences in accuracy are reflected by at least as large differences in the estimator. This fitting to differences is less constraining than fitting to values, and hence might be better achieved.
More precisely, suppose we have selected a set  of ordered pairs of example alignments, where every pair
  satsifies F(A) < F(B). Set
  holds pairs of examples on which accuracy F increases for which we desire similar behavior from our estimator E. (Later we discuss how we select a small set
  of important pairs.) If estimator E increases at least as much as accuracy F on a pair in
  , this is a success, and if it increases less than F, we consider the amount it falls short an error, which we try to minimize. Notice this tries to match large accuracy increases, and penalizes less for not matching small increases.
We formulate fitting to differences as finding the optimal estimator  given by coefficients
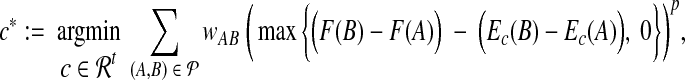 |
where wAB weights the error term for a pair. When power p is 1 or 2, we can reduce this optimization problem to a linear or quadratic program as follows. We introduce a vector of variables e with an entry eAB for each pair  , along with the inequalities,
 |
which are linear in variables c and e. We then minimize the objective function,
 |
which is linear or quadratic in the variables for p = 1 or 2.
For a set  of m pairs, these programs have m + t variables and m inequalities, where m = O(n2) in terms of the number of examples n. For the programs to be manageable for large n, set
  must be quite sparse.
We select a sparse set  of important pairs as follows. Recall that the training set
  of examples consists of alternate alignments of the sequences in benchmark reference alignments, where the alternates are generated by aligning the benchmark under a constant number of different parameter choices. An estimator that is designed for parameter advising should rank the highest accuracy alternate alignment for a benchmark above the other alternates for that benchmark. Consequently, for each benchmark, we select for
  its highest accuracy alternate paired with its other alternates for which the difference in accuracy is at least ε, where ε is a tunable threshold. (Notice this picks O(n) pairs on the n examples.) For the estimator to generalize outside the training set, it helps to also properly rank alignments between benchmarks. To include some pairs between benchmarks, we choose the minimum, maximum, and median accuracy alignments for each benchmark, and form one list L of all these chosen alignments, ordered by increasing accuracy. Then for each alignment A in L, we scan L to the right to select the first k pairs (A, B) for which F(B) ≥ F(A) + iδ where
  , and for which B is from a different benchmark than A. While the constants ε ≥ 0, δ ≥ 0, and k ≥ 1 control the specific pairs that this procedure selects for
  , it always selects O(n) pairs on the n examples.
3.3. Weighting pairs for difference fitting
When fitting to accuracy differences we again weight the error terms, which are now associated with pairs, to correct for sampling bias within  . We want the weighted pairs to treat the entire accuracy range equally, so the fitted estimator performs well at all accuracies. As when fitting to accuracy values, we partition the example alignments in
  into bins
  according to their true accuracy. To model equal weighting of accuracy bins by pairs, we consider a pair
  to have half its weight wAB on the bin containing A and half on the bin containing B. (So in this model, a pair (A, B) with both ends A, B in the same bin
  , places all its weight wAB on
  .) Then we want to find weights wAB > 0 that, for all bins
  , satisfy
 |
In other words, the pairs should weight bins uniformly.
We say a collection of weights wAB are balanced if they satisfy the above property on all bins  . While balanced weights do not always exist in general, we can identify an easily-satisfied condition that guarantees they do exist, and in this case, find balanced weights by the following graph algorithm.
Construct an undirected graph G whose vertices are the bins  and whose edges (i, j) go between bins
  that have an alignment pair (A, B) in
  with
with  and
and  . (Notice G has self-loops when pairs have both alignments in the same bin.) Our algorithm first computes weights ωij on the edges (i, j) in G, and then assigns weights to pairs (A, B) in
  by setting wAB := 2ωij / cij, where bins
  contain alignments A, B, and cij counts the number of pairs in
  between bins
  and
and  . (The factor of 2 is due to a pair only contributing weight
  to a bin.) A consequence is that all pairs (A, B) that go between the same bins get the same weight wAB.
During the algorithm, an edge (i, j) in G is said to be labeled if its weight ωij has been determined; otherwise, it is unlabeled. We call the degree of a vertex i the total number of endpoints of edges in G that touch i, where a self-loop contributes two endpoints to the degree. Initially all edges of G are unlabeled. The algorithm sorts the vertices of G in order of nonincreasing degree, and then processes the vertices from highest degree on down.
In the general step, the algorithm processes vertex i as follows. It accumulates w, the sum of the weights ωij of all labeled edges that touch i; counts u, the number of unlabeled edges touching i that are not a self-loop; and determines d, the degree of i. To the unlabeled edges (i, j) touching i, the algorithm assigns weight ωij := 1/d if the edge is not a self-loop, and weight  otherwise.
This algorithm assigns balanced weights if in graph G, every bin has a self-loop, as stated in the following theorem.
Theorem 1 (Finding Balanced Weights)
Suppose every bin
 has some pair (A, B) in
 with both alignments A, B in
 . Then the above graph algorithm finds balanced weights.
Proof
We will show that: (a) for every edge (i, j) in G, its assigned weight satisfies ωij > 0; and (b) for every vertex i, the weights assigned to its incident edges (i, j) satisfy
 |
From these properties (a) and (b), it follows that the resulting weights wAB are balanced.
The key observation is that when processing a vertex i of degree d, the edges touching i that are already labeled will have been assigned a weight ωij ≤ 1/d, since the other endpoint j must have degree at least d (as vertices are processed from highest degree on down). Unlabeled edges touching i, other than a self-loop, get assigned weight ωij = 1/d > 0. When assigning weight ωii for the unlabeled self-loop, the total weight w of incident labeled-edges satisfies w ≤ (d−u−2)/d, by the key observation above and the fact that vertex i always has a self-loop that contributes 2 to its degree. This inequality in turn implies ωii ≥ 1/d > 0. Thus property (a) holds.
Furthermore, twice the weight ωii assigned to the self-loop takes up the slack between 1 and the weights of all other incident edges, so property (b) holds as well.
Regarding the condition in Theorem 1, if there are bins without self-loops, balanced weights do not necessarily exist. The smallest such instance is when G is a path of length 2.
Notice that we can ensure the condition in Theorem 1 holds if every bin has at least two example alignments: simply add a pair (A, B) to  where both alignments are in the bin, if the procedure for selecting a sparse
  did not already. When the training set
  of example alignments is sufficiently large compared to the number of bins (which is within our control), every bin is likely to have at least two examples. So Theorem 1 essentially guarantees that in practice we can fit our estimator using balanced weights.
For k bins and m pairs, the pair-weighting algorithm can be implemented to run in O(k + m) time, using radix sort to map pairs in  to edges in G, and counting sort to order the vertices of G by degree.
4. Estimator Features
The quality of the estimator that results from our approach ultimately rests on the quality of the features that we consider. We consider twelve features of an alignment, the majority of which are novel. All are efficiently computable, so the resulting estimator is fast to evaluate. The strongest feature functions make use of predicted secondary structure (which is not surprising, given that protein sequence alignments are often surrogates for structural alignments).
Another aspect of some of the best alignment features is that they tend to use nonlocal information. This is in contrast to standard ways of scoring sequence alignments, such as with amino acid substitution scores or gap open and extension penalties, which are often a function of a single alignment column or two adjacent columns (as is necessary for efficient dynamic programming algorithms). While a good accuracy estimator would make an ideal scoring function for constructing a sequence alignment, computing an optimal alignment under such a nonlocal scoring function seems prohibitive (especially since multiple alignment is already NP-complete for the current highly-local scoring functions). Nevertheless, given that our estimator can be efficiently evaluated on any constructed alignment, it is well suited for selecting a sequence alignment from among several alternate alignments, as we discuss in Section 5 in the context of parameter advising.
Key properties of a good feature function are: (a) it should measure some attribute that discriminates high-accuracy alignments from others, (b) it should be efficiently computable, and (c) its value should be bounded (as discussed at the beginning of Section 2). Bounded functions are easily normalized, and we scale all our feature functions to the range [0,1]. We also intend our features to be increasing functions of, or positively correlated with, alignment accuracy.
The following are the alignment feature functions we consider for our accuracy estimator. We highlight the first function as it is the most novel, one of the strongest, and is the most challenging to compute.
4.1. Secondary Structure Blockiness
The reference alignments in the most reliable suites of protein alignment benchmarks are computed by structural alignment of the known three-dimensional structures of the proteins. The so-called core blocks of these reference alignments, which are the columns in the reference to which an alternate alignment is compared when measuring its true accuracy, are typically defined as the regions of the structural alignment in which the residues of the different proteins are all within a small distance threshold of each other in the superimposed structures. These regions of structural agreement are usually in the embedded core of the folded proteins, and the secondary structure of the core usually consists of α-helices and β-strands. (There are three basic types of secondary structure that a residue can have: α-helix, β-strand, and coil, which stands for “other.”) As a consequence, in the reference sequence alignment, the sequences in a core block often share the same secondary structure, and the type of this structure is usually α-helix or β-strand.
We measure the degree to which a multiple alignment displays this pattern of structure by a feature we call Secondary Structure Blockiness. Suppose that for the protein sequences in a multiple alignment we have predicted the secondary structure of each protein, using a standard prediction tool such as PSIPRED (Jones 1999). Then in multiple sequence alignment A and for given integers k, ℓ > 1, define a secondary structure block
 to be:
(i) a contiguous interval of at least ℓ columns of A, together with
(ii) a subset of at least k sequences in A, such that on all columns in this interval, in all sequences in this subset, all the entries in these columns for these sequences have the same predicted secondary structure type, and this shared type is all α-helix or all β-strand.
We call  an α-block or a β-block according to the common type of its entries. Parameter ℓ, which controls the minimum width of a block, relates to the minimum length of α-helices and β-strands; we can extend the definition to use different values ℓα and ℓβ for α- and β-blocks.
A packing for alignment A is a set  of secondary structure blocks of A, such that the column intervals of the
  are all disjoint. (In other words, in a packing, each column of A is in at most one block. The sequence subsets for the blocks can differ arbitrarily.) The value of a block is the total number of residue pairs (or equivalently, substitutions) in its columns; the value of a packing is the sum of the values of its blocks.
Finally, the blockiness of an alignment A is the maximum value of any packing for A, divided by the total number of residue pairs in the columns of A. In other words, Secondary Structure Blockiness measures the fraction of substitutions in A that are in an optimal packing of α- or β-blocks.
At first glance, measuring blockiness might seem hard (since optimal packing problems are often computationally intractable), yet surprisingly it can actually be computed in linear time in the size of the alignment, as the following theorem states. The main idea is that evaluating blockiness can be reduced to solving a longest path problem on a directed acyclic graph of linear size.
Theorem 2 (Evaluating Blockiness)
Given a multiple alignment A of m protein sequences and n columns, where the sequences are annotated with predicted secondary structure, the Blockiness of A can be computed in O(mn) time.
Proof
The key is to not enumerate subsets of sequences in A when considering blocks for packings, and instead enumerate intervals of columns of A. Given a candidate column interval I for a block  , we can avoid considering all possible subsets of sequences, since there are only two possibilities for the secondary structure type s of
  , and the sequences in
  must have type s across I. To maximize the value of
  , we can collect all sequences in A that have type α across I (if any), all sequences that have type β across I, and keep whichever subset has more sequences.
Following this idea, given alignment A, we form an edge-weighted, directed graph G that has a vertex for every column of A plus an artificial sink vertex, and an edge of weight 0 from each column to its immediate successor plus an edge of weight 0 from the last column of A to the sink. We call the vertex for the first column of A the source vertex. We could then consider all intervals I of at least ℓ columns, test whether the best sequence subset for each I as described above has at least k sequences, and if so, add an edge to G from the first column of I to the immediate successor of the last column of I, weighted by the maximum value of a block with interval I. A longest path in the resulting graph G from its source to its sink then gives an optimal packing for A, and the blockiness of A is the length of this longest path divided by the total number of substitutions in A. This graph G would have Θ(n2) edges, however, and would not lead to an O(mn) time algorithm for blockiness. Instead, we only add edges to G for such intervals I whose number of columns, or width, is in the range [ℓ, 2ℓ−1]. Any block  whose interval has width at least ℓ is the concatenation of disjoint blocks whose intervals have widths in the above range. Furthermore, the value of such a block
  is the sum of the values of the blocks in the concatenation. Only adding to G edges in the above width range gives a sparse graph with O(n) vertices and just O(ℓn) edges, which is O(n) edges for constant ℓ.
To implement this algorithm, first construct G in O(mn) time by (1) enumerating the O(n) edges of G in lexicographic order on the pair of column indices defining the column interval for the edge, and then (2) determining the weight of each successive edge e in this order in O(m) time by appending a single column of A to form the column interval for e from the shorter interval of its predecessor. Graph G is acyclic, and a longest source-sink path in a directed acyclic graph can be computed in time linear in its number of vertices and edges (Cormen et al., 2009), so the optimal packing in A of blocks can be obtained from G in O(n) time. This takes O(mn) time in total.
4.2. Other features
The remaining feature functions we consider are simpler to compute than Secondary Structure Blockiness.
4.2.1. Secondary Structure Agreement
The secondary structure prediction tool PSIPRED (Jones, 1999) outputs confidence values at each residue that are intended to reflect the probability that the residue has each of the three secondary structure types. Denote these three confidences for a residue i, normalized so they add up to 1, by pα(i), pβ(i), and pγ(i). Then we can estimate the probability that two residues i, j in a column have the same secondary structure type that is not coil by
 |
To measure how strongly the secondary structure locally agrees around two residue positions, we compute a weighted average of P in a window of width 2ℓ + 1 centered at the positions,
 |
where the weights wk form a discrete distribution that peaks at k = 0 (centered on i and j) and is symmetric. The value of the Secondary Structure Agreement feature is then the average of Q(i, j) over all residue pairs i, j in all columns.
4.2.2. Gap Coil Density
A gap in a pairwise alignment is a maximal run of either insertions or deletions. For every pair of sequences, we measure the fraction of residues involved in gaps in the pairwise alignment induced by the sequence pair that are predicted by PSIPRED to be of secondary structure type coil. The Gap Coil Density feature then averages this measure over all induced pairwise alignments.
4.2.3. Gap Extension Density
This feature counts the number of null characters in the alignment (the dashes that denote gaps), normalized by the total number of alignment entries. This is related to affine gap penalties (Gotoh 1982), which are commonly used to score alignments.
4.2.4. Gap Open Density
This counts the number of runs of null characters in the rows of the alignment, normalized by the total length of all such runs (which also relates to affine gap penalties).
4.2.5. Gap Compatibility
As in cladistics, we encode the gapping pattern in the columns of an alignment as a binary state: residue (1) or null character (0). For an alignment in this encoding, we then collapse together adjacent columns that have the same gapping pattern. We evaluate this reduced set of columns for compatibility by checking whether a perfect phylogeny exists on them, using the so-called “four gametes test” on pairs of columns. More specifically, a pair of columns passes the four gametes test if at most three of the four possible patterns 00, 01, 10, 11 occur in the rows of these two columns. A so-called perfect phylogeny exists, in which the binary gapping pattern in each column is explained by a single insertion or deletion event on an edge of the tree, if and only if all pairs of columns pass this test (see Gusfield (1997), pages 462–463; or Estabrook et al. (1975)). The Gap Compatibility feature measures the fraction of pairs of columns in the reduced binary data that pass this test, which is a rough measure of how tree-like the gapping pattern is in the alignment.
4.2.6. Substitution Compatibility
Similar to Gap Compatibility, we encode the substitution pattern in the columns of an alignment by a binary state: using a reduced amino acid alphabet of equivalency classes, residues in the most prevalent equivalency class in the column are mapped to 1 and all others to 0. The feature measures the fraction of encoded column pairs that pass the four-gametes test, which again is a rough measure of how tree-like the substitution pattern is in the alignment. We considered the standard reduced alphabets with 6, 10, 15, and 20 equivalency classes, and used the 15-class alphabet, which gave the strongest correlation with accuracy.
4.2.7. Amino Acid Identity
This feature is usually called simply “percent identity.” In each induced pairwise alignment, we measure the fraction of substitutions in which the residues have the same amino acid equivalency class, where we use the reduced alphabet with 10 classes. The feature averages this over all induced pairwise alignments.
4.2.8. Secondary Structure Identity
This feature is like Amino Acid Identity, except instead of the protein's amino acid sequence, we use the secondary structure sequence predicted for the protein by PSIPRED (Jones, 1999), which is a string over the three-letter secondary structure alphabet.
4.2.9. Average Substitution Score
This computes the average score of all substitutions in the alignment using a BLSM62 substitution-scoring matrix (Henikoff and Henikoff, 1992) that has been shifted and scaled so the amino acid similarity scores are in the range [0,1].
4.2.10. Core Column Density
For this feature, we first predict core columns as those that only contain residues (and not gap characters) and whose fraction of residues that have the same amino acid equivalency class, for the 10-class alphabet, is above a threshold. The feature then normalizes the count of predicted core columns by the total number of columns in the alignment.
4.2.11. Information Content
This feature measures the average entropy of the alignment (Hertz and Stormo, 1999), by averaging over all columns, the sum of the logarithm of the ratio of the abundance of an amino acid in the column divided by the background probability of that amino acid.
This comprises the set of features we consider for constructing an accuracy estimator. Later we perform feature selection to find the subset of features that yields the best estimator, as discussed in Section 6.
5. Application to Parameter Advising
In characterizing six stages in constructing a multiple sequence alignment, Wheeler and Kececioglu (2007) gave as the first stage choosing the parameter values for the alignment scoring function. While many alignment tools allow the user to specify scoring function parameter values, such as affine gap penalties or substitution scoring matrices, typically only the default parameter values that the aligner provides are used. This default parameter choice is often tuned to optimize the average accuracy of the aligner over a collection of alignment benchmarks. While the default parameter values might be the single choice that works best on average on the benchmarks, for specific input sequences there may be a different choice for which the aligner outputs a much more accurate alignment.
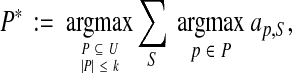
This leads to the task of parameter advising: given particular sequences to align, and a set of possible parameter choices, recommend a parameter choice to the aligner that yields the most accurate alignment of those sequences. Parameter advising has three components: the set S of input sequences, the set P of parameter choices, and the aligner  . (Here a parameter choice
 is a vector
  that specifies values for all free parameters in the alignment scoring function.) Given sequences S and parameter choice
  , we denote the alignment output by the aligner as
  .
.
Wheeler and Kececioglu (2007) call a procedure that takes the set of input sequences S and the set of parameter choices P and outputs a parameter recommendation  , an advisor. A perfect advisor, that always recommends the choice
  that yields the highest accuracy alignment
  , is called an oracle. In practice, constructing an oracle is impossible, since for any real set S of sequences that we want to align, a reference alignment for S is unknown (as otherwise we would not need to align them), so the true accuracy of any alignment of S cannot be determined. The concept of an oracle is useful, however, for measuring how well an actual advisor performs.
A natural approach for constructing a parameter advisor is to use an accuracy estimator E as a proxy for true accuracy, and recommend the parameter choice
 |
In its simplest realization, such an advisor will run the aligner  repeatedly on input S, once for each possible parameter choice
  , to select the output that has best estimated accuracy. Of course, to yield a quality advisor, this requires two ingredients: a good estimator E, and a good set P of parameter choices. The preceding sections have addressed how to design estimator E; we now turn to how to find a good set P.
5.1. Finding an optimal parameter set
Since the above advisor computes as many alignments as there are parameter choices in P, set P must be small for such an advisor to be practical. Given a bound on |P|, we would like to find a set P that, say, maximizes the true accuracy of the aligner  using the advisor's recommendation from P, averaged over a training collection of benchmarks S. Finding such an optimal set P is difficult, however, because the accuracy of the advisor is a rather indirect function (through the estimator E) of the entire set P, and enumerating all possible sets P in order to find an optimal one is prohibitive.
Instead, we find a set P that maximizes the true accuracy of aligner  using an oracle on P. The true accuracy of aligner
  on a given input S, using an oracle on set P, is simply
 |
where again F(A) is the true accuracy of alignment A. We can then find a set P* that maximizes the average of the above quantity over all inputs S in a collection of benchmarks. We use this criterion, which seeks to maximize the performance of an oracle on the parameter set, for our definition of an optimal parameter set P.
We formulate this model as follows. Let U be the universe of parameter choices from which we want to find a parameter set P ⊆ U. For a parameter choice  and sequences S, denote the true accuracy of the aligner using p on S as
 |
Given a bound k on the size of P, we want to find the optimal set
 |
where the summation is over all benchmarks S in a training set. (This is equivalent to maximizing the average true accuracy of the aligner over the training set using the oracle on P.) We call the above optimization problem of finding P*, Optimal Parameter Set.
As might be expected, Optimal Parameter Set is NP-complete: it is equivalent to a classic problem from the field of operations research called Facility Location (Drezner and Hamacher, 2004), which is known to be NP-complete (Garey and Johnson, 1979, ND51). Both problems can be tackled, however, by expressing them as an integer linear program.
The integer variables of the program, which all have value 0 or 1, are
• yp for all
 , where variable yp = 1 iff parameter p is selected for set P, and
• xp,S for all
 and all benchmarks S, where variable xp,S = 1 iff parameter p is used by the aligner on benchmark S in maximizing its average accuracy.
The linear constraints are
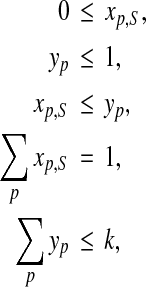 |
where the fourth constraint above applies to every benchmark S. The linear objective function is to maximize
 |
where the ap,S are serving as coefficients in the objective function. An optimal solution to this integer linear program gives an optimal parameter set  .
.
For a universe U of t parameter choices and a training set of n benchmarks, this has Θ(t n) variables and Θ(t n) constraints. While for a large universe and a large training set the resulting integer program can get quite big, in our experiments we were able to solve all instances to optimality using the CPLEX integer linear programming solver.
In the next section, we study our estimator through experiments that empirically evaluate how it performs at parameter advising.
6. Experimental Results
We evaluate our approach for deriving an accuracy estimator, and the quality of the resulting parameter advisor, through experiments on a collection of benchmark protein multiple sequence alignments. In these experiments, we compare parameter advisors that use our estimator and five other estimators from the literature: COFFEE (Notredame et al., 1998), NorMD (Thompson et al., 2001), MOS (Lassmann and Sonnhammer, 2005), HoT (Landan and Graur, 2007), and PredSP (Ahola et al., 2008). (In terms of our earlier categorization of estimators, COFFEE, NorMD, and PredSP are scoring-function-based, while MOS and HoT are support-based.) Other estimators from the literature that are not in this comparison group are: AL2CO (Pei and Grishin, 2001), which is known to be dominated by NorMD (see Lassmann and Sonnhammer (2005)); GUIDANCE (Penn et al., 2010b), which requires at least four sequences and hence is not applicable to a large portion of the most challenging benchmarks in our study, as many hardest-to-align instances involve three very distant sequences; and PSAR (Kim and Ma, 2011), which at present is only implemented for DNA sequence alignments.
We refer to our estimator in the figures that follow by the acronym Facet (“feature-based accuracy estimator”).
In our experiments, for the collection of alignment benchmarks, we used the BENCH suite from Edgar (2009), which consists of 759 benchmarks, supplemented by a selection of 102 benchmarks from the PALI suite of Balaji et al. (2001) version 2.3 (Gowri et al., 2005). (BENCH itself is a selection of benchmarks from BAliBASE (Bahr et al., 2001), OXBench (Russell and Barton, 1992), and SABRE (Van Walle et al., 2005).) Both BENCH and PALI consist of protein multiple sequence alignments mainly induced by structural alignment of the known three-dimensional structures of the proteins. The entire benchmark collection consists of 861 reference alignments.
For the experiments, we measure the difficulty of a benchmark S by the true accuracy of the alignment computed by the multiple alignment tool Opal (Wheeler and Kececioglu, 2007, 2012) on sequences S using its default parameter choice, where the computed alignment is compared to the benchmark's reference alignment on its core columns. Using this measure, we binned the 861 benchmarks by difficulty, where we divided up the full range [0,1] of accuracies into 10 bins with difficulties [(i−1)/10, i/10] for  . As is common in benchmark suites, easy benchmarks are highly overrepresented compared to hard benchmarks. The number of benchmarks falling in bins [0.0, 0.1] through [0.9, 1.0] are listed below.
| bin | 0.1 | 0.2 | 0.3 | 0.4 | 0.5 | 0.6 | 0.7 | 0.8 | 0.9 | 1.0 |
| benchmarks | 13 | 9 | 24 | 40 | 30 | 44 | 66 | 72 | 129 | 434 |
To correct for this bias in oversampling of easy benchmarks, our approaches for learning an estimator nonuniformly weight the training examples, as described earlier.
For each reference alignment in our benchmark collection, we generated alternate multiple alignments of the sequences in the reference using Opal with varying parameter choices. Opal constructs multiple sequence alignments using as a building block the exact algorithm of Kececioglu and Starrett (2004) for optimally aligning two multiple alignments under the sum-of-pairs scoring function (Carrillo and Lipman, 1988) with affine gap penalties (Gotoh, 1982). Since Opal computes subalignments that are optimal with respect to a well-defined scoring function, it is an ideal testbed for evaluating parameter choices, and in particular, parameter advising. Each parameter choice for Opal is a five-tuple (σ, γI, γE, λI, λE) of parameter values, where σ specifies the amino acid substitution scoring matrix, pair γE, λE specifies the gap-open and gap-extension penalties for external gaps in the alignment (also called terminal gaps), and γI, λI specifies these gap penalties for internal gaps (or nonterminal gaps).
The universe U of parameter choices we consider in our experiments consists of over 2,000 such tuples (σ, γI, γE, λI, λE). Universe U was generated as follows. For the substitution matrix σ, we considered matrices from the BLOSUM (Henikoff and Henikoff, 1992) and VTML (Müller et al., 2002) families. To accommodate a range of protein sequence divergences, we considered the following matrices from these families: {BLSM45, BLSM62, BLSM80} and {VTML20, VTML40, VTML80, VTML120, VTML200}. For each of these eight matrices, we took the real-valued version of the similarity matrix and transformed it into a substitution cost matrix for Opal by negating, shifting, and scaling it to the range [0, 100], and then rounding its entries to the nearest integer. For the gap penalties, we started from the default parameter setting for Opal (see Wheeler and Kececioglu (2007)), which is an optimal choice of gap penalties for the BLSM62 matrix found by inverse parametric alignment (see Kececioglu and Kim (2006), Kim and Kececioglu (2007)). Around these default values we enumerated a Cartesian product of integer choices in the neighborhood of this central choice, generating over 2,100 four-tuples of gap penalties. The resulting set of roughly 16,900 parameter choices (each substitution matrix combined with each gap penalty assignment) was then reduced by examining the benchmarks in our collection as follows. In each difficulty bin of benchmarks, we (1) ran Opal with all of these parameter choices on the benchmarks in the bin, (2) for a given parameter choice measured the average accuracy of the alignments computed by Opal using that parameter choice on the bin, (3) sorted the parameter choices for a bin by their average accuracy, and (4) in each bin kept the top 300 choices with highest average accuracy. Unioning these top choices from all 10 difficulty bins, and removing duplicates, gave our final set U. This universe U has 2,211 parameter choices.
To generate training and test sets for our parameter-advising experiments on a given set P ⊆ U of parameter choices, we used three-fold cross validation. For each bin, we evenly and randomly partitioned the benchmarks in the bin into three groups; we then formed three different splits of the entire set of benchmarks into a training class and a test class, where each split put one group in a bin into the test class and the other two groups in the bin into the training class; finally, for each split we generated a test set and a training set of example alignments by generating |P| alignments from each benchmark S in a training or test class by running Opal on S using each parameter choice in P. An estimator learned on the examples in the training set was evaluated on the examples in the associated test set. The results that we report are averages over three runs, where each run is on one of these training and test set pairs. (Note that across these three runs, every example alignment is tested on exactly once.) For a set P of 10 parameters, each run has over 5,700 training examples and 2,800 test examples.
6.1. Selecting features
Of the features listed in Section 4, not all are equally informative, and some can weaken an estimator. We selected subsets of features for use in accuracy estimators as follows. We exhaustively enumerated all 4,095 subsets of the 12 features we considered, and for each subset, fitted an estimator that used just the features in that subset. To fit an estimator on a feature set, we used both value fitting and difference fitting, for both linear and quadratic estimators (i.e., degree 1 and 2 polynomials), under both the L1 norm and L2 norm error measures. Each of the resulting estimators was evaluated for its performance on parameter advising, in terms of the true accuracy of its resulting advisor averaged across the 10 difficulty bins. (Exactly how the average accuracy of an advisor is measured is discussed later in this section.) This evaluation process was used to find good feature subsets for the optimal parameter sets P ⊆ U with |P| equal to 5, 10, and 15 parameter choices. (Optimal oracle parameter sets P are discussed in Section 5.) To find a good overall feature set that works well for differing numbers of parameters, we examined all subsets of features considered by the above process, and chose the feature set that had the highest accuracy averaged across the 5-, 10-, and 15-parameter sets.
The best overall feature set found by this process is a five-feature subset consisting of the following feature functions:
• Secondary Structure Agreement, fSA,
• Secondary Structure Identity, fSI,
• Secondary Structure Blockiness, fBL,
• Gap Open Density, fGO, and
• Average Substitution Score, fAS.
The corresponding fitted estimator is
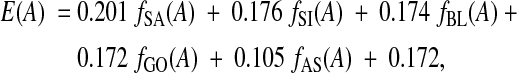 |
where at the end is the constant term. (Each coefficient here is really an average of the corresponding coefficients from the nine estimators resulting from fitting on training sets for the three cross-validation folds for each of the above three parameter sets.) This linear estimator was obtained using difference fitting under the L1 norm.
The above five-feature estimator, when advising using the optimal 10-parameter set, has accuracy 59.3% averaged across all bins. By comparison, the 12-feature estimator (which uses all feature functions) has corresponding average accuracy 57.0%. Clearly, feature selection helps.
Comparing with prior estimators, advisors that use MOS, PredSP, COFFEE, HoT, and NorMD as their estimator with this same 10-parameter set have respective average accuracies of 53.8%, 53.3%, 53.2%, 52.2%, and 51.0%. So Facet outperforms the next best estimator by more than 5% in accuracy when advising with 10 parameters. (Further detailed comparisons among these estimators are given later.)
For the impact of varying the fitting approach and the degree of the polynomial, for variants we quote their average accuracy when advising with the 10-parameter set using their best feature subset. The accuracy of the linear estimator with difference fitting is 59.3%, and with value fitting is 59.9%. While value fitting happens to be marginally better here (but is worse in other scenarios), its coefficients and best feature set vary considerably between cross-validation folds, while difference fitting is much more stable. The accuracy of the quadratic estimator with difference fitting using regularization is 59.5%, and with value fitting is 59.0%. In general, we do not experience a consistent improvement (if any) with a quadratic estimator over a linear estimator, while it has many more coefficients. We also observe an insignificant difference between the L1 and L2 norms for error measures when fitting.
In the results below, for Facet we use the optimal five-feature linear estimator given above obtained by difference fitting under the L1 norm.
6.2. Comparing estimators to true accuracy
To examine the fit of an estimator to true accuracy, the scatter plots in Figure 1 show the value of an estimator versus true accuracy on all example alignments in the 15-parameter test set. (This set has over 12,900 test examples. Note that these test examples are disjoint from the training examples used to fit our estimator.) The scatter plots show our Facet estimator as well as the PredSP, MOS, COFFEE, HoT, and NorMD estimators. We note that the MOS estimator, in distinction to the other estimators, receives as input all the alternate alignments of an example's sequences generated by the 15 parameter choices, which is much more information than is provided to the other estimators that are only given the one example alignment.
FIG. 1.

Correlation of estimators with accuracy. Each scatter plot shows the value of an estimator versus true accuracy for all alignments in the 15-parameter test set.
An ideal estimator would be monotonic increasing in true accuracy. A real estimator approaches this ideal according to its slope and spread. To discriminate between low- and high-accuracy alignments for parameter advising, an estimator needs large slope with small spread. Comparing the scatter plots by spread, Facet and PredSP have the smallest spread; MOS and COFFEE have intermediate spread; and HoT and NorMD have the largest spread. Comparing by slope, PredSP and NorMD have the smallest slope; Facet and HoT have intermediate slope; and MOS and COFFEE have the largest slope. While PredSP has small spread, it also has small slope, which weakens its discriminative power. While MOS and COFFEE have large slope, they also have significant spread, weakening their discrimination. Finally HoT and NorMD have too large a spread to discriminate. Of all these estimators, Facet seems to achieve the best compromise of slope and spread, for a tighter monotonic trend across all accuracies. This better compromise between slope and spread may be what leads to improved performance for Facet on parameter advising, as demonstrated later in this section.
Our estimator combines five features to obtain its estimate. To give a sense of how these features behave, Figure 2 shows scatter plots of three of the five feature functions that have the strongest correlation with true accuracy (which all use secondary structure): Secondary Structure Blockiness, Secondary Structure Identity, and Secondary Structure Agreement. Notice that the combined five-feature Facet estimator, also shown in the figure, has smaller spread than any one of its individual features.
FIG. 2.

Correlation of features with accuracy. The scatter plots show values of the three strongest feature functions used in the Facet estimator, as well as the estimator itself, for all alignments in the 15-parameter test set.
6.3. Performance on parameter advising
To evaluate these methods for parameter advising, we computed optimal oracle parameter sets P, using our approach from Section 5 that solves an integer linear programming problem, for  . We show results for the resulting parameter advisors that use the estimators Facet, MOS, COFFEE, PredSP, HoT, and NorMD. Each advisor is used within Opal, which outputs the alignment computed with its recommended parameter choice from set P. Advisors are compared by the true accuracy of the resulting Opal alignment, where accuracy is first averaged within each difficulty bin and then averaged across all bins. We also do the same comparison looking at the rank of the alignment chosen by the advisor, where the alignments generated by the |P| parameter choices are ordered by their true accuracy. (So the rank can range from 1 to |P|, with rank 1 corresponding to a perfect advisor.)
Table 1 lists the parameter choices in the optimal oracle sets P for cardinalities 1, 5, 10, and 15. Each row corresponds to a parameter choice (σ, γI, γE, λI, λE), where σ is a substitution matrix and the remaining parameters are gap penalties as described earlier. The initial columns specify the parameter values for these choices. The last four columns show the choices in the optimal parameter sets. (Cardinality |P| = 1 corresponds to the best default parameter choice.) For a given cardinality, the percentage values down its column show the distribution of usage of that parameter choice in P, where empty entries have usage zero. Here usage is the number of benchmarks in the collection for which that parameter choice gives the highest true accuracy in Opal out of the choices in P. The members of a set P are exactly those parameter choices with nonzero usage in its column. Note that at all cardinalities, usage tends to be somewhat evenly spread across the choices in the set; in other words, the optimal choices are not overly specialized. Furthermore, a finer analysis within difficulty bins reveals that the choices in a set are not specialized to low or high accuracies.
Table 1.
Optimal Oracle Sets P and Their Parameter Usage
|
Parameter choice |
Cardinality |P| |
|||||||
|---|---|---|---|---|---|---|---|---|
| σ | γI | γE | λI | λE | 1 | 5 | 10 | 15 |
| VTML200 | 45 | 11 | 42 | 40 | 100% | |||
| VTML200 | 45 | 6 | 45 | 44 | 19% | 12% | 6% | |
| BLSM45 | 55 | 2 | 45 | 43 | 17% | 10% | 5% | |
| VTML40 | 45 | 15 | 40 | 40 | 16% | 9% | ||
| BLSM45 | 80 | 4 | 43 | 43 | 22% | 11% | ||
| VTML120 | 90 | 31 | 41 | 39 | 25% | |||
| BLSM62 | 95 | 14 | 44 | 43 | 10% | 9% | ||
| BLSM62 | 50 | 32 | 42 | 41 | 8% | 5% | ||
| BLSM80 | 75 | 56 | 45 | 45 | 9% | 6% | ||
| VTML120 | 45 | 33 | 41 | 38 | 10% | |||
| VTML200 | 55 | 19 | 44 | 43 | 10% | |||
| BLSM80 | 95 | 4 | 43 | 40 | 11% | |||
| VTML40 | 45 | 33 | 42 | 39 | 4% | |||
| VTML40 | 45 | 11 | 40 | 40 | 4% | |||
| VTML120 | 45 | 20 | 41 | 39 | 6% | |||
| VTML120 | 75 | 33 | 42 | 41 | 18% | |||
| VTML200 | 50 | 37 | 43 | 43 | 6% | |||
| BLSM45 | 80 | 12 | 43 | 43 | 8% | |||
| BLSM62 | 70 | 3 | 45 | 42 | 5% | |||
| BLSM62 | 70 | 52 | 44 | 42 | 5% | |||
| BLSM80 | 55 | 13 | 45 | 42 | 6% | |||
| BLSM80 | 65 | 48 | 42 | 41 | 7% | |||
Figure 3 shows the performance of the four best advising methods (Facet, MOS, COFFEE, and PredSP) on the optimal oracle set P of 10 parameters. The top chart shows accuracy, while the bottom chart shows the rank of the alternate alignment chosen by the advisor, averaged over the benchmarks in each difficulty bin. The oracle curve shows what would be achieved by a perfect advisor. The figure also shows the expected performance of a purely random advisor, which simply picks a parameter from P uniformly at random. With respect to accuracy, note that the advisor that uses Facet is the only one that always performs above random; averaged across all bins, MOS, COFFEE, and PredSP perform close to random. The Facet advisor is also strictly better than every other advisor in accuracy on all bins. With respect to rank, Facet is strictly better than every advisor in all but the easiest bin, where it nearly ties MOS.
FIG. 3.

Advising accuracy and rank across benchmark bins. Each bar shows an estimator's performance in advising, averaged over the benchmarks in the bin. Advising is with the optimal 10-parameter oracle set. The rightmost charts show averages across all bins.
As Figure 3 shows, Facet gives the most help in the hardest bins. In the two most difficult bins, labeled 0.1 and 0.2 in the figure, advising with Facet improves on the accuracy of the best default parameter choice by more than 22% and 27%, respectively.
Figure 4 shows the advising performance of all estimators, uniformly averaged across all bins, as a function of the number of parameter choices |P| for cardinalities  . Notice that with respect to accuracy, the performance of the MOS, COFFEE, PredSP, HoT, and NorMD advisors generally tends to decline as the number of parameter choices increases (and for some is not far from random). The Facet advisor generally improves with more parameters, though at 10 parameters the performance has roughly saturated. We remark that the performance of the oracle, if its curve is continued indefinitely to the right, reaches a limiting accuracy at P = U of 75.3%.
FIG. 4.

Advising accuracy and rank for varying numbers of parameters. At each number of parameters, the curves show accuracy or rank averaged over all benchmark bins.
7. Conclusion
We have presented an efficiently-computable estimator for the accuracy of protein multiple alignments without knowing the reference alignment. The estimator is a polynomial function of alignment features whose coefficients are learned from example alignments using linear and quadratic programming. We evaluated our estimator in the context of parameter advising, and show it consistently outperforms other approaches to estimating accuracy when used for the advising task. Compared to using the best default parameter choice, the resulting parameter advisor using a set of 10 parameters provides as much as a 27% improvement in multiple alignment accuracy on the hardest benchmarks.
7.1. Further research
There are many directions for further research. More sophisticated prediction of core columns will aid several of our features, as the definition of core column is crucial to the calculation of accuracy. While our current estimator is tailored to protein alignment, altering the set of features will allow the approach to be applied to DNA and RNA alignment. Attempting to directly compute alignments that optimize the estimator as an alignment scoring function seems daunting, but it may be feasible to incorporate some of the features, especially those involving secondary structure, into heuristics for alignment construction. Finally, applying our estimator to develop a so-called meta-aligner, which chooses the best output of a collection of aligners, is a potentially fruitful line of research.
Footnotes
Usually certain columns in the reference alignment are identified as core columns, which are the columns with high confidence of being correct. The accuracy of a computed alignment is then measured by how well it agrees with just the core columns of the reference alignment.
Here correctness can be either in terms of the unknown structural alignment (as in our present work on protein sequence alignment) or the unknown evolutionary alignment (as in simulation studies).
A residue is a position in a protein sequence together with the amino acid at that position.
This is mainly a consequence of the fact that proteins for which reliable structural reference alignments are available tend to be closely related, and hence easier to align. It does not mean that typical biological inputs are easy.
Acknowledgments
We thank Travis Wheeler for generation of an initial universe of parameter choices for Opal, and for early thoughts on parameter advising; Vladimir Filkov for discussions on feature function approaches; and the referees for their helpful comments. Research of JK is supported by the U.S. National Science Foundation through grants IIS-1050293 and IIS-1217886. Research of DD is supported by a PhD fellowship from the U.S. National Science Foundation through the University of Arizona IGERT in Comparative Genomics grant DGE-0654435. An earlier conference version of this paper appeared as DeBlasio, Wheeler and Kececioglu (2012).
Disclosure Statement
The authors declare that no competing financial interests exist.
References
- Ahola V. Aittokallio T. Vihinen M. Uusipaikka E. A statistical score for assessing the quality of multiple sequence alignments. BMC Bioinformatics. 2006;7:484. doi: 10.1186/1471-2105-7-484. [DOI] [PMC free article] [PubMed] [Google Scholar]
- Ahola V. Aittokallio T. Vihinen M. Uusipaikka E. Model-based prediction of sequence alignment quality. Bioinformatics. 2008;24:2165–2171. doi: 10.1093/bioinformatics/btn414. [DOI] [PubMed] [Google Scholar]
- Bahr A. Thompson J.D. Thierry J.C. Poch O. BAliBASE (Benchmark Alignment dataBASE): enhancements for repeats, transmembrane sequences and circular permutations. Nucleic Acids Research. 2001;29:323–326. doi: 10.1093/nar/29.1.323. [DOI] [PMC free article] [PubMed] [Google Scholar]
- Balaji S. Sujatha S. Kumar S.S.C. Srinivasan N. PALI: a database of alignments and phylogeny of homologous protein structures. Nucleic Acids Research. 2001;29:61–65. doi: 10.1093/nar/29.1.61. [DOI] [PMC free article] [PubMed] [Google Scholar]
- Carrillo H. Lipman D. The multiple sequence alignment problem in biology. SIAM Journal on Applied Mathematics. 1988;48:1073–1082. [Google Scholar]
- Cormen T.H. Leiserson C.E. Rivest R.L. Stein C. Introduction to Algorithms. 3rd. MIT Press; Cambridge, MA: 2009. [Google Scholar]
- DeBlasio D.F. Wheeler T.J. Kececioglu J.D. Estimating the accuracy of multiple alignments and its use in parameter advising. Proceedings of the 16th Conference on Research in Computational Molecular Biology (RECOMB); Springer-Verlag LNBI 7262; 2012. pp. 45–59. [Google Scholar]
- Drezner Z. Hamacher H.W. Facility Location: Applications and Theory. Springer-Verlag; Berlin: 2004. [Google Scholar]
- Edgar R.C. BENCH. 2009. www.drive5.com/bench www.drive5.com/bench
- Estabrook G. Johnson C. McMorris F. An idealized concept of the true cladistic character. Mathematical Biosciences. 1975;23:263–272. [Google Scholar]
- Garey M.R. Johnson D.S. Computers and Intractability: A Guide to the Theory of NP-Completeness. W.H. Freeman and Company; New York: 1979. [Google Scholar]
- Gotoh O. An improved algorithm for matching biological sequences. Journal of Molecular Biology. 1982;162:705–708. doi: 10.1016/0022-2836(82)90398-9. [DOI] [PubMed] [Google Scholar]
- Gowri V.S. Pandit S.B. Anand B. Srinivasan N. Balaji S. PALI, release 2.3. 2005. http://pauling.mbu.iisc.ernet.in/∼pali http://pauling.mbu.iisc.ernet.in/∼pali
- Gusfield D. Algorithms on Strings, Trees, and Sequences: Computer Science and Computational Biology. Cambridge University Press; New York: 1997. [Google Scholar]
- Henikoff S. Henikoff J.G. Amino acid substitution matrices from protein blocks. PNAS USA. 1992;89:10915–10919. doi: 10.1073/pnas.89.22.10915. [DOI] [PMC free article] [PubMed] [Google Scholar]
- Hertz G.Z. Stormo G.D. Identifying DNA and protein patterns with statistically significant alignments of multiple sequences. Bioinformatics. 1999;15:563–577. doi: 10.1093/bioinformatics/15.7.563. [DOI] [PubMed] [Google Scholar]
- Jones D.T. Protein secondary structure prediction based on position-specific scoring matrices. Journal of Molecular Biology. 1999;292:195–202. doi: 10.1006/jmbi.1999.3091. [DOI] [PubMed] [Google Scholar]
- Kececioglu J. Kim E. Simple and fast inverse alignment. Proceedings of the 10th Conference on Research in Computational Molecular Biology (RECOMB); Springer LNBI 3909; 2006. pp. 441–455. [Google Scholar]
- Kececioglu J. Starrett D. Aligning alignments exactly. Proceedings of the 8th ACM Conference on Research in Computational Molecular Biology (RECOMB); 2004. pp. 85–96. [Google Scholar]
- Kim E. Kececioglu J. Learning scoring schemes for sequence alignment from partial examples. IEEE/ACM Transactions on Computational Biology and Bioinformatics. 2007;5:546–556. doi: 10.1109/TCBB.2008.57. [DOI] [PubMed] [Google Scholar]
- Kim J. Ma J. PSAR: measuring multiple sequence alignment reliability by probabilistic sampling. Nucleic Acids Research. 2011;39:6359–6368. doi: 10.1093/nar/gkr334. [DOI] [PMC free article] [PubMed] [Google Scholar]
- Landan G. Graur D. Heads or tails: a simple reliability check for multiple sequence alignments. Molecular Biology and Evolution. 2007;24:1380–1383. doi: 10.1093/molbev/msm060. [DOI] [PubMed] [Google Scholar]
- Lassmann T. Sonnhammer E.L.L. Automatic assessment of alignment quality. Nucleic Acids Research. 2005;33:7120–7128. doi: 10.1093/nar/gki1020. [DOI] [PMC free article] [PubMed] [Google Scholar]
- Muller J. Creevey C.J. Thompson J.D. Arendt D. Bork P. AQUA: automated quality improvement for multiple sequence alignments. Bioinformatics. 2010;26:263–265. doi: 10.1093/bioinformatics/btp651. [DOI] [PubMed] [Google Scholar]
- Müller T. Spang R. Vingron M. Estimating amino acid substitution models: a comparison of Dayhoff's estimator, the resolvent approach and a maximum likelihood method. Molecular Biology and Evolution. 2002;19:8–13. doi: 10.1093/oxfordjournals.molbev.a003985. [DOI] [PubMed] [Google Scholar]
- Notredame C. Higgins D.G. Heringa J. T-Coffee: a novel method for fast and accurate multiple sequence alignment. Journal of Molecular Biology. 2000;302:205–217. doi: 10.1006/jmbi.2000.4042. [DOI] [PubMed] [Google Scholar]
- Notredame C. Holm L. Higgins D.G. COFFEE: an objective function for multiple sequence alignments. Bioinformatics. 1998;14:407–422. doi: 10.1093/bioinformatics/14.5.407. [DOI] [PubMed] [Google Scholar]
- Pei J. Grishin N.V. AL2CO: calculation of positional conservation in a protein sequence alignment. Bioinformatics. 2001;17:700–712. doi: 10.1093/bioinformatics/17.8.700. [DOI] [PubMed] [Google Scholar]
- Penn O. Privman E. Landan G. Graur D. Pupko T. An alignment confidence score capturing robustness to guide tree uncertainty. Molecular Biology and Evolution. 2010a;27:1759–1767. doi: 10.1093/molbev/msq066. [DOI] [PMC free article] [PubMed] [Google Scholar]
- Penn O. Privman E. Ashkenazy H. Landan G. Graur D. Pupko T. GUIDANCE: a web server for assessing alignment confidence scores. Nucleic Acids Research. 2010b;38:W23–W28. doi: 10.1093/nar/gkq443. [DOI] [PMC free article] [PubMed] [Google Scholar]
- Russell R.B. Barton G.J. Multiple protein sequence alignment from tertiary structure comparison: assignment of global and residue confidence levels. Proteins. 1992;14:309–323. doi: 10.1002/prot.340140216. [DOI] [PubMed] [Google Scholar]
- Thompson J.D. Plewniak F. Ripp R. Thierry J.C. Poch O. Towards a reliable objective function for multiple sequence alignments. J Mol Biol. 2001;314:937–51. doi: 10.1006/jmbi.2001.5187. [DOI] [PubMed] [Google Scholar]
- Thompson J.D. Prigent V. Poch O. LEON: multiple alignment evaluation of neighbors. Nucleic Acids Research. 2004;32:1298–1307. doi: 10.1093/nar/gkh294. [DOI] [PMC free article] [PubMed] [Google Scholar]
- Thompson J.D. Thierry J.C. Poch O. RASCAL: rapid scanning and correction of multiple sequence alignments. Bioinformatics. 2003;19:1155–1161. doi: 10.1093/bioinformatics/btg133. [DOI] [PubMed] [Google Scholar]
- Van Walle I. Lasters I. Wyns L. SABmark: a benchmark for sequence alignment that covers the entire known fold space. Bioinformatics. 2005;21:1267–1268. doi: 10.1093/bioinformatics/bth493. [DOI] [PubMed] [Google Scholar]
- Wheeler T.J. Kececioglu J.D. Multiple alignment by aligning alignments. Proceedings of the 15th ISCB Conference on Intelligent Systems for Molecular Biology (ISMB), Bioinformatics; 2007. pp. i559–i568. [DOI] [PubMed] [Google Scholar]
- Wheeler T.J. Kececioglu J.D. Opal: software for aligning multiple biological sequences. Version 2.1.0. 2012. http://opal.cs.arizona.edu http://opal.cs.arizona.edu
- Wilbur W.J. Lipman D.J. Rapid similarity searches of nucleic acid and protein data banks. Proceedings of the National Academy of Sciences USA. 1983;80:726–730. doi: 10.1073/pnas.80.3.726. [DOI] [PMC free article] [PubMed] [Google Scholar]