

Abstract
High-throughput genomic data reveal thousands of gene variants per patient, and it is often difficult to determine which of these variants underlies disease in a given individual. However, at the population level, there may be some degree of phenotypic homogeneity, with alterations of specific physiological pathways underlying the pathogenesis of a particular disease. We describe here the human gene connectome (HGC) as a unique approach for human Mendelian genetic research, facilitating the interpretation of abundant genetic data from patients with the same disease, and guiding subsequent experimental investigations. We first defined the set of the shortest plausible biological distances, routes, and degrees of separation between all pairs of human genes by applying a shortest distance algorithm to the full human gene network. We then designed a hypothesis-driven application of the HGC, in which we generated a Toll-like receptor 3-specific connectome useful for the genetic dissection of inborn errors of Toll-like receptor 3 immunity. In addition, we developed a functional genomic alignment approach from the HGC. In functional genomic alignment, the genes are clustered according to biological distance (rather than the traditional molecular evolutionary genetic distance), as estimated from the HGC. Finally, we compared the HGC with three state-of-the-art methods: String, FunCoup, and HumanNet. We demonstrated that the existing methods are more suitable for polygenic studies, whereas HGC approaches are more suitable for monogenic studies. The HGC and functional genomic alignment data and computer programs are freely available to noncommercial users from http://lab.rockefeller.edu/casanova/HGC and should facilitate the genome-wide selection of disease-causing candidate alleles for experimental validation.
Keywords: next generation sequencing, high-throughput genomics, gene prioritization, pathway prediction, human genetics
Recent advances in next-generation sequencing (NGS) have made it possible to identify thousands of germline protein-coding gene variants per patient, only one or a few of which may cause disease (1, 2). In such genome-wide approaches, it may be difficult to identify candidate morbid variants by genetic means alone, due to the uncertainty of the mode of inheritance in individual kindreds and the possibility of high levels of genetic heterogeneity in the population. Nevertheless, there may be some degree of physiological homogeneity in the pathway underlying the pathogenesis of a particular disease in different patients (3, 4). The abundance of high-throughput data provides an opportunity to test this hypothesis of pathogenesis and pathway homogeneity (5, 6). However, it is often almost impossible to detect biological links between very small numbers of genes with state-of-the-art programs, such as String (7), FunCoup (8), and HumanNet (9), unless they are predicted to be directly connected in a pathway. These programs provide estimates for direct connections or for the extended network shared by two given genes from the same pathway, rather than the specific pathway (i.e., route) between any two given genes of interest. These existing methods are therefore more suitable for polygenic disease/phenotype studies than for the investigation of monogenic traits, in which the goal is to detect a single mutated gene, with the other polymorphic genes being of less interest. This goes some way to explaining why, despite the abundance of NGS data, the discovery of disease-causing alleles from such data remains somewhat limited.
We developed the human gene connectome (HGC) to overcome this problem. The principal objective of this approach is to define, in silico, the set of the shortest plausible biological distances and routes between any two given genes. We hypothesized that the morbid genes underlying a specific disease in different patients are closely connected via core genes or signaling pathways. We designed an HGC-based hypothesis-driven approach, to be used in research based on high-throughput genomic data, through the selection of candidate genes belonging to a given morbid pathway (hypothesis-driven). We assessed the usefulness of the HGC, by applying a hypothesis-driven approach to generate a Toll-like receptor 3 (TLR3)-specific connectome. Inborn errors of TLR3 immunity have been shown to underlie the pathogenesis of herpes simplex virus 1 (HSV-1) encephalitis (HSE) in a small fraction of affected children (10–13). No genetic etiology has yet been identified for most children with HSE and the TLR3 connectome may facilitate the selection of candidate variants in these patients (3, 14). Finally, we generated all human gene-specific connectomes, including computer programs for HGC analysis, which are available from http://lab.rockefeller.edu/casanova/HGC.
Results
The HGC.
We define the HGC as the full set of distances and routes between any two human genes. We generated our HGC from the binding subset of the String protein actions database version 9.0 (7, 15, 16). We rendered distance calculation more biologically plausible, by accounting for the degrees of separation between each pair of genes (Fig. 1; see detailed explanation in Materials and Methods). Each pair of genes considered may be directly connected, indirectly connected, or unconnected. We randomly sampled 100,000 gene pairs from the HGC to generate probability distributions for degrees of separation (C; Fig. 1A) and distances between pairs of human genes. The median C value in the HGC is 4 (the expected number of genes on the biological route between two random human genes would therefore be 3), whereas the median weighted biological distance (B; Eq. 2) between two random genes in the HGC is 23.692. We then randomly sampled gene pairs for biological distances corresponding to specific degrees of separation (Fig. 1B). We found that only 0.086% of all possible human gene pairs are directly connected (i.e., current knowledge concerning the direct binding connections between two given human genes). We therefore predicted the remaining 99.914% of human gene pair routes and distances with the HGC (Fig. 1A). Distance ranges for the 95% confidence interval of two consecutive degrees of separation systematically overlapped, whereas the ranges of distances between genes with C = 1 (directly connected genes) and C ≥ 3 never overlapped (Fig. 1B). For example, a 9.4% overlap was observed between the distances for C = 2 and those for C = 3. In the case of real biological pathways, this indicates that, although a smaller degree of separation mostly indicates a smaller biological distance, biological distances may be shorter for higher degrees of separation in some cases, due to very strong direct connections (i.e., very short direct biological distances). We therefore suggest that the calculation of distances in this way generates a range of values (B, C, and predicted route) that are biologically relevant and meaningful.
Fig. 1.

(A) The proportions of the various degrees of separation (C) in the HGC. Only 0.086% of all human genes are directly connected (C = 1, data obtained directly from String). The median degree of separation between genes is 4 (39.932% of all connections), 0.041% of genes have a C ≥ 9, and 2.152% of human genes cannot be connected, mostly because they belong to isolated networks of small numbers of genes disconnected from the main human gene network. (B) Box plots displaying the range of biological distance (B) between genes for different degrees of separation C in the HGC. The box represents the 95% confidence interval for randomly sampled gene pairs, the circle represents the median value, the diamond represents the mean value and the vertical line shows the full range from the minimum to the maximum for the specific C value considered. The box on the right shows random sampling from the HGC for all C values, including C ≥ 9.
Generation of the TLR3 Connectome for Hypothesis-Driven Research.
A core gene-specific HGC would facilitate the selection and study of potentially relevant morbid alleles from high-throughput data for patients with a particular disease. This is now possible, by ranking, in each individual patient, the list of polymorphic genes according to their biological proximity to a central gene that is known to be associated with the disease. We began by defining the connectome of TLR3 (Fig. 2, Table S1). Inborn errors of TLR3 immunity have been shown to underlie HSE in a small fraction of affected children with HSE (3, 10–12, 14). Childhood HSE is a devastating viral illness of the central nervous system (CNS) occurring during primary infection with the almost ubiquitous HSV-1. We recently showed that HSE results from inborn errors of TLR3-dependent IFN-α/β or IFN-λ immunity, with the discovery of germline mutations in a group of TLR3–IFN pathway genes (Fig. S1), including TLR3, TIR-domain-containing adapter-inducing interferon-β (TRIF/TICAM1), Unc-93 homolog B1 (UNC93B1), TNF receptor-associated factor 3 (TRAF3) and TANK-binding kinase 1 (TBK1), these findings being supported by extensive studies (3, 11–14, 17–19). We also recently showed that inborn errors of TLR3-dependent IFN production impair intrinsic immunity to HSV-1 in nonhematopoietic CNS-resident cells, including neurons and oligodendrocytes in particular (10, 20). We therefore defined TLR3 as the core HSE gene and hypothesized that new HSE-causing genetic lesions might affect known (experimentally connected) or unknown TLR3 pathway genes. The TLR3 connectome is the full set of distances and routes between all other human genes and TLR3, generated as the HGC. The TLR3 connectome contains 12,009 genes, including 601 genes in the top 5% (significant proximity to TLR3; P < 0.05; Fig. 2, Table S1). The TLR3 connectome has a median C = 4, similar to that for the entire HGC, whereas its median distance is 17.684, 25% lower than that for the whole HGC, highlighting the relative centrality of TLR3 in the human genome [the median distance for less central genes may be considerably lower than that of other genes: 30.51, for example, for the gene connectome of TAPE (coiled-coil and C2 domain containing 1A (CC2D1A)), which encodes a protein of the TLR3 pathway]. We carefully validated the accuracy of the TLR3 connectome on the basis of our knowledge for the 21 experimentally connected, known TLR3 pathway genes (excluding TLR3; Table S2, Fig. S1, Materials and Methods), including the five known HSE-causing TLR3 pathway genes (including TLR3) (14), as described below.
Fig. 2.

Genes within the top 5% of the TLR3 connectome: the 601 human genes with the shortest biological distances to TLR3, as identified from the HGC. The genes are placed in a 2D space (Materials and Methods) and the colors used indicate their unweighted distance from TLR3. The genes in the upper fifth percentile (the outer circle) were assigned a distance of 3.3, for clear visualization. The dashed lines show the predicted shortest plausible biological routes between TLR3 and the 17 (of 21) known TLR3-pathway genes within the top 5% of the TLR3 connectome. The TLR3 pathway genes known to be associated with HSE (all five are within the top 5% of the TLR3 connectome) are indicated by a violet star.
Assessing the Accuracy of the TLR3 Connectome.
The relevance of a list of genes to a disease or pathway for which a core gene (TLR3 in the case of HSE) has been identified can be assessed by generating the connectome of the core gene, as described above for TLR3 (see Table S2 for the known TLR3 pathway genes within the TLR3 connectome). We identified and present together the 21 genes (excluding TLR3 itself) that we considered to be the most strongly associated with the TLR3–IFN cascade, based on in vivo and/or in vitro validation of their involvement in the TLR3 pathway (10) (Fig. S1). We found that 17 of these 21 genes belonged to the top 5% of the TLR3 connectome. These 17 genes included all eight TLR3 pathway genes validated in vivo. All five known HSE-associated TLR3 pathway genes (14) were also found to lie in the top 5% of the TLR3 connectome. We calculated the statistical significance of all five HSE genes, all eight in vivo–validated genes, and 17 of the 21 known TLR3 pathway genes being located within the top 5% of the TLR3 connectome, by randomly sampling sets of five, eight, and 21 human genes (for the HSE, in vivo, and TLR3 pathway tests, respectively) and determining the frequency with which they were found in the top 5% of the TLR3 connectome. We obtained a P < 10−7 for all three sets. By contrast, the implementation of a simpler distance metric in the form of a uniform score for direct connections, with the ranking of genes by degrees of separation only (i.e., an unweighted graph), yielded a significantly lower discovery rate of TLR3 pathway genes in the top 5% of the TLR3 connectome. Only eight of the 21 known TLR3 pathway genes (P = 4.9 × 10⁻⁶) were identified with this simplified approach. A best reciprocal P value (BRP) test (i.e., ranking TLR3 within the connectomes of other genes and choosing the lowest of the two P values, to account for the connectivity of less central genes) was carried out for genes experimentally demonstrated to be involved in the TLR3 pathway but displaying no significant connection to TLR3 (P ≥ 0.05) in the TLR3 connectome. This resulted in an increase in the predicted connectivity to TLR3 for the two lowest ranking known TLR3 pathway genes [from P = 0.548 to P = 0.054 for TAPE (CC2D1A), and from P = 0.757 to P = 0.287 for NAP1 (5-azacytidine-induced protein 2)]. We suggest that the probable reasons for the lack of detection of these genes in the top 5% of the TLR3 connectome (despite their experimental validation as TLR3 pathway genes) is their poor description in previous studies and biological databases (21), resulting in less biologically accurate initial String scores and connections. These findings also demonstrate the power of the String scoring system, which takes into account multiple validations of connections between genes and the presence of genes in the same pathway. Two of the TLR3 pathway genes [TRIF (TICAM1) and UNC93B1] are directly connected to TLR3; the rest were predicted by the HGC algorithm (the directly connected genes were also detected by the HGC procedure, as indirectly connected routes must also be considered in case they provide a shorter biological distance than direct connections; Fig. 1B).
Assessing the Usefulness of the TLR3 Connectome.
We then aimed to assess the usefulness of the TLR3 connectome in the analysis of whole-exome sequencing data from HSE patients. For this purpose, we retrospectively obtained whole-exome sequencing data for two patients recently shown experimentally to carry HSE-causing mutations of the TBK1 gene (19). TBK1 was not directly connected to TLR3 in the String database at the time of analysis, and was thus an HGC algorithm prediction. We applied standard filters (nonsynonymous and rare polymorphic genes not found in public databases) to obtain final lists of 152 and 157 polymorphic genes for these two patients, respectively. In both patients, TBK1 was first on the list following sorting by HGC-predicted biological proximity to TLR3, validating the usefulness of our TLR3 connectome for the analysis of patient-specific high-throughput data. Moreover, with the HGC, we were able to predict the involvement of the two most recently described TLR3 pathway genes, proto-oncogene tyrosine-protein kinase (SRC) and epidermal growth factor receptor (EGFR), which were found in the top 1% of the TLR3 connectome (top 0.1% and top 1%, of the TLR3 connectome, respectively; Table S1 and Table S2) before their experimental validation as TLR3 pathway genes (22). Our TLR3 connectome is therefore not only consistent with existing biological and medical data, but can also be useful to predict the connectivity of any human gene to TLR3, on the basis of biological distance and route to TLR3. We have thus generated such a gene-specific connectome for all human genes, available from http://lab.rockefeller.edu/casanova/HGC.
Comparison Between the HGC and State-of-the-Art Methods in Monogenic Disease Research.
In the application of the HGC concept to high-throughput whole-genome data, any extensive list of mutated (or up-/down-regulated) genes can be ranked within the connectome of the core gene. The genes toward the top of the list (e.g., P < 0.05) are the most likely to be disease-causing according to the hypothesis that patients with the same disease bear morbid alleles in the same pathway. This has been illustrated by our study of the location of the HSE-causing genes in the TLR3 connectome, in which we statistically validated the HSE-causing TLR3 pathway genes located at the top of the TLR3 connectome. The process used for such analyses of high-throughput data from patients with other diseases would be identical to that described here for the TLR3 pathway and HSE-associated genes. These analyses demonstrate the greater suitability of the HGC than of available state-of-the-art methods for high-throughput monogenic studies: the goal in high-throughput monogenic disease studies is to identify the single disease-causing gene from a large set of genes. The HGC is the only method currently available that is designed for such an approach in monogenic studies. The HGC automates the process, by ranking any one of a large set of genes according to its biological distance to a known disease-causing gene, in relation to all other human genes, by direct or indirect connections. String provides the confidence score for direct relationships (whenever available) between the various pairs of genes, but not between a group of genes and a core gene, such as the 21 TLR3 pathway genes and TLR3, because most of these genes are not directly connected (Figs. S2 and S3). The same is true for FunCoup: the method provides estimates for the direct relationships of each gene in the set to the other genes in the set, but not for the specific relationship of all these genes to a core gene, such as TLR3 (Figs. S4 and S5). It is therefore difficult to use for the prioritization of a list of genes in the monogenic disease context. The HumanNet method is more suitable for monogenic studies, as it provides, for all genes in the set, a prediction concerning the likelihood of their belonging to the same functional network. However, in this method, for example, TLR3 was ranked number 14 (of 22), and the genes are split into subnetworks and cannot be automatically ranked in relation to a specific core gene (Figs. S6 and S7). This method is therefore less suitable for high-throughput datasets for hundreds or thousands of polymorphic genes.
Functional Genomic Alignment: Clustering Human Genes by Biological Distance.
Finally, we developed the functional genomic alignment (FGA) method (Materials and Methods) to cluster human genes according to their biological relationships. We tested the FGA by using it to identify the TLR3 connectome genes with the nearest biological relationships to the known HSE-causing TLR3 connectome genes, which, by inference, should be considered as candidate HSE-predisposing TLR3 pathway genes. We first generated a biological distance matrix for all top 5% TLR3 connectome gene pairs (Eq. 3). We then used the neighbor-joining (NJ) method to cluster biologically parsimonious genes hierarchically by clade (Fig. 3) (23). All of the known TLR3 pathway (including HSE-causing) genes clustered into a small number of clades (Fig. 3). Variants of any of the other 55 genes present in these clades therefore become prime candidates for TLR3 pathway deficiencies underlying childhood HSE. This hypothesis is experimentally testable. In FGA analysis, the HGC also becomes suitable for high-throughput oligogenic or polygenic studies, in which the aim is to identify several genes, from a long list, as responsible for the disease. Unlike the other state-of-the-art methods available, the HGC can be used for polygenic investigations in two ways: (i): ranking a list of polymorphic genes in relation to core genes (for example, see Table S2), and (ii) hypothesis-free clustering of the polymorphic genes by the FGA approach, on the basis of the distance matrix for all genes of interest (as in Fig. 3). All of the available methods described above are suitable for the investigation of polygenic traits; they are also complementary, as they tackle the problem from different angles. String provides visual output showing the direct interactions network and scores between the genes of the set considered and is very useful for data mining and investigations of the specific connections from different perspectives (the type of connection, published findings, evolution, etc.). FunCoup also makes use of a visual network interface with a thorough summary of the direct interactor estimates for each gene in the list. HumanNet follows a different approach, scoring a list of genes in terms of their probability of belonging to similar networks. Again, the principal advantage of the HGC and the difference between this approach and other state-of-the-art methods is the ability of the HGC method to predict a specific pathway and distance between any two indirectly connected genes, and to cluster a list of genes accordingly, either in relation to core genes of interest (hypothesis-driven clustering) or simply in relation to each other on the basis of their biological relationship, but without defining any particular gene as the core gene (hypothesis-free clustering).
Fig. 3.

FGA of the genes in the top 5% of the TLR3 connectome. Based on weighted biological distances between genes, as determined from the HGC, a hierarchical clustering of the genes in the top 5% of the TLR3 connectome was generated and plotted. HSE-associated genes are shown in red, whereas known TLR3-pathway genes not known to be associated with HSE are shown in green. Genes belonging to the same clades as known TLR3-pathway genes are shown in pink. Genes that are not known to be associated with TLR3-pathway or HSE are shown in blue. See Materials and Methods for a detailed description of the FGA approach applied.
Discussion
In monogenic diseases and phenotypes, only one of the thousands of genetic variants per individual is relevant. The interactions between the true disease-causing gene and the other polymorphic genes, or in the context of an extended genetic network, are therefore of no interest. Instead, the aim is to automate the ranking of the polymorphic genes according to their distance and specific route (rather than the large shared network) to the known, experimentally validated core gene. We show here that the current state-of-the-art methods String (7), FunCoup (8), and HumanNet (9), although excellent for polygenic research, are not optimized for monogenic phenotype/disease research as, in most cases, they cannot predict the single biologically plausible distance and route between a pair of genes that are not directly connected (Figs. S2–S7, Materials and Methods). We overcame this problem by generating the HGC, using the Dijkstra algorithm (24, 25), to identify the shortest biological route and distance between all pairs of genes in the human genome network generated from the String binding database. Just as the Human Connectome Project (26, 27) aims to identify the set of connections in the human brain, the HGC project aims to describe the connections between human genes, at the genome-wide level. The HGC can be generated from any other biological database of connections between genes and proteins. It makes it possible to generate a straightforward, biologically plausible ranking of any large set of human genes, on the basis of biological proximity. We propose the HGC as a powerful method for detecting relationships between genes of interest, by focusing on a core gene (such as TLR3) and forming a connection network of ranked genes around it, or alternatively, for estimating the biologically plausible distance and route between any pair of genes of interest, without the need to set hypothetical priorities in advance.
Hypothesis-driven HGC and FGA approaches can be applied to high-throughput data from any genome-wide study. As a proof-of-principle for the hypothesis-driven approach, the demonstration of biologically plausible estimated routes between TLR3 and the genes in the top 5% of the TLR3 connectome (Tables S1 and S2, Fig. 2, and Figs. S2–S7) suggests that the HGC is a suitable technique for predicting connections between genes, or between proteins, for various phenotypes of interest. This approach can also be applied to the discovery of novel disease-causing genes that are not necessarily involved in a signaling pathway. We identified 20 of the 20 collagen genes (28) and six of the six fibrous collagen protein genes associated with Ehlers–Danlos syndrome, using the core gene collagen, type I, alpha 1 (COL1A1) (29–33) (P < 10−7). However, for a Mendelian disease, such as sensorineural hearing loss, which has a broader phenotype and involves heterogeneous genetic pathways, this approach performs less well (although the results obtained are nonetheless significant), discovering only eight of the 38 disease-associated genes with the core gene gap junction beta-2 protein (GJB1) (34) (P = 0.00051). This suggests that the HGC is currently more effective for well-defined phenotypes with pathway homogeneity, in which it can also be applied to nonsignaling pathways. The discovery rate for broader phenotypes with pathway heterogeneity should increase when new genome-wide experimentally validated databases become available and are integrated into the current HGC database or with the use of several core genes corresponding to the different pathways. At present the HGC can be used only for genes whose mRNA translates into a protein. Future versions of the HGC will integrate untranslated RNA data (and other layers of information such as gene coexpression), when whole datasets containing sufficiently robust experimental evidence become available. Alternatively, this problem may be resolved by investigators generating HGCs by creating their own databases (see http://lab.rockefeller.edu/casanova/HGC for instructions). Potentially, the HGC could also be used to identify previously unknown pathways underlying the pathogenesis of a disease, this task being extremely time-consuming and almost impossible to achieve solely through searches of the existing scientific literature. This being said, the HGC and FGA should also be useful in hypothesis-free research—a genome-wide extension of the hypothesis-driven approach to situations in which no core gene has been identified. Overall, the rigorous application of HGC-based approaches should significantly increase the rate of discovery of disease-causing lesions for experimental testing (3).
Materials and Methods
Direct Gene Distances Dataset.
We extracted all of the direct human protein–protein connection data from the String protein actions database version 9.0 (7, 15, 16), and then selected only pairs for which binding interactions had been described (a total of 166,468 pairwise connections for 12,009 human genes). In this study we define “direct biological distance” as the inverted original String scores for confidence of connection, which give continuous distance metrics for differentiating between directly connected genes, assuming that strong confidence for a direct binding connection is equivalent to a short direct biological distance between two genes:
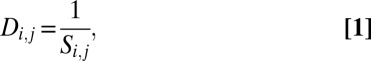 |
where Di,j is the direct biological distance between genes i and j, and Si,j is the combined String score for confidence in the connection between genes i and j. The String probabilistic confidence score represents the association between the two given proteins (or genes). The combined score is calculated by String, by independent benchmarking of the performance of the predicted connections with interaction/association data from different sources [including Gene Ontology (GO), Protein Data Bank, Molecular INTeraction database (MINT), Reactome] (35–38) against Kyoto Encyclopedia of Genes and Genomes (KEGG) (39, 40)—and by Bayesian analysis of the evidence of interaction between the two genes in various sources. Higher combined String confidence scores indicate that the association between the two genes is supported by a larger number of information sources (7). Si,j ranges from 0.150 (the weakest evidence of connection) to 0.999 (the strongest evidence of connection) (7), giving a direct distance between two given genes of between 1.000 (shortest distance) and 6.667 (longest distance).
Generation of the HGC.
We constructed a network of all human genes, with nodes and edges corresponding to the direct biological distances between any two available genes (25). Using the Dijkstra algorithm (24, 25), we determined the shortest distances and the corresponding shortest routes (i.e., the number of genes lying between two genes) for all possible pairs of human genes, whenever connection was possible. Some of the genes concerned belonged to secondary networks isolated from the major human genes network. We define “biological distance” between two genes as the weighted sum of direct biological distances on the route of the true molecular pathway between the two genes. We hypothesize that the number of genes on the route between genes i and j is positively correlated with the probability of i and j having unrelated biological functions. We therefore accounted for the shorter biological distance (B) between more directly connected genes by multiplying each distance by the degrees of separation C [the number of direct connections between the two genes (equal to the number of genes on the route between any pair of genes plus 1; so for a pair of genes separated by a route including four other genes, C = 5)]:
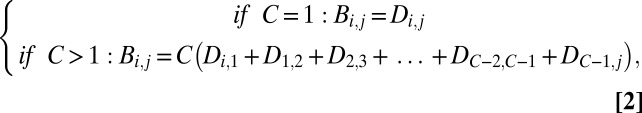 |
where Di,1 is the direct biological distance (Eq. 1) between gene i and gene 1 (the first gene on the route between genes i and j, as predicted by the Dijkstra algorithm), gene 2 is the second gene on the route, and gene C–1 is the last gene with a predicted direct connection to gene j, completing the predicted pathway. The HGC was constructed and investigated with the Python package NetworkX for complex network analysis (25).
Generation of the Human TLR3 and Gene-Specific Connectomes.
The genes in the TLR3 connectome were sorted and ranked according to their proximity to TLR3. A P value for the proximity of a gene to TLR3 within the TLR3 connectome was determined as the probability of a random gene in the TLR3 connectome having a shorter biological distance to TLR3, accounting for the uniform distribution of distances within the HGC. The sphere corresponding to a gene within the TLR3 connectome describes its simplified location among the circles for all human genes surrounding TLR3 (see Table S1). Distance ratios, with median and mean connectome values, were also calculated for each gene within the TLR3 connectome. We repeated the process described above for all human genes, to acquire a full set of human gene-specific connectomes. The TLR3 connectome was visualized with the Fruchterman–Reingold force-directed algorithm, which placed the genes in a 2D space by means of 10,000 interations with the NetworkX package (25, 41).
FGA: Clustering of High-Throughput Data on the Basis of Biological Distance.
In the face of an extensive list of genes acquired from any high-throughput technology (including the HGC described here), clustering is a common approach to estimating relationships between the genes. Multiple sequence alignment (MSA) is the method traditionally used for assessing evolutionary genetic distances between the genes of a given group, resulting in the generation of phylogenetic trees. However, evolutionary genetic distance does not necessarily indicate functional proximity (42), and genes associated with a specific pathway or disease/phenotype would be expected to belong to the same functional pathway/network (such as the TLR3 pathway). We therefore developed the FGA method for clustering genes by biological distance, as estimated by the HGC. The biological distance matrix M for a set of n genes is generated as follows:
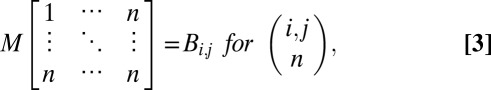 |
where i and j are any two given genes in the set. We demonstrate the method here with the top 5% of TLR3 connectome genes. We first estimated the biological distances between all of the genes in the top 5% of the TLR3 connectome and generated a matrix of these distances. We then used the APE (Analyses of Phylogenetics and Evolution) R language package (23), applying the NJ method to cluster the genes on the basis of the distance matrix and to plot the hierarchically clustered network of the genes in the top 5% of the TLR3 connectome. In this network, the TLR3 pathway and the HSE-causing genes were found to be clustered into a small number of clades constituting only a small proportion of the full biological tree for the genes in the top 5% of the TLR3 connectome. The tree illustrates the full set of relationships between the genes in the top 5% of the TLR3 connectome, accounting for direct, indirect, and relational connections.
Comparison with State-of-the-Art Methods.
We compared the HGC with three state-of-the-art methods: String, FunCoup, and HumanNet. In the context of monogenic disease investigation, for each of the methods, we first assessed the connection between TLR3 and TANK (a well-documented gene from the TLR3 pathway that is indirectly connected to TLR3). We then tested the connection between TLR3 and CC2D1A (a less well-described gene that is also a part of the TLR3 pathway) within the context of all 21 experimentally validated TLR3 pathway genes. We further assessed the suitability of the methods for Mendelian (monogenic) studies, by ranking a high-throughput dataset in relation to a core gene for detection of the single polymorphic gene of interest, by ranking the TLR3 pathway genes according to their proximity to TLR3. We also determined the suitability of the HGC, String, FunCoup, and HumanNet methods for complex genetic (polygenic) studies—clustering all genes in a filtered high-throughput dataset to suggest functional relationships between the genes (the FGA method).
Supplementary Material
Acknowledgments
We thank Aric Hagberg and Charanpal Dhanjal for advice concerning complex networks and graph theory; Emmanuel Paradis for hierarchical clustering advice; the String team for database information; Gale Kremer and Joseph Alexander for helping with the project's website; Yelena Nemirovskaya, Eric Anderson, and Tiffany Nivare for administrative support; Magali Audry, Alexandre Bolze, Vanessa Bryant, Satoshi Okada, Dusan Bogunovic, Marcela Moncada Velez, Carolina Prando, Michael Ciancanelli, Stephanie Boisson-Dupuis, Ruben Martinez Barricarte, Fabien Lafaille, Tamar Hermesh, Emmanuelle Jouanguy, and Yael Pinchevsky Itan for fruitful discussions and testing; and the Small World Experiment (43), which provided the initial inspiration for the HGC concept. Y.I. was funded by an AXA Research Fund postdoctoral fellowship. The work was funded in part by the National Center for Research Resources and the National Center for Advancing Sciences (NCATS), National Institutes of Health (NIH) Grant 8 UL1 TR000043.
Footnotes
Conflict of interest statement: J.-L.C. is a member of the Sanofi Strategic Development and Scientific Advisory Committee.
*This Direct Submission article had a prearranged editor.
Data deposition: The human gene-specific connectomes reported in this paper have been deposited in and are fully accessible to view and download from http://lab.rockefeller.edu/casanova/HGC.
This article contains supporting information online at www.pnas.org/lookup/suppl/doi:10.1073/pnas.1218167110/-/DCSupplemental.
References
- 1.Gilissen C, Hoischen A, Brunner HG, Veltman JA. Disease gene identification strategies for exome sequencing. Eur J Hum Genet. 2012;20(5):490–497. doi: 10.1038/ejhg.2011.258. [DOI] [PMC free article] [PubMed] [Google Scholar]
- 2.Metzker ML. Sequencing technologies—The next generation. Nat Rev Genet. 2010;11(1):31–46. doi: 10.1038/nrg2626. [DOI] [PubMed] [Google Scholar]
- 3.Alcaïs A, et al. Life-threatening infectious diseases of childhood: Single-gene inborn errors of immunity? Ann N Y Acad Sci. 2010;1214:18–33. doi: 10.1111/j.1749-6632.2010.05834.x. [DOI] [PubMed] [Google Scholar]
- 4.Casanova JL, Abel L. Primary immunodeficiencies: A field in its infancy. Science. 2007;317(5838):617–619. doi: 10.1126/science.1142963. [DOI] [PubMed] [Google Scholar]
- 5.Moresco EM, Beutler B. Resisting viral infection: The gene by gene approach. Curr Opin Virol. 2011;1(6):513–518. doi: 10.1016/j.coviro.2011.10.005. [DOI] [PMC free article] [PubMed] [Google Scholar]
- 6.Beutler B, Goodnow CC. How host defense is encoded in the mammalian genome. Mamm Genome. 2011;22(1-2):1–5. doi: 10.1007/s00335-010-9312-4. [DOI] [PubMed] [Google Scholar]
- 7.Szklarczyk D, et al. The STRING database in 2011: Functional interaction networks of proteins, globally integrated and scored. Nucleic Acids Res. 2011;39(Database issue):D561–D568. doi: 10.1093/nar/gkq973. [DOI] [PMC free article] [PubMed] [Google Scholar]
- 8.Alexeyenko A, et al. Comparative interactomics with Funcoup 2.0. Nucleic Acids Res. 2012;40(Database issue):D821–D828. doi: 10.1093/nar/gkr1062. [DOI] [PMC free article] [PubMed] [Google Scholar]
- 9.Lee I, Blom UM, Wang PI, Shim JE, Marcotte EM. Prioritizing candidate disease genes by network-based boosting of genome-wide association data. Genome Res. 2011;21(7):1109–1121. doi: 10.1101/gr.118992.110. [DOI] [PMC free article] [PubMed] [Google Scholar]
- 10.Zhang S-Y, et al. TLR3 immunity to infection in mice and humans. Curr Opin Immunol. 2013 doi: 10.1016/j.coi.2012.11.001. 10.1016/j.coi.2012.11.001. [DOI] [PMC free article] [PubMed] [Google Scholar]
- 11.Zhang SY, et al. TLR3 deficiency in patients with herpes simplex encephalitis. Science. 2007;317(5844):1522–1527. doi: 10.1126/science.1139522. [DOI] [PubMed] [Google Scholar]
- 12.Sancho-Shimizu V, et al. Herpes simplex encephalitis in children with autosomal recessive and dominant TRIF deficiency. J Clin Invest. 2011;121(12):4889–4902. doi: 10.1172/JCI59259. [DOI] [PMC free article] [PubMed] [Google Scholar]
- 13.Guo Y, et al. Herpes simplex virus encephalitis in a patient with complete TLR3 deficiency: TLR3 is otherwise redundant in protective immunity. J Exp Med. 2011;208(10):2083–2098. doi: 10.1084/jem.20101568. [DOI] [PMC free article] [PubMed] [Google Scholar]
- 14.Sancho-Shimizu V, Perez de Diego R, Jouanguy E, Zhang SY, Casanova JL. Inborn errors of anti-viral interferon immunity in humans. Curr Opin Virol. 2011;1(6):487–496. doi: 10.1016/j.coviro.2011.10.016. [DOI] [PMC free article] [PubMed] [Google Scholar]
- 15.von Mering C, et al. STRING: A database of predicted functional associations between proteins. Nucleic Acids Res. 2003;31(1):258–261. doi: 10.1093/nar/gkg034. [DOI] [PMC free article] [PubMed] [Google Scholar]
- 16.Snel B, Lehmann G, Bork P, Huynen MA. STRING: A web-server to retrieve and display the repeatedly occurring neighbourhood of a gene. Nucleic Acids Res. 2000;28(18):3442–3444. doi: 10.1093/nar/28.18.3442. [DOI] [PMC free article] [PubMed] [Google Scholar]
- 17.Pérez de Diego R, et al. Human TRAF3 adaptor molecule deficiency leads to impaired Toll-like receptor 3 response and susceptibility to herpes simplex encephalitis. Immunity. 2010;33(3):400–411. doi: 10.1016/j.immuni.2010.08.014. [DOI] [PMC free article] [PubMed] [Google Scholar]
- 18.Casrouge A, et al. Herpes simplex virus encephalitis in human UNC-93B deficiency. Science. 2006;314(5797):308–312. doi: 10.1126/science.1128346. [DOI] [PubMed] [Google Scholar]
- 19.Herman M, et al. Heterozygous TBK1 mutations impair TLR3 immunity and underlie herpes simplex encephalitis of childhood. J Exp Med. 2012;209(9):1567–1582. doi: 10.1084/jem.20111316. [DOI] [PMC free article] [PubMed] [Google Scholar]
- 20.Lafaille FG, et al. Impaired intrinsic immunity to HSV-1 in human iPSC-derived TLR3-deficient CNS cells. Nature. 2012;491(7426):769–773. doi: 10.1038/nature11583. [DOI] [PMC free article] [PubMed] [Google Scholar]
- 21.Chariot A, et al. Association of the adaptor TANK with the I kappa B kinase (IKK) regulator NEMO connects IKK complexes with IKK epsilon and TBK1 kinases. J Biol Chem. 2002;277(40):37029–37036. doi: 10.1074/jbc.M205069200. [DOI] [PubMed] [Google Scholar]
- 22.Yamashita M, et al. Epidermal growth factor receptor is essential for Toll-like receptor 3 signaling. Sci Signal. 2012;5(233):ra50. doi: 10.1126/scisignal.2002581. [DOI] [PMC free article] [PubMed] [Google Scholar]
- 23.Paradis E, Claude J, Strimmer K. APE: Analyses of phylogenetics and evolution in R language. Bioinformatics. 2004;20(2):289–290. doi: 10.1093/bioinformatics/btg412. [DOI] [PubMed] [Google Scholar]
- 24.Dijkstra EW. A note on two problems in connexion with graphs. Numerische Mathematlk. 1959;1:269–271. [Google Scholar]
- 25.Hagberg AA, Schult DA, Swart PJ. Exploring network structure, dynamics, and function using NetworkX. In: Varoquaux G, Vaught T, Millman J, editors. Proceedings of the 7th Python in Science Conference (SciPy2008) 2008. pp. 11–15. [Google Scholar]
- 26.Young MD, Wakefield MJ, Smyth GK, Oshlack A. Gene ontology analysis for RNA-seq: Accounting for selection bias. Genome Biol. 2010;11(2):R14. doi: 10.1186/gb-2010-11-2-r14. [DOI] [PMC free article] [PubMed] [Google Scholar]
- 27.Robinson MD, McCarthy DJ, Smyth GK. edgeR: A bioconductor package for differential expression analysis of digital gene expression data. Bioinformatics. 2010;26(1):139–140. doi: 10.1093/bioinformatics/btp616. [DOI] [PMC free article] [PubMed] [Google Scholar]
- 28.Muona A. Collagen Genes. Type XV Collagen: Complete Structures of the Human COL15A1 and Mouse Col15a1 Genes, Location of Type XV Collagen Protein in Mature and Developing Mouse Tissues, and Generation of Mice Expressing Truncated Type XV Collagen, Acta Universitatis Ouluensis: Series D, Medica. Vol 662. Oulu, Finland: Oulu Univ Press; 2001. [Google Scholar]
- 29.Narcisi P, Richards AJ, Ferguson SD, Pope FM. A family with Ehlers-Danlos syndrome type III/articular hypermobility syndrome has a glycine 637 to serine substitution in type III collagen. Hum Mol Genet. 1994;3(9):1617–1620. doi: 10.1093/hmg/3.9.1617. [DOI] [PubMed] [Google Scholar]
- 30.Zweers MC, et al. Haploinsufficiency of TNXB is associated with hypermobility type of Ehlers-Danlos syndrome. Am J Hum Genet. 2003;73(1):214–217. doi: 10.1086/376564. [DOI] [PMC free article] [PubMed] [Google Scholar]
- 31.Burrows NP, et al. The gene encoding collagen alpha1(V)(COL5A1) is linked to mixed Ehlers-Danlos syndrome type I/II. J Invest Dermatol. 1996;106(6):1273–1276. doi: 10.1111/1523-1747.ep12348978. [DOI] [PubMed] [Google Scholar]
- 32.Nuytinck L, et al. Classical Ehlers-Danlos syndrome caused by a mutation in type I collagen. Am J Hum Genet. 2000;66(4):1398–1402. doi: 10.1086/302859. [DOI] [PMC free article] [PubMed] [Google Scholar]
- 33.Steinmann B, et al. Evidence for a structural mutation of procollagen type I in a patient with the Ehlers-Danlos syndrome type VII. J Biol Chem. 1980;255(18):8887–8893. [PubMed] [Google Scholar]
- 34.Matsunaga T. Value of genetic testing in the otological approach for sensorineural hearing loss. Keio J Med. 2009;58(4):216–222. doi: 10.2302/kjm.58.216. [DOI] [PubMed] [Google Scholar]
- 35.Ashburner M, et al. The Gene Ontology Consortium Gene ontology: Tool for the unification of biology. Nat Genet. 2000;25(1):25–29. doi: 10.1038/75556. [DOI] [PMC free article] [PubMed] [Google Scholar]
- 36.Berman HM, et al. The Protein Data Bank. Nucleic Acids Res. 2000;28(1):235–242. doi: 10.1093/nar/28.1.235. [DOI] [PMC free article] [PubMed] [Google Scholar]
- 37.Licata L, et al. MINT, the molecular interaction database: 2012 update. Nucleic Acids Res. 2012;40(Database issue):D857–D861. doi: 10.1093/nar/gkr930. [DOI] [PMC free article] [PubMed] [Google Scholar]
- 38.Matthews L, et al. Reactome knowledgebase of human biological pathways and processes. Nucleic Acids Res. 2009;37(Database issue):D619–D622. doi: 10.1093/nar/gkn863. [DOI] [PMC free article] [PubMed] [Google Scholar]
- 39.Kanehisa M, Goto S. KEGG: Kyoto encyclopedia of genes and genomes. Nucleic Acids Res. 2000;28(1):27–30. doi: 10.1093/nar/28.1.27. [DOI] [PMC free article] [PubMed] [Google Scholar]
- 40.Kanehisa M, Goto S, Sato Y, Furumichi M, Tanabe M. KEGG for integration and interpretation of large-scale molecular data sets. Nucleic Acids Res. 2012;40(Database issue):D109–D114. doi: 10.1093/nar/gkr988. [DOI] [PMC free article] [PubMed] [Google Scholar]
- 41.Fruchterman TMJ, Reingold EM. Graph drawing by force-directed placement. Softw Pract Exper. 1991;21(11):1129–1164. [Google Scholar]
- 42.Itan Y, Bryson K, Thomas MG. Detecting gene duplications in the human lineage. Ann Hum Genet. 2010;74(6):555–565. doi: 10.1111/j.1469-1809.2010.00609.x. [DOI] [PubMed] [Google Scholar]
- 43.Travers J, Milgram S. An experimental study of the small world problem. Sociometry. 1969;32(4):425–443. [Google Scholar]
Associated Data
This section collects any data citations, data availability statements, or supplementary materials included in this article.