

Abstract
Our ability to regulate behavior based on past experience has thus far been examined using single movements. However, natural behavior typically involves a sequence of movements. Here, we examined the effect of previous trial type on the concurrent planning of sequential saccades using a unique paradigm. The task consisted of two trial types: no-shift trials, which implicitly encouraged the concurrent preparation of the second saccade in a subsequent trial; and target-shift trials, which implicitly discouraged the same in the next trial. Using the intersaccadic interval as an index of concurrent planning, we found evidence for context-based preparation of sequential saccades. We also used functional MRI-guided, single-pulse, transcranial magnetic stimulation on human subjects to test the role of the supplementary eye field (SEF) in the proactive control of sequential eye movements. Results showed that (i) stimulating the SEF in the previous trial disrupted the previous trial type-based preparation of the second saccade in the nonstimulated current trial, (ii) stimulating the SEF in the current trial rectified the disruptive effect caused by stimulation in the previous trial, and (iii) stimulating the SEF facilitated the preparation of second saccades based on previous trial type even when the previous trial was not stimulated. Taken together, we show how the human SEF is causally involved in proactive preparation of sequential saccades.
Keywords: performance monitoring, delayed saccade double-step task, oculomotor, parallel programming, cognitive control
The medial frontal cortex has previously been implicated in our ability to regulate behavior based on past experience. For example, in the case of eye movements, the supplementary eye fields (SEFs) are involved in preparing a saccade in a given trial taking into account information related to preceding trials (1–3). Such contextual control is pivotal in generating optimal responses in a dynamically changing environment and may derive from signals that are sensitive to conflict or errors in previous trials (1–11). Although studies centered on proactive control have so far focused on the regulation of single movements or simple responses, natural behavior typically involves the execution of multiple movements in a sequence. Using a modified version of the classic double-step paradigm called the delayed saccade double-step task, we tested the role of previous trial type in modulating the concurrent planning of sequential eye movements (experiment 1). Also, using functional MRI (fMRI)-guided, single-pulse, transcranial magnetic stimulation (TMS), we investigated the role of SEF in the proactive planning of sequential saccades (experiment 2) i.e., whether the SEF is causally involved in embedding contextual information about the previous trial for the preparation of future sequential movements. In the process, we attempt to provide a link between apparently diverse functions of the SEF, such as planning of saccade sequences (12, 13) and conflict monitoring (1–3).
The delayed saccade double-step task differs from the classic double-step task in that the two targets, once presented, remain on the screen until the end of the trial, and participants were required to wait for the fixation spot to disappear before making the first eye movement. Critically, the task also required a sequence of two saccades to be performed in two randomly interleaved trial types. In no-shift trials (Fig. 1A), two targets (green followed by red) were presented in rapid succession while participants fixated on the central box. Participants were instructed to make sequential saccades to the targets in their order of appearance as soon as the fixation spot disappeared. The two targets did not change their positions once they were presented. In target-shift trials (Fig. 1C), however, the second target stepped to a new location during the first saccade. Participants occasionally made second saccades to the old position of the final target in these trials, consistent with the idea of concurrent planning of the second saccade along with the first saccade (14, 15). Importantly, we scored target-shift trials as correct via auditory feedback only when the second saccade foveated the new position of the final target. This manipulation served to discourage parallel programming of the second saccade in trials following a target-shift trial because the concurrent preparation would increase the likelihood of an erroneous saccade toward the old position of the final target. Thus, by regulating the feedback for second saccades in target-shift trials, we assessed whether greater concurrent planning of second saccades occurs in a trial preceded by a no-shift trial compared with a trial preceded by a target-shift trial.
Fig. 1.

Delayed saccade double-step task. (A) Temporal sequence of events in a no-shift trial. Following fixation on a white box at the center of the screen, an initial green target was presented at any one of the four diagonal locations on the screen (B). After a random target step delay (TSD) of 20–200 ms, a final red target was presented at any one of the three remaining locations (illustrated to be in the hemifield opposite that of the initial target in this case) at the same eccentricity (12°). Participants fixated until the white box at the center disappeared (hold-time of ∼1 s), signaling the first and second saccades to the green and red targets, respectively. (Right) Dotted lines with an arrowhead show the sequence of correct responses. (B) Possible locations of the initial target at polar angles of 45°, 135°, 225°, or 315° with respect to the fixation box. (C) Temporal sequence of events in a target-shift trial. (Upper) Following fixation, the initial green target and the final red target were presented just as in a no-shift trial and participants were instructed to maintain fixation during the hold-time. During the execution of the first saccade (solid line with arrowhead), the final target disappeared from its original location and appeared at a new location (but at the same eccentricity). (Lower) Starting from the beginning of the trial (denoted by a solid, black vertical line), gray lines indicate (by means of a jump from baseline in the respective horizontal trace) the appearance of the fixation box, initial target, final target, horizontal and vertical components of the first saccade, and shift of the final target during the first saccade. Note that the trace for the final target goes down only after the horizontal and vertical components of the first saccade have changed from the baseline (i.e., during the execution of the first saccade). At the same time, the trace for the shift in the final target goes up. A single pulse of TMS (purple flash symbol) was triggered randomly at any one of the four time points (−10 ms, +5 ms, +15 ms, and +25 ms) with respect to the presentation of the final target in experiment 2. (D) Shifted “new” location of the final target was always at a polar angle of either 0° or 180° from the fixation box, corresponding to the hemifield of the original “old” final target location (an unfilled red square shows the possible old positions of the final target in a given trial, and a filled red square shows the new final target location in that trial). (E) Solid lines with arrowheads show two kinds of saccadic responses in a target-shift trial: when the second saccade goes to the new position of the final target (Upper) and when it goes to the original old final target location (Lower). Only the second saccades to the new final target location were scored as correct by auditory feedback.
Performance in a given trial was examined as a function of previous trial type using a parameter that has previously been shown to vary systematically with the reprocessing time (RPT), which is the time available for concurrent preparation of two saccades (14–18). Intersaccadic interval (ISI), defined as the time between the end of the first saccade and the beginning of the second saccade, has been shown to decrease with increasing concurrent preparation of two saccades (14–18). Thus, we hypothesized that if concurrent planning of sequential saccades is indeed affected by previous trial type, the ISI of a given no-shift trial should be shorter when preceded by a no-shift trial compared with when preceded by a target-shift trial.
To quantify the relative change in the value of a variable (e.g., ISI) as a function of previous trial type, we computed a proactive planning index (PPI) for each participant by two methods. Whereas PPI 1 (given by Eq. 1) was estimated using only the mean ISI of no-shift trials that were preceded by either a target-shift (TS) trial or a no-shift (NS) trial, PPI 2 (given by Eq. 2) also took into account the inherent variability in the ISI across these trials for each participant (19):
where,
and SSE stands for the sum of squared errors calculated by adding squared errors (difference of each observation from the group mean) of both groups of no-shift trials, whereas N denotes the total number of observations. Because the numerator in the calculation of both indices is (TS − NS), if the mean ISI of no-shift trials is indeed longer when preceded by a target-shift trial than when preceded by a no-shift trial, the indices should have a positive value. In contrast, if a previous trial has no such effect or has an opposite effect on the second saccade preparation of a subsequent trial, the indices should be zero or negative, respectively.
Results
ISI as a Measure of Concurrent Saccade Planning.
The slope of the ISI vs. RPT is often used as an explicit measure of concurrent planning of sequential saccades (14–18). Such a measure of RPT, however, is absent in the context of a delayed saccade task in which the second saccade may be concurrently planned along with the first saccade at any point during the hold-time (i.e., the time between the presentation of the initial target and the disappearance of fixation spot). We therefore used the distribution of second saccade end points as a proxy of concurrent planning. We have previously reported that the end-point locations of second saccades in target-shift trials vary systematically with RPT, such that the greater the degree of concurrent preparation, the closer the second saccade end points are to the old location of the final target (15). Accordingly, using data from experiment 1, we classified second saccades of target-shift trials based on whether they ended at the old position of the final target (Fig. 2A), new position of the final target (Fig. 2B), or somewhere midway between the two locations (known as midway saccades; Fig. 2C) based on the criteria described in Methods. The mean ISI for each group of trials was separately computed (the mean ISI of all target-shift trials pooled together across all 10 subjects was 278 ± 39 ms and the mean ISI for all no-shift trials across all 10 subjects was 253 ± 32.7 ms). If the ISI indeed reflected the extent of second saccade preparation in our task, saccades directed to the old location of the final target, representing cases in which concurrent second saccade planning had proceeded to such an extent that it could not be countermanded by new visual information, should have shorter ISIs. On the other hand, second saccades to the new final target location, representing cases wherein concurrent second saccade planning was nascent enough to be cancelled/modified by new visual information, should have longer ISIs (15). The mean ISI for each of the three groups of trials for each of the 10 subjects was used to perform one-way repeated measures ANOVA. Because the data violated the assumption of sphericity [Mauchly’s test: χ2(2) = 8.99, P < 0.05], a Greenhouse–Geisser correction was made to the degrees of freedom for testing the F statistic for significance. The ISI of target-shift trials was significantly different for second saccades reaching the old location, new location, or midway between the two locations of the final target [F(1.2, 10.8) = 19.53, P < 0.001]. Pairwise t tests done post hoc using a Bonferroni-corrected α-level of 0.017 showed that the mean ISI of second saccades to the old final target location (mean ± SEM, ISI: 153 ± 11 ms) was significantly shorter than that of second saccades to the new final target location (306 ± 41.3 ms; P = 0.0005) as well as saccades that were midway between the two locations (220 ± 20.1 ms; P = 0.0002). Also, the ISI of second saccades to midway locations was significantly shorter than that of second saccades to the new final target location (P = 0.004). Similar results were obtained when the mean second saccade reaction time (RT), defined as the time between the disappearance of the fixation spot and the onset of the second saccade, was compared across each of the three groups of target-shift trials for all 10 subjects (details are provided in Second Saccade RT as a Measure of Concurrent Saccade Planning). Overall, these results are consistent with the idea of the ISI being a reliable indicator of the extent of concurrent planning of second saccades occurring in a given trial. We therefore used the change in ISI as a function of previous trial type (as computed by Eqs. 1 and 2) to study the role of proactive control in planning of sequential saccades.
Fig. 2.
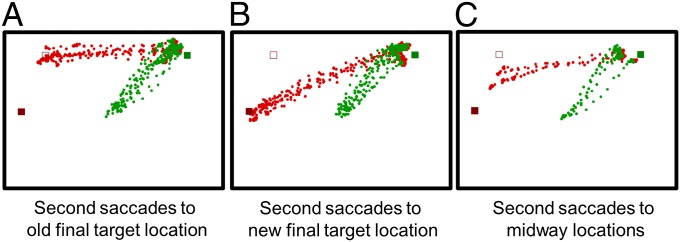
Behavioral illustration of second saccades in a sample of target-shift trials for a representative subject (G.S.). Second saccades were classified to have reached the old location of the final target (A), new location of the final target (B), and midway between the two locations of the final target (C) based on the criteria described in Methods.
Effect of Previous Trial Type on ISI of No-Shift Trials.
To test whether target-shift trials implicitly discourage concurrent planning in the subsequent trial, we used data from experiment 1 and examined the ISI of no-shift trials when they were preceded by a target-shift trial vs. a no-shift trial (Fig. S1A and Tables S1 and S2). In congruence with the notion of the second saccades being proactively planned, we observed that the mean ISI was longer for no-shift trials that were preceded by a target-shift trial (pTS) compared with those preceded by a no-shift trial (pNS) in 9 of 10 subjects [one-tailed, pairwise t test; mean ± SEM: ISI pTS = 259 ± 34.8 ms, ISI pNS = 245 ± 31.7 ms; ISI (pTS > pNS): n = 10, P = 0.003]. The PPI was also calculated for all 10 subjects using Eqs. 1 and 2. We found both PPI 1 and PPI 2 to be significantly greater than zero [Fig. 3A; mean ± SEM: PPI 1 = 0.02 ± 0.01, PPI 2 = 0.07 ± 0.02; one-tailed, one-sample t test (PPI 1 > 0): n = 10, P = 0.003; (PPI 2 > 0): n = 10, P = 0.002]. We also calculated PPI 1 and PPI 2 using the median (instead of the mean) ISI of no-shift trials in Eqs. 1 and 2, respectively, and found them to be significantly positive as well [mean ± SEM: PPI 1 = 0.02 ± 0.01; PPI 2 = 0.06 ± 0.03; one tailed, one-sample t test: (PPI 1 > 0): n = 10, P = 0.03; (PPI 2 > 0): n = 10, P = 0.02].
Fig. 3.

Effect of previous trial type on no-shift trials of experiment 1. (A) Bar graphs of the PPI calculated using the ISI of no-shift trials in Eqs. 1 and 2 (details are provided in main text). (B) Bar graphs of PPI 1 and PPI 2 calculated using the first saccade RTs (RT1) of no-shift trials. An asterisk denotes a significant difference in Bonferroni-corrected tests. Error bars indicate mean ± SEM.
We tested if proactive control in the delayed saccade double-step task (experiment 1) was specific to the planning of the second saccade or occurred for the first saccade as well. A measure of proactive planning, PPI, was estimated using first saccade RTs of no-shift trials (defined as the time between the disappearance of the fixation spot and the onset of the first saccade) in Eqs. 1 and 2. We found no context-dependent differences in the RTs of first saccades [Fig. 3B; mean ± SEM: PPI 1 = 0.001 ± 0.01, PPI 2 = −0.0002 ± 0.03; two-tailed, one-sample t test: (PPI 1, 0): n = 10, P = 0.88; (PPI 2, 0): n = 10, P = 0.99]. On the other hand, second saccade RTs of no-shift trials, like the ISI, varied significantly as a function of previous trial type, resulting in positive PPI values [mean ± SEM: PPI 1 = 0.01 ± 0.004, PPI 2 = 0.06 ± 0.02; one-tailed, one-sample t test: (PPI 1 > 0): n = 10, P = 0.0048; (PPI 2 > 0): n = 10, P = 0.004]. Overall, these results suggest that previous trial type indeed has a significant and specific effect on the concurrent planning of second saccades as indexed by the ISI and second saccade RTs on a given trial.
Effect of Stimulation on the ISI of No-Shift Trials.
To understand the neural mechanisms underlying proactive planning of sequential saccades, we performed experiment 2, in which single-pulse TMS was applied to a separate set of 10 participants while they performed the delayed saccade double-step task. For each participant, the SEF and vertex were stimulated on separate sessions as described in Methods (Fig. 4). The effect of previous trial type on the planning of second saccades was then compared between the two stimulation conditions, SEF vs. vertex. First, the PPI was estimated (using Eqs. 1 and 2) for the ISI of nonstimulated, no-shift trials when preceded by a target-shift trial (note: target-shift trials were always stimulated in experiment 2) vs. a stimulated no-shift trial. Consistent with the notion that proactive control of sequential saccades was affected by stimulating SEF in the previous trial, we found a significant difference between the values of both PPI 1 and PPI 2 in the TMS on SEF vs. vertex conditions [Fig. 5A; two-tailed, pairwise t test using Bonferroni-corrected α-level = 0.025; mean ± SEM: PPI 1 (vertex) = 0.02 ± 0.01, PPI 1 (SEF) = −0.01 ± 0.006; PPI 1 (vertex, SEF): n = 10, P = 0.017; PPI 2 (vertex) = 0.06 ± 0.03, PPI 2 (SEF) = −0.05 ± 0.02; PPI 2 (vertex, SEF): n = 10, P = 0.015]. On the other hand, when PPI values were estimated and compared for the ISI of stimulated no-shift trials preceded by a target-shift trial vs. a stimulated no-shift trial, they were not found to be statistically different across the TMS on SEF and vertex conditions [Fig. 5B; two tailed, pairwise t test using Bonferroni-corrected α-level = 0.025; mean ± SEM: PPI 1 (vertex) = 0.03 ± 0.01; PPI 1 (SEF) = 0.03 ± 0.01, PPI 1 (vertex, SEF): n= 10, P = 0.92; PPI 2 (vertex) = 0.09 ± 0.04; PPI 2 (SEF) = 0.07 ± 0.03, PPI 2 (vertex, SEF): n = 10, P = 0.83]. This suggests that while SEF stimulation in the previous trial disturbed the proactive control of second saccade preparation in a nonstimulated, no-shift trial compared with the control condition, stimulation in the current trial could rectify this effect.
Fig. 4.

(A) Three-dimensional rendering of the brain in MNI space shows the SEF target (blue), its superficial extrapolation to the surface (green), and the fMRI localizer task activation map (red) for a representative participant (M.K.). (B) SEF coordinates (in MNI space) for each participant (green) and the average location of the vertex (red) used for TMS are shown.
Fig. 5.

Effect of SEF stimulation on the ISI of no-shift trials when preceded by a target-shift trial vs. a stimulated no-shift trial in experiment 2. (A) Bar graphs of PPI 1 and PPI 2 (details are provided in main text) calculated using the ISI of nonstimulated no-shift trials in the TMS on the vertex (pink) and SEF (blue) conditions. (B) Bar graphs of PPI 1 and PPI 2 calculated using the ISI of stimulated no-shift trials in the TMS on the vertex (pink) and SEF (blue) conditions. PPI values are statistically different between the SEF and vertex conditions only when the previous trial was stimulated and not when both the current and previous trials were stimulated. An asterisk denotes a significant difference in Bonferroni-corrected tests. Error bars indicate mean ± SEM.
Closer examination of the ISI of nonstimulated no-shift trials in experiment 2 (Fig. S2A) revealed that when the vertex was stimulated on the previous trial, the mean ISI of nonstimulated no-shift trials was longer when they were preceded by a target-shift trial compared with when they were preceded by a stimulated no-shift trial for 7 of 10 subjects [one-tailed, pairwise t test using Bonferroni-corrected α-level = 0.025; mean ± SEM: ISI pTS = 260.9 ± 21.7 ms, ISI pNS = 250 ± 20.5 ms; ISI (pTS > pNS): n = 10, P = 0.018]. This is consistent with the results obtained from experiment 1 and reiterates the idea of a target-shift trial implicitly discouraging the concurrent planning of second saccade in a subsequent trial. In contrast, SEF stimulation in the previous trial reversed the context-dependent effect on the ISI of the subsequent nonstimulated, no-shift trial. The mean ISI this time was longer in no-shift trials preceded by a stimulated no-shift trial relative to those preceded by a target-shift trial in 7 of 10 participants. Interestingly, the mechanism through which the reversal was brought about was quite heterogeneous. In 3 of 7 participants, the reversal involved an increase in the mean no-shift ISI and a decrease in the mean target-shift ISI; in 2 of 7 subjects, there was an increase in both mean target-shift and mean no-shift ISI; and in the remaining 2 of 7 subjects, both mean target-shift and mean no-shift ISI had decreased. Despite such heterogeneity, the net effect of SEF stimulation in the previous trial was disruptive to the context-based concurrent preparation of second saccades [one-tailed, pairwise t test using Bonferroni-corrected α-level = 0.025; mean ± SEM: ISI pTS = 246.8 ± 20 ms, ISI pNS = 255.3 ± 22.5 ms; ISI (pTS > pNS): n = 10, P = 0.97]. In short, these results are consistent with the idea of previous trial stimulation on SEF affecting proactive control over concurrent preparation of the second saccade in a given, nonstimulated trial relative to the control condition.
To test if SEF stimulation had any effect on how first saccades were planned as a function of previous trial type, the PPI was calculated using first saccade RTs of both nonstimulated and stimulated no-shift trials in experiment 2 (Fig. S3 A and B). The corresponding PPI indicated the change in first saccade RTs when preceded by a target-shift trial vs. a stimulated no-shift trial. There was no significant difference between the values of both PPI 1 and PPI 2 in the TMS on SEF vs. vertex conditions for nonstimulated no-shift trials [two-tailed, pairwise t test using Bonferroni-corrected α-level = 0.025; mean ± SEM: PPI 1 (vertex) = 0.01 ± 0.01, PPI 1 (SEF) = 0.002 ± 0.008, PPI 1 (vertex, SEF): n = 10, P = 0.48; PPI 2 (vertex) = 0.04 ± 0.02, PPI 2 (SEF) = 0.01 ± 0.02, PPI 2 (vertex, SEF): n = 10, P = 0.38] as well as for stimulated no-shift trials [two-tailed, pairwise t test using Bonferroni-corrected α-level = 0.025; mean ± SEM: PPI 1 (vertex) = 0.002 ± 0.02, PPI 1 (SEF) = 0.01 ± 0.01, PPI 1 (vertex, SEF): n = 10, P = 0.61; PPI 2 (vertex) = −0.002 ± 0.04, PPI 2 (SEF) = 0.02 ± 0.03, PPI 2 (vertex, SEF): n = 10, P = 0.51]. These results suggest that SEF stimulation specifically affected the concurrent planning of the second, and not the first, saccade, as a function of the previous trial type.
Effect of Stimulation on the End Points of Midway Saccades.
Because the location of second saccade end points has been shown to be a proxy of concurrent saccade planning (15), we examined if it would be sensitive to proactive control as well. Considering that stimulation in the current trial could reverse the disruption in proactive control caused by previous trial stimulation, midway saccades in target-shift trials (being always stimulated) were hypothesized to end closer to the old location of the final target when preceded by a stimulated no-shift trial compared with a target-shift trial. We computed the distance of midway saccade end points from their corresponding old final target locations when preceded by a target-shift trial vs. a no-shift trial. Because the shift from the old to the new final target location was always designed to be vertical, the vertical distances between the midway saccade end points and their respective old final target positions in all four quadrants of the screen were pooled to arrive at the median distance for each participant. Fig. 6A shows the box-plot representing the vertical distances of midway saccade end points from the old final target location when preceded by a stimulated no-shift trial and a target-shift trial for a representative participant (W.A.). Fig. 6B shows the spread of median distances of midway saccade end points from the old final target location across nine participants. Data from one participant (P.M.) could not be used in this analysis because of lack of sufficient number of trials in each condition. The median distance of midway saccade end points from the old target was found to be greater following a target-shift trial vs. a stimulated no-shift trial in the TMS on the SEF condition [Fig. 6C; one-tailed, pairwise t test using Bonferroni-corrected α-level = 0.0125; mean ± SEM: difference in median distance (pTS − pNS) = 0.56 ± 0.2°; median distance (pTS − pNS > 0): n = 9, P = 0.011], but not in the vertex condition [Fig. 6C; one-tailed, pairwise t test using Bonferroni-corrected α-level = 0.0125; mean ± SEM: difference in median distance (pTS − pNS) = −0.16 ± 0.25°; median distance (pTS − pNS > 0): n = 9, P = 0.73]. On closer inspection, the end-point location of midway saccades following a stimulated no-shift trial was found to be significantly different in the TMS on the SEF condition compared with the TMS on the vertex condition [Fig. 6B; two-tailed, pairwise t test using Bonferroni-corrected α-level = 0.0125; mean ± SEM: median distance, pNS (vertex) = 5 ± 0.3°, pNS (SEF) = 4.2 ± 0.2°; median distance pNS (vertex, SEF): n = 9, P = 0.009]. The median distances of midway saccade end points following a target-shift trial were not statistically different across the two stimulated brain regions [Fig. 6B; two-tailed, pairwise sample t test using Bonferroni-corrected α-level = 0.0125; mean ± SEM: median distance, pTS (vertex) = 4.8 ± 0.3°, pTS (SEF) = 4.8 ± 0.2°; median distance pTS (vertex, SEF): n = 9, P = 0.93]. Overall, these results concur with the ISI results reported earlier, suggesting operational proactive control over the planning of two saccades when both the previous trial and the current trial were stimulated. In fact, compared with the control condition, SEF stimulation in the current trial was found to facilitate proactive control over planning of sequential saccades.
Fig. 6.

Effect of current trial SEF stimulation on the end points of midway saccades in target-shift trials. (A) Box-plots of the vertical distances of midway saccade end points when preceded by a target-shift trial (pTS, violet) and a stimulated no-shift trial (pNS, green) for a representative participant (W.A.) in the TMS on the vertex (left pair of box-plots) and SEF (right pair of box-plots) conditions. Box-plots represent the median (central mark), the 25th and 75th percentiles (edges of the box) of the data, the range of data points (whiskers), and the outliers (+). Dashed pink and solid blue horizontal lines, respectively, represent the vertical coordinates of the old and the new positions of the final target. (B) Box-plots of the spread of the median distances for nine participants in the TMS on the vertex (left pair of box-plots) and the SEF (right pair of box-plots) conditions. (C) The differences between the median distances of pTS and pNS for all nine participants in the TMS on the SEF (blue) and vertex (pink) conditions. (D) Bar graphs of PPI 1 and PPI 2 using the median distances of midway saccade end points in the TMS on the SEF (blue) and vertex (pink) conditions. An asterisk denotes a significant difference in Bonferroni-corrected tests. Error bars indicate mean ± SEM.
These results were also confirmed by computing the PPI using the median distance of midway saccade end points in Eqs. 1 and 2 (instead of the mean distance) for trials preceded by a target-shift trial vs. a stimulated no-shift trial (Fig. 6D). Consistent with the results obtained above, the PPI of end-point distance was significantly greater in the TMS on the SEF condition compared with the control condition, suggesting the SEF’s role in greater concurrent planning of second saccades following a no-shift trial relative to a target-shift trial [one-tailed, pairwise t test: mean ± SEM: PPI 1 (SEF) = 0.06 ± 0.02, PPI 1 (vertex) = −0.02 ± 0.03; PPI 1 (SEF > vertex): n = 9, P = 0.01; PPI 2 (SEF) = 0.16 ± 0.05, PPI 2 (vertex) = −0.05 ± 0.09; PPI 2 (SEF > vertex): n = 9, P = 0.04]. We also estimated the PPI values using the mean distance of midway saccade end points from their corresponding old final target locations in Eqs. 1 and 2 and obtained similar results [one-tailed, pairwise t test: mean ± SEM: PPI 1 (SEF) = 0.04 ± 0.01, PPI 1 (vertex) = −0.007 ± 0.01; PPI 1 (SEF > vertex): n = 9, P = 0.01; PPI 2 (SEF) = 0.13 ± 0.03, PPI 2 (vertex) = −0.03 ± 0.06; PPI 2 (SEF > vertex): n = 9, P = 0.04]. Overall, these results confirm that SEF stimulation in the current trial as well as in the previous trial facilitated the trial history-based concurrent preparation of second saccades compared with the control condition.
We also validated these findings by doing the above analysis on the data from experiment 1. Interestingly, the previous trial type had no observable effect on the end points of midway saccades in this case as well, just as in the TMS on the vertex condition. The median distance of midway saccade end points was not significantly greater when preceded by a target-shift trial than when preceded by a no-shift trial [one-tailed, pairwise t test: mean ± SEM, median distance, pTS = 4.5 ± 0.2°, pNS = 4.4 ± 0.25°; median distance (pTS > pNS): n = 10, P = 0.36]. Also, the average PPI across subjects for the median distances of midway saccade end points was not significantly greater than zero [mean ± SEM, PPI 1 = 0.01 ± 0.03, PPI 2 = 0.04 ± 0.1; one-tailed, one sample t test (PPI 1 > 0): n = 10, P = 0.33; (PPI 2 > 0): n = 10, P = 0.33]. These results are consistent with the idea of vertex stimulation being a reliable behavioral control for TMS.
We also tested if SEF stimulation affected the frequency of second saccades to the old or new location of the final target as a function of previous trial type. We hypothesized that owing to greater concurrent preparation, we should observe more second saccades to the old final target location (or fewer to the new location of the final target) following a no-shift trial vs. a target-shift trial. Because trials with second saccades to the old location of the final target were too few across participants for comparison, we looked at the percentage of second saccades to the new location of the final target following a target-shift trial vs. a no-shift trial. There was no significant difference in the percentage of second saccades to the new final target location following a target-shift trial vs. a stimulated no-shift trial, both in the TMS on the SEF condition [one-tailed, pairwise t test using Bonferroni-corrected α-level = 0.025; mean ± SEM, percentage new, pTS = 64 ± 7, pNS = 62 ± 7; percentage new (pTS > pNS): n = 10, P = 0.28] and in the TMS on the vertex condition [one-tailed, pairwise t test using Bonferroni-corrected α-level = 0.025; mean ± SEM: percentage new, pTS = 73 ± 7, pNS = 69 ± 8; percentage new (pTS > pNS): n= 10, P = 0.048]. The same was true for the data from experiment 1 as well [one-tailed, pairwise t test: mean ± SEM; percentage new, pTS = 66 ± 6, pNS = 66 ± 8; percentage new (pTS > pNS): n = 10, P = 0.55]. This suggests that the frequency of second saccades to the new locations of the final target was not significantly affected by the previous trial type.
Effect of Stimulation in the Current Trial.
Because stimulation in the current trial could rectify the effect of previous trial stimulation on the ISI of no-shift trials (Fig. 5B), TMS in the current trial was hypothesized to have a significant independent effect on the proactive control of sequential saccades. We investigated this by analyzing the end points of midway saccades as well as the ISI of stimulated no-shift trials that were preceded by a nonstimulated no-shift trial (because all target-shift trials in the task were stimulated). Consistent with our previous results (Fig. 6B), midway saccades preceded by a nonstimulated no-shift trial were found to end significantly closer to the old location of the final target when the SEF was stimulated in the current trial compared with the vertex [one-tailed, pairwise t test; mean ± SEM: median distance, pNS (vertex) = 5.1 ± 0.2°, pNS (SEF) = 4.4 ± 0.3°; median distance pNS (vertex > SEF): n = 10, P = 0.004]. Similarly, the mean ISI of stimulated no-shift trials that were preceded by a nonstimulated no-shift trial was significantly shorter in the TMS on the SEF condition compared with the control condition [one-tailed, pairwise t test; mean ± SEM: ISI, pNS (vertex) = 268 ± 21 ms, pNS (SEF) = 249 ± 22 ms; ISI pNS (vertex > SEF): n = 10, P = 0.04]. These results suggest that stimulating the SEF vs. the vertex in a given trial enhances proactive control over the preparation of second saccades in that trial even in the absence of stimulation in the previous trial.
Nonspecific Effects of TMS.
We examined the general effects of stimulation on saccade planning by comparing the ISI and first saccade RTs of no-shift trials with and without TMS in experiment 2. Stimulation did not have a significant effect on the mean ISI of no-shift trials in either the vertex [two-tailed, pairwise t test using Bonferroni-corrected α-level = 0.025; mean ± SEM: stimulated ISI = 261.36 ± 19.85 ms, nonstimulated ISI = 255.09 ± 21.31 ms; ISI (stimulated, nonstimulated): n = 10, P = 0.16] or the SEF [two-tailed, pairwise t test using Bonferroni-corrected α-level = 0.025; mean ± SEM: stimulated ISI = 248.7 ± 19.82 ms, nonstimulated ISI = 245.33 ± 20.85 ms; ISI (stimulated, nonstimulated): n = 10, P = 0.22]. On the other hand, the mean first saccade RT of stimulated no-shift trials was significantly different from that of nonstimulated no-shift trials, independent of the site of stimulation [vertex: two-tailed, pairwise t test using Bonferroni-corrected α-level = 0.025; mean ± SEM: stimulated RT1 = 188.01 ± 7.36 ms, nonstimulated RT1 = 207.63 ± 9.91 ms; RT1 (stimulated, nonstimulated): n = 10, P = 0.0004 and SEF: two-tailed, pairwise t test using Bonferroni-corrected α-level = 0.025; mean ± SEM, stimulated RT1 = 197.37 ± 8.86 ms, nonstimulated RT1 = 217.18 ± 10.12 ms; RT1 (stimulated, nonstimulated): n = 10, P = 0.0029]. This suggests that although stimulation reduced the RT of the first saccade, this was true for both the TMS on SEF and vertex conditions.
Discussion
In this study, using a unique paradigm called the delayed saccade double-step task, we provide evidence for proactive control over concurrent planning of sequential saccades. In addition, using fMRI-guided, single-pulse TMS on healthy humans, we show that the human SEF modulates preparation of sequential saccades based on the previous trial type. The effect was not only robust in the temporal domain (in terms of the ISI) but was consistent in the spatial domain (as indicated by midway saccade end points) despite within- and between-subject variability. Specifically, SEF stimulation in the previous trial abolished the context-based second saccade planning in current nonstimulated trials. SEF stimulation in a given trial, however, not only rectified the disruption caused by stimulation in the previous trial but facilitated proactive control over planning of sequential saccades in the absence of previous trial stimulation. We discuss these results below.
Proactive Control of Saccade Sequences.
Proactive control is defined as the modification of a plan or a decision based on previous experience and in anticipation of forthcoming task demands (1–11). It is distinct from reactive control, where an externally presented signal explicitly indicates the required change in plan (16–18). Evidence for the existence of proactive control largely derives from studies using the countermanding task, where performance has been found to be modulated on a trial-to-trial basis depending on the likely occurrence of a stop signal, independent of its actual presence (9). Consistent with the idea of anticipatory control, the mean RT of no-stop signal trials was not only found to be longer in sessions with a stop-signal than in sessions without it (2, 4, 5) but was found to increase systematically with increases in the frequency of the stop signal (6, 7, 10). However, so far proactive control has largely been studied with respect to stopping vs. planning a response. Also, studies on contextual control have been limited to examining single movements. By studying changes in the extent of concurrent saccade planning as a function of previous trial type, we show evidence for proactive control in the preparation of sequential movements. Prior knowledge of the goals in a regular environment is known to allow parallel preparation or chunking of movements in a sequence (20, 21), whereas error or conflict in the previous trial could favor a more cautious approach toward planning (1, 6, 8), slowing down preparation of individual movements. Although the first as well as subsequent movements could be slowed down as a result of such performance monitoring, we found context-dependent changes in the preparation of second saccades, independent of the first saccade. This is critical because chunking of multiple movements is known to be associated with a decrease in intermovement interval, along with a corresponding increase in the RT of the first response (20, 21). Thus, the specificity in the modulation of second saccade planning, as indicated by the ISI results observed in our study, is suggestive of a mechanism in which planning of sequential eye movements may be regulated by previous trial information in parallel yet independent ways.
Stimulation Effects on SEF.
In a recent study, while recording from the SEF of monkeys performing a countermanding task, Stuphorn et al. (3) reported nearly 40% of neurons changing their firing rate, often even before the target for the movement was presented in the current trial, based on the type of previous trial (i.e., a GO vs. STOP trial). In addition, the activity of these neurons, correlated with the RT of saccades produced in the current trial (e.g., in a GO trial following a STOP trial, the activity of a certain set of neurons preferentially increased and corresponded to the longer RTs observed in these trials). It is likely that the proactive control over planning of sequential saccades, as observed in our task, calls on similar sets of neurons that would fire preferentially for triggering or delaying the concurrent preparation of the second saccade depending on whether the previous trial was a no-shift trial or target-shift trial, respectively. Our results on the effects of single-pulse TMS on SEF, as discussed below, are consistent with this hypothesis.
Although the effects of TMS can be either “facilitatory” or “inhibitory” to the performance of the task, depending on the time of stimulation vis-à-vis the state of underlying neuronal activity (22, 23), the physiological effects of single-pulse TMS are largely unknown. So far, the neuronal effect is best understood as an early excitation lasting up to about 500 ms after stimulation followed by a long duration of suppression sometimes exceeding 5 s, as shown by Moliadze et al. (24) in the cat visual cortex. Consistent with this report, we found disruption of proactive control in nonstimulated no-shift trials when the SEF, compared with the vertex, was stimulated in the previous trial on an average of 3.2 ± 0.027 s before the final target appeared in the current trial. Hence, unlike in most studies that have focused on the effect of single-pulse TMS in a current trial, keeping the interpulse interval relatively short in our study gave us the opportunity to test, using the same stimulation protocol, the role of suppressed SEF activity (produced as a delayed TMS effect) on behavior, independent of stimulation effects in the current trial.
In the following, we refer to neurons that would fire more based on the previous trial type as context neurons (Fig. 7, blue bar) and those indifferent to the current context as anticontext neurons (Fig. 7, pink bar), with the difference in their activation levels proportionately deciding the strength of proactive control exhibited in that trial. For example, following a no-shift trial, neurons preferentially firing for triggering the concurrent preparation of the second saccade would be called context neurons, whereas those associated with delaying the concurrent preparation would be termed as anticontext neurons. Similarly, following a target-shift trial, neurons preferentially firing for delaying the concurrent preparation of the second saccade would be called context neurons, whereas those firing for triggering the concurrent preparation would be termed as anticontext neurons. Restoration and/or facilitation of proactive control by TMS on the current trial (Fig. 7 B and C) can be explained by an increased difference in the activity of these two sets of neurons under the assumption that excitation by TMS allows neurons' intrinsic response nonlinearity to amplify any preexisting biases in activity (25). As noted above, disrupted proactive control can be explained by a reduction of bias caused by the long-term inhibitory effects of SEF stimulation in the previous trial (24) (Fig. 7A). In such a scenario, previous trial information may be kept updated via connections with basal ganglia that are known to be involved in integrating context in movement control (26). Nevertheless, until a clear understanding of the effects of TMS on neuronal activity emerges, we acknowledge that our scheme is speculative and that other mechanisms might also explain the dual effects of TMS (22, 23). This notwithstanding, the results in the present study extend the current understanding of the role of SEF in proactive control of single saccades (1–3) to that over the planning of saccade sequences in humans.
Fig. 7.

Hypothesized scheme for the effects of SEF stimulation on the proactive control of sequential saccade planning. In all the panels, excitation (yellow) and inhibition (brown) of SEF neurons are schematically plotted against time for two consecutive trials in the delayed saccade double-step task. Green and red downward-pointing arrows denote the presentation of the initial and final targets, respectively, whereas the violet flash symbol denotes the time of the single-pulse TMS in a given trial. [Insets (baseline and after TMS)] Activity of two sets of SEF neurons before target presentation and after the stimulation in a given trial, respectively, are shown. Bar graphs represent the activity of neurons that would fire more based on the previous trial type [context neurons (blue)] and those that would not [anticontext neurons (pink)]; the difference in their activation levels decided the strength of proactive control exhibited in that trial. (A) Activity of both context and anticontext neurons may be suppressed in the current nonstimulated trial [Right, Inset (baseline)] as a result of the long-term inhibitory effects of SEF stimulation in the previous trial (Left), leading to disrupted proactive control in the current trial. On the other hand, excitation by TMS in the current trial may allow neurons' intrinsic response nonlinearity to amplify any preexisting biases in activity, causing restored [B, Right, Inset (after TMS)] or even enhanced [C, Right, Inset (after TMS)] proactive control in these trials.
Methods
Participants.
Eye movements of 20 healthy human volunteers with normal or corrected to normal vision were recorded with volunteers’ heads stabilized by means of a chin and forehead rest. Behavioral recordings (experiment 1; n = 10; age, mean ± SD: 25.2 ± 1.2 y) were done at the National Brain Research Centre, Manesar, India, and the TMS study (experiment 2; n = 10; age, mean ± SD: 27 ± 4.5 y) was conducted at the University Medical Center Utrecht, The Netherlands, with the approval of the respective Human Ethical Committees of the National Brain Research Centre and the University Medical Center Utrecht. Written informed consent was obtained before inclusion of the participants in both experiments.
General Procedure.
The SEF of each participant was localized by a so-called “localizer” task during fMRI scanning. Individual SEF and vertex coordinates were then used for placing the TMS coil on separate sessions while participants performed the delayed saccade double-step task. We adopted an fMRI-guided procedure for coil placement that has been tested previously, with robust results (27–29). Furthermore, fMRI-guided TMS has recently been shown to yield a significant behavioral effect using a smaller number of participants (as small as n = 5) compared with group sizes required when placing the coil purely based on anatomy in an MRI scan or using the 10/20 EEG cap grid (30).
Imaging.
Imaging was performed on a clinical Philips Achieva 3-T MRI scanner equipped with eight independent receiver sensitivity encoding (SENSE) coils allowing parallel imaging (31). Stimuli were projected (using Presentation software from Neurobehavioral Systems) on a Plexiglas 1m-wide screen placed at a distance of 2 m from the participants and viewed through a mirror mounted on the head coil. One thousand functional T2*-weighted blood oxygenation level-dependent (BOLD) volumes were acquired using a new principles of echo-shifting with a train of observation (PRESTO)-SENSE acquisition scheme [repetition time (TR) = 21.75 ms, echo time (TE) = 32.4 ms, field of view (FOV; anterior/posterior, feet-head, right/left) = 224 × 256 × 128 mm, flip angle = 10°, matrix = 64 × 64 × 32 slices, voxel size = 4 mm isotropic, eight-channel head coil, SENSE factors = 2 and 1.8 (in the left/right and anterior/posterior phase-encoding directions, respectively)] (32). An anatomical T1-weighted scan was acquired (TE/TR = 4.6/9.87 ms, flip angle = 8°, FOV = 224 × 160 × 168 mm, matrix = 256 × 256, slice thickness = 1 mm, slice gap = 0, voxel size = 0.875 × 0.875 × 1 mm) to coregister the functional volumes and for neuronavigation during TMS coil placement (see below).
fMRI Localizer Task and Data Analysis.
The localizer task constituted blocks of intermixed prosaccades and antisaccades interspersed by rest blocks of equal duration. A trial in a task block began with a white fixation cross (size = 1° × 1° of visual angle and line thickness = 0.1° of visual angle) at the center of a black screen, which turned into a colored circle (1° visual angle) after 500 ms. The colored circle remained visible for 400 ms and served as the saccadic cue in each block. A red circle and a blue circle, respectively, instructed participants to make a saccade of equal amplitude either toward (prosaccade) or away (antisaccade) from a peripheral target. After 300 ms, the peripheral target was presented for 800 ms at 3.8° or 14.8° from the center of the screen on either side and participants were instructed to make a saccade as soon as possible. Each task block contained 10 trials and lasted 20 s, after which a rest block of 20 s followed. During the rest block, participants were required to fixate on the central fixation on the screen. This sequence was repeated 12 times for a total duration of 8 min (27–29).
Data were analyzed using SPM5 (www.fil.ion.ucl.ac.uk/spm/spm5.html). Functional scans were realigned to the first image to correct for movement of the head, registered to the T1-weighted anatomical image, and resliced at 4 × 4 × 4 mm. The resulting images were smoothed at FWHM with an 8-mm kernel. The anatomical scan was also segmented using SPM5 segmentation algorithms to create a gray matter probability map, used for cortical rendering during neural navigation (Fig. 4). To detect SEF activation during saccade blocks, a two-regressor general linear model (GLM) model was fit to the functional images per voxel. The first regressor was a boxcar regressor with a block length of 20 s and 20 s between blocks, convolved with the hemodynamic response function (two superimposed gamma functions) to predict BOLD signal changes accurately during saccade blocks. The second regressor was a constant, modeling baseline. The regression coefficients for the first regressor obtained by fitting the GLM to the data were statistically tested against zero for each voxel using a one-sample t test, with a P < 0.05 significance threshold, corrected for multiple comparisons according to random fields theory (33). The native space (unnormalized) coordinates of significantly activated voxels within the left and right SEF of individual subjects were stored for TMS coil guidance.
TMS Coil Placement.
The Magstim Rapid2 (peak magnetic field strength of 3.5–4 T) was used to apply biphasic TMS pulse waveforms to participants through a figure-of-eight coil (70 mm). The right or left motor cortex was stimulated to find the motor threshold for each participant (i.e., the lowest stimulation intensity of the device that can induce a visible twitch in the resting contralateral hand in 5 of 10 trials) (34). TMS pulses were delivered at 110% of the participant’s motor threshold during the behavioral paradigm, which thus took into account the individual differences in cortical electrical conductivity and excitability. A cluster was considered to be part of the SEF when it was near the SEF probability map from the volume of interest BrainMap database (35). Voxels with the maximum T-value in the statistical T-map (in unnormalized individual “native” space) were chosen near the midsagittal plane within the SEF so that the SEFs in both hemispheres could be targeted by TMS. The site of stimulation on each participant’s scalp was determined using our stereotactic fMRI-guided neural navigation software (The Neural Navigator, NeNa 1.5; Brain Science Tools BV, The Netherlands) and a magnetic tracking system (DriveBAY; Ascension Technology) (36). We also stimulated the “vertex” as a control region, defined as the location on the scalp that was the most superior when the participant was sitting upright and looking straight ahead. The neural navigation software was used to adjust the coil at this spot, such that the TMS pulse was mainly directed at the empty space between the two cerebral hemispheres. For stimulation at both locations, the coil was placed tangentially over the scalp, with the handle pointing backward and oriented parallel to the midsagittal plane of each participant’s head. It was maintained on the targeted location for the duration of the session with a hydrostatic arm (Manfrotto) and an elastic strap loosely attached to the back of the participant’s head so as to not cause any discomfort.
Localization of SEF Using the fMRI Localizer Task.
Fig. 4A shows fMRI activation for one participant in the SEF and other areas visible on the medial wall of the cortex during the localizer task. Although not visible in the sagittal view of the medial wall, there was activation in the frontal eye fields as well, both at the cortical surface and within the precentral sulcus. The general pattern of activation has been reported in detail in earlier studies using the exact same scanner, acquisition technique, and localizer task on a larger group (27–29). Fig. 4B depicts the gray matter surface for the same participant in Montreal Neurological Institute (MNI) template space to illustrate the anatomical locations of the maximally activated voxels within SEF for all 10 participants (green spheres), which were subsequently used as targets for TMS. The average MNI-normalized brain coordinates (x, y, and z) for SEF across 10 participants (i.e., after correcting for gross individual brain shape differences and transforming to MNI brain atlas space) were 2, 7, and 66 mm, respectively, and they are consistent with the MNI space coordinates of the human SEF reported in a recent high-resolution fMRI study demonstrating motor, visual, and preparatory set-related activation in the human SEF (37). The red sphere in Fig. 4B is the average vertex location used as the control brain region for TMS.
Recording Setup.
Experiment 1 (without TMS) was run using TEMPO/VIDEOSYNC software (Reflective Computing) that displayed visual stimuli and sampled and stored eye position with other behavioral parameters. Eye position was recorded with an infrared pupil tracker running at 240 Hz (ISCAN Inc.) that interfaced with TEMPO software in real time. The spatial resolution of the system was ∼0.01°, and the saccadic accuracy, as estimated by the SD of saccadic end points across four to five successive trials to single targets presented at all target locations used in the task, was ∼0.7°. All stimuli were presented on a computer screen (15 in with a 60-Hz refresh rate and 640 × 480-pixel resolution) placed 50 cm in front of the participant. Stimuli were calibrated with a Minolta CA-96 colorimeter. Experiment 2 (with TMS) was computer-controlled using Presentation software (Neurobehavioral Systems) that displayed visual stimuli interfaced with an infrared pupil tracker (Eyelink-1000 system; SR Research) for recording and storing eye positions (at 1,000 Hz and a spatial resolution of 0.01°) and triggered the TMS pulse as well. At the start of each session, the eye-tracking system was calibrated and validated by making participants look at nine points in an array covering the computer screen (85 Hz, refresh rate of 1,024 × 768 pixel resolution), which was placed 57 cm in front of the participant. All stimuli were calibrated with a Spectrascan PR650 (Photo Research) colorimeter.
Task and Stimuli.
A modified version of the double-step paradigm called the delayed saccade double-step task was used to examine proactive control in the planning of sequential saccades. The task consisted of two types of trials. In the majority of trials (60% in each session), called no-shift trials (Fig. 1A), following fixation on a white box (0.3° × 0.3°) at the center of the screen, an initial green target (0.5° × 0.5°) was presented at one of the four diagonal positions specified by a radial distance of 12° and polar angles of 45°, 135°, 225°, or 315° from the fixation box (Fig. 1B). Thereafter, following a random delay (known as the target step delay) ranging from 20 to 200 ms, a final red target (0.5° × 0.5°) was presented randomly at any one of the remaining three locations specified earlier. Participants were, however, instructed to maintain fixation until the disappearance of the fixation box at the end of the hold-time (1 s after the initial target presentation) and to foveate the green and red isoluminant targets in the order of their presentation with successive saccades (Fig. 1A, Right).
Interspersed equally and randomly with the no-shift trials were target-shift trials, which constituted the remaining 40% of trials in each session. A typical target-shift trial (Fig. 1C) was identical to a no-shift trial except that the final red target was stepped to a new position during the execution of the first saccade, when visual perception is known to be compromised (38). The shift in the location of the final target occurred midway during the course of the first saccade (on average, 29 ms after saccade onset for the saccade duration of 59 ms in experiment 1 and 32 ms after saccade onset for the saccade duration of 58 ms in experiment 2). Only those trials in which the target shifted strictly during the execution of the first saccade (i.e., after it began but before it ended) were used in the analysis. The “shifted” position of the final target (referred to as the new position of the final target) was always to the horizontal right or left of the fixation box (Fig. 1D), corresponding to the hemifield of the original location of the final target (referred to as the old position of the final target). Because the initial and final targets could be on the same or opposite hemifield, following the final target shift, all three targets could be on the same or the opposite hemifield as well (Fig. 1C illustrates the latter case).
All trials were randomized such that participants could not predict or anticipate a shift in the final target. Participants were instructed to make the first saccade to the green target and then to the red one as soon as possible in all trials. No-shift trials were scored as successful and conveyed to participants by auditory feedback only if following fixation (within an electronic window of 6° × 6° centered on the fixation box) through the hold-time, participants made the first and second saccades to the initial and final targets, respectively, fixating the respective targets within an electronic window of 8° × 6° centered on the targets. In target-shift trials, following the first saccades to initial target, only second saccades to the new position of the final target were scored as correct. This served as the key factor that implicitly shaped the context for concurrent second saccade planning in the subsequent trial by making it more favorable to plan the second saccade after the end of the first saccade. During offline evaluation of participants’ performance, second saccades in target-shift trials were classified as having reached the old or new final target position if the end points of these saccades fell within a window of 10° × 4° centered on the respective targets. Second saccades that were directed to the remaining 8.5° of the total vertical distance between the old and new final target locations were classified as midway saccades. Offline analysis was done using MATLAB (MathWorks). The analog eye position data were smoothened, and blinks were removed. A velocity threshold of 40° per second (experiment 1) and 30° per second (experiment 2) was used to demarcate the beginning and the end of saccades. All blink-perturbed saccades were eliminated from analysis. All statistical tests were done using MATLAB. Data in each condition passed the Lilliefors test for normality, unless specified otherwise.
In the behavioral study, around 600 trials were collected in every session with a 5 to 10 min break between the two halves of the session. Each participant performed two sessions on two different days. Also, for all the analyses aimed at studying the effect of previous trial type on the current trial, the time between the final target presentations in two consecutive trials was always less than 4 s. In the TMS study, the SEF or vertex was stimulated during the hold-time randomly at one of the four time points (i.e., −10, 5, 15, and 25 ms) with respect to the first presentation of the final target. Trials stimulated at different time points were pooled for all analyses. All target-shift trials and a random half of the no-shift trials were stimulated to maximize the number of stimulated probe trials in each session. Thus, a “target-shift” trial always refers to a stimulated target-shift trial in experiment 2. An interval of 659 ± 0.05 ms (grand average ± SEM) was added to the end of the second saccade in every trial before the next trial began. Although the duration between stimulations in two consecutive trials was 3,211 ± 27 ms (mean ± SEM), the time between the stimulation in the previous trial and final target presentation in a nonstimulated no-shift trial was 3,198 ± 27 ms (mean ± SEM). Participants were given some practice trials (∼50) before data were collected. On average, each TMS session lasted for about 30 min, during which time participants performed 400 trials with a 5- to 10-min break between the two halves of the session. Each participant performed four sessions in total, two each for TMS on the SEF and vertex conditions, on different days. The order of the brain region that was stimulated first was counterbalanced across participants.
Supplementary Material
Acknowledgments
We thank Dr. Arjun Ramakrishnan for his valuable input during the discussions leading up to the writing of the manuscript. We also thank the Utrecht University Short Stay Fellowship Program, National Brain Research Centre, and the Department of Biotechnology, Government of India for supporting this work.
Footnotes
The authors declare no conflict of interest.
This article is a PNAS Direct Submission.
See Author Summary on page 5291 (volume 110, number 14).
This article contains supporting information online at www.pnas.org/lookup/suppl/doi:10.1073/pnas.1210492110/-/DCSupplemental.
References
- 1.Husain M, Parton A, Hodgson TL, Mort D, Rees G. Self-control during response conflict by human supplementary eye field. Nat Neurosci. 2003;6(2):117–118. doi: 10.1038/nn1005. [DOI] [PubMed] [Google Scholar]
- 2.Stuphorn V, Schall JD. Executive control of countermanding saccades by the supplementary eye field. Nat Neurosci. 2006;9(7):925–931. doi: 10.1038/nn1714. [DOI] [PubMed] [Google Scholar]
- 3.Stuphorn V, Brown JW, Schall JD. Role of supplementary eye field in saccade initiation: Executive, not direct, control. J Neurophysiol. 2010;103(2):801–816. doi: 10.1152/jn.00221.2009. [DOI] [PMC free article] [PubMed] [Google Scholar]
- 4.Verbruggen F, Liefooghe B, Vandierendonck A. The interaction between stop signal inhibition and distractor interference in the flanker and Stroop task. Acta Psychol (Amst) 2004;116(1):21–37. doi: 10.1016/j.actpsy.2003.12.011. [DOI] [PubMed] [Google Scholar]
- 5.Verbruggen F, Liefooghe B, Vandierendonck A. The effect of interference in the early processing stages on response inhibition in the stop signal task. Q J Exp Psychol (Hove) 2006;59(1):190–203. doi: 10.1080/17470210500151386. [DOI] [PubMed] [Google Scholar]
- 6.Emeric EE, et al. Influence of history on saccade countermanding performance in humans and macaque monkeys. Vision Res. 2007;47(1):35–49. doi: 10.1016/j.visres.2006.08.03. [DOI] [PMC free article] [PubMed] [Google Scholar]
- 7.Mirabella G, Pani P, Ferraina S. Context influences on the preparation and execution of reaching movements. Cogn Neuropsychol. 2008;25(7-8):996–1010. doi: 10.1080/02643290802003216. [DOI] [PubMed] [Google Scholar]
- 8.Verbruggen F, Logan GD, Liefooghe B, Vandierendonck A. Short-term after effects of response inhibition: Repetition priming or between-trial control adjustments? J Exp Psychol Hum Percept Perform. 2008;34(2):413–426. doi: 10.1037/0096-1523.34.2.413. [DOI] [PubMed] [Google Scholar]
- 9.Verbruggen F, Logan GD. Proactive adjustments of response strategies in the stop-signal paradigm. J Exp Psychol Hum Percept Perform. 2009;35(3):835–854. doi: 10.1037/a0012726. [DOI] [PMC free article] [PubMed] [Google Scholar]
- 10.Nelson MJ, Boucher L, Logan GD, Palmeri TJ, Schall JD. Nonindependent and nonstationary response times in stopping and stepping saccade tasks. Atten Percept Psychophys. 2010;72(7):1913–1929. doi: 10.3758/APP.72.7.1913. [DOI] [PMC free article] [PubMed] [Google Scholar]
- 11.Stuphorn V, Emeric EE. Proactive and reactive control by the medial frontal cortex. Front Neuroeng. 2012;5:9. doi: 10.3389/fneng.2012.00009. [DOI] [PMC free article] [PubMed] [Google Scholar]
- 12.Lu X, Matsuzawa M, Hikosaka O. A neural correlate of oculomotor sequences in supplementary eye field. Neuron. 2002;34(2):317–325. doi: 10.1016/s0896-6273(02)00657-8. [DOI] [PubMed] [Google Scholar]
- 13.Isoda M, Tanji J. Cellular activity in the supplementary eye field during sequential performance of multiple saccades. J Neurophysiol. 2002;88(6):3541–3545. doi: 10.1152/jn.00299.2002. [DOI] [PubMed] [Google Scholar]
- 14.McPeek RM, Skavenski AA, Nakayama K. Concurrent processing of saccades in visual search. Vision Res. 2000;40(18):2499–2516. doi: 10.1016/s0042-6989(00)00102-4. [DOI] [PubMed] [Google Scholar]
- 15.Sharika KM, Ramakrishnan A, Murthy A. Control of predictive error correction during a saccadic double-step task. J Neurophysiol. 2008;100(5):2757–2770. doi: 10.1152/jn.90238.2008. [DOI] [PubMed] [Google Scholar]
- 16.Becker W, Jürgens R. An analysis of the saccadic system by means of double step stimuli. Vision Res. 1979;19(9):967–983. doi: 10.1016/0042-6989(79)90222-0. [DOI] [PubMed] [Google Scholar]
- 17.Ray S, Schall JD, Murthy A. Programming of double-step saccade sequences: Modulation by cognitive control. Vision Res. 2004;44(23):2707–2718. doi: 10.1016/j.visres.2004.05.029. [DOI] [PubMed] [Google Scholar]
- 18.Murthy A, et al. Frontal eye field contributions to rapid corrective saccades. J Neurophysiol. 2007;97(2):1457–1469. doi: 10.1152/jn.00433.2006. [DOI] [PubMed] [Google Scholar]
- 19.DeAngelis GC, Uka T. Coding of horizontal disparity and velocity by MT neurons in the alert macaque. J Neurophysiol. 2003;89(2):1094–1111. doi: 10.1152/jn.00717.2002. [DOI] [PubMed] [Google Scholar]
- 20.Sternberg S, Monsell S, Knoll RL, Wright CE. The latency and duration of rapid movement sequences: Comparisons of speech and typewriting. In: Stelmach GE, editor. Information Processing in Motor Control and Learning. New York: Academic; 1978. pp. 117–152. [Google Scholar]
- 21.Zingale CM, Kowler E. Planning sequences of saccades. Vision Res. 1987;27(8):1327–1341. doi: 10.1016/0042-6989(87)90210-0. [DOI] [PubMed] [Google Scholar]
- 22.Silvanto J, Muggleton NG. New light through old windows: Moving beyond the “virtual lesion” approach to transcranial magnetic stimulation. Neuroimage. 2008;39(2):549–552. doi: 10.1016/j.neuroimage.2007.09.008. [DOI] [PubMed] [Google Scholar]
- 23.Silvanto J, Muggleton NG, Cowey A, Walsh V. Neural adaptation reveals state-dependent effects of transcranial magnetic stimulation. Eur J Neurosci. 2007;25(6):1874–1881. doi: 10.1111/j.1460-9568.2007.05440.x. [DOI] [PubMed] [Google Scholar]
- 24.Moliadze V, Zhao Y, Eysel U, Funke K. Effect of transcranial magnetic stimulation on single-unit activity in the cat primary visual cortex. J Physiol. 2003;553(Pt 2):665–679. doi: 10.1113/jphysiol.2003.050153. [DOI] [PMC free article] [PubMed] [Google Scholar]
- 25.Albrecht DG, Hamilton DB. Striate cortex of monkey and cat: Contrast response function. J Neurophysiol. 1982;48(1):217–237. doi: 10.1152/jn.1982.48.1.217. [DOI] [PubMed] [Google Scholar]
- 26.Hikosaka O, et al. Parallel neural networks for learning sequential procedures. Trends Neurosci. 1999;22(10):464–471. doi: 10.1016/s0166-2236(99)01439-3. [DOI] [PubMed] [Google Scholar]
- 27.Neggers SF, et al. TMS pulses on the frontal eye fields break coupling between visuospatial attention and eye movements. J Neurophysiol. 2007;98(5):2765–2778. doi: 10.1152/jn.00357.2007. [DOI] [PubMed] [Google Scholar]
- 28.Van Ettinger-Veenstra HM, et al. fMRI-guided TMS on cortical eye fields: The frontal but not intraparietal eye fields regulate the coupling between visuospatial attention and eye movements. J Neurophysiol. 2009;102(6):3469–3480. doi: 10.1152/jn.00350.2009. [DOI] [PubMed] [Google Scholar]
- 29.Bosch SE, Neggers SF, Van der Stigchel S. The Role of the Frontal Eye Fields in Oculomotor Competition: Image-Guided TMS Enhances Contralateral Target Selection. Cereb Cortex. 2012 doi: 10.1093/cercor/bhs075. 10.1093/cercor/bhs075. [DOI] [PubMed] [Google Scholar]
- 30.Sack AT, et al. Optimizing functional accuracy of TMS in cognitive studies: A comparison of methods. J Cogn Neurosci. 2009;21(2):207–221. doi: 10.1162/jocn.2009.21126. [DOI] [PubMed] [Google Scholar]
- 31.Pruessmann KP, Weiger M, Scheidegger MB, Boesiger P. SENSE: Sensitivity encoding for fast MRI. Magn Reson Med. 1999;42(5):952–962. [PubMed] [Google Scholar]
- 32.Neggers SF, Hermans EJ, Ramsey NF. Enhanced sensitivity with fast three-dimensional blood-oxygen-level-dependent functional MRI: Comparison of SENSE-PRESTO and 2D-EPI at 3 T. NMR Biomed. 2008;21(7):663–676. doi: 10.1002/nbm.1235. [DOI] [PubMed] [Google Scholar]
- 33.Worsley KJ, et al. A unified statistical approach for determining significant signals in images of cerebral activation. Hum Brain Mapp. 1996;4(1):58–73. doi: 10.1002/(SICI)1097-0193(1996)4:1<58::AID-HBM4>3.0.CO;2-O. [DOI] [PubMed] [Google Scholar]
- 34.Schutter DJ, van Honk J. A standardized motor threshold estimation procedure for transcranial magnetic stimulation research. J ECT. 2006;22(3):176–178. doi: 10.1097/01.yct.0000235924.60364.27. [DOI] [PubMed] [Google Scholar]
- 35.Nielsen FÅ, Hansen LK. 2002. Automatic anatomical labeling of Talairach coordinates and generation of volumes of interest via the BrainMap database (Abstract), Proceedings of the 8th International Conference on Functional Mapping of the Human Brain, June 2–6, 2002, Sendai, Japan (Academic Press, San Diego) [DOI] [PMC free article] [PubMed]
- 36.Neggers SF, et al. A stereotactic method for image-guided transcranial magnetic stimulation validated with fMRI and motor-evoked potentials. Neuroimage. 2004;21(4):1805–1817. doi: 10.1016/j.neuroimage.2003.12.006. [DOI] [PubMed] [Google Scholar]
- 37.Neggers SF, et al. A functional and structural investigation of the human fronto-basal volitional saccade network. PLoS ONE. 2012;7(1):e29517. doi: 10.1371/journal.pone.0029517. [DOI] [PMC free article] [PubMed] [Google Scholar]
- 38.Burr DC, Morrone MC, Ross J. Selective suppression of the magnocellular visual pathway during saccadic eye movements. Nature. 1994;371(6497):511–513. doi: 10.1038/371511a0. [DOI] [PubMed] [Google Scholar]
