

Abstract
Detection and attribution of past changes in cyclone activity are hampered by biased cyclone records due to changes in observational capabilities. Here, we relate a homogeneous record of Atlantic tropical cyclone activity based on storm surge statistics from tide gauges to changes in global temperature patterns. We examine 10 competing hypotheses using nonstationary generalized extreme value analysis with different predictors (North Atlantic Oscillation, Southern Oscillation, Pacific Decadal Oscillation, Sahel rainfall, Quasi-Biennial Oscillation, radiative forcing, Main Development Region temperatures and its anomaly, global temperatures, and gridded temperatures). We find that gridded temperatures, Main Development Region, and global average temperature explain the observations best. The most extreme events are especially sensitive to temperature changes, and we estimate a doubling of Katrina magnitude events associated with the warming over the 20th century. The increased risk depends on the spatial distribution of the temperature rise with highest sensitivity from tropical Atlantic, Central America, and the Indian Ocean. Statistically downscaling 21st century warming patterns from six climate models results in a twofold to sevenfold increase in the frequency of Katrina magnitude events for a 1 °C rise in global temperature (using BNU-ESM, BCC-CSM-1.1, CanESM2, HadGEM2-ES, INM-CM4, and NorESM1-M).
Keywords: climate change, hazard, flood
Predicting how cyclone activity will change in a warmer world has proven to be an elusive target (1, 2). There are competing factors that may influence whether tropical cyclone activity will strengthen or weaken. Warmer sea surface temperatures (SSTs) are favorable to tropical cyclones. However, global warming may also increase vertical wind shear, which is unfavorable for cyclones (3), although some studies find this is a minor effect (4). Dynamical downscaling of Atlantic tropical cyclones tend to show fewer but more intense events, but the results are not consistent between models (5, 6). Studies that use the relationship between cyclone activity and sea surface temperatures in the Main Development Region (MDR) in general show a high sensitivity to warming (7–11). However, other authors propose that cyclones are sensitive to MDR warming relative to the tropical mean (3, 12–15). This alternative hypothesis is supported by some process model output (3, 16, 17). Projections based on relative MDR (rMDR) relationships show little increase over the 21st century (14, 17).
Observational bias in cyclone records (9, 18, 19) has made it hard to distinguish between competing hypotheses for 21st century cyclone activity. In this paper, we use a homogeneous record of cyclone surge activity since 1923 (20) to estimate how the frequency of extreme surges changes with spatial warming patterns. We develop a nonstationary extreme value model of the probability distribution of hurricane surge threat as a function of spatial warming patterns. This allows us to project changes in probability of even the most rare surges. It also allows us to evaluate competing hypotheses and calculate their Bayesian likelihood. Process models [general circulation model or earth system model (ESM)] running at very high resolution (50- or 25-km grids) provide some physical support for our statistical downscaling (16), but they need long model runs to obtain credible statistics for rare events, beyond present computing power limits. Alternatively, large numbers of events can be simulated using statistical/deterministic downscaling driven by climate model output (e.g., refs. 8 and 21).
The strong winds and intense low pressure associated with tropical cyclones generate storm surges. These storm surges are the most harmful aspect of tropical cyclones in the current climate (1, 2), and wherever tropical cyclones prevail they are the primary cause of storm surges (20). Here, we will use a storm surge index constructed from six long high-frequency tide-gauge records from the southeastern United States (Fig. 1), as these provide a homogeneous dataset for examining Atlantic cyclone activity since 1923. Absolute surge levels are strongly influenced by local mean sea level rise. However, we remove the effects of the seasonal cycle, tides, and sea level rise so as to focus on the influence from weather. Wind speed is not a perfect predictor for surge impact or damage, and there is thus no surge index threshold that corresponds to all land-falling hurricanes. However, we have previously demonstrated that the most extreme surge index events can predominantly be attributed to large land-falling hurricanes, and that they are linked to hurricane damage (20). We therefore interpret the surge index as primarily a measure of hurricane surge threat, although we note that other types of extreme weather also generate surges such as hybrid storms and severe winter storms (e.g., Storm of the Century 1993, Sandy 2012, and Perfect Storm 1991).
Fig. 1.

(A) Average surge index over the cyclone season. (B) Observed frequency of surge events with surge index greater than 10 units per year (surge index > 10 units). (C) Global average temperature, MDR temperature, and rMDR temperature anomaly. Inset shows locations along the US coast of the six tide gauges used in the surge index (Fig. S1).
The surge index is normalized and we use the highest surge recorded during Hurricane Katrina in 2005 as a benchmark for extremes. We will talk of extreme events crossing this threshold as events of Katrina magnitude or simply “Katrinas.” We emphasize that not all Katrinas will have equally devastating impacts. The surge index is not intended as a proxy for wind speed-derived metrics, but rather an independent cyclone activity record that specifically quantifies coastal surge threat. This should be kept in mind when comparing with other studies, which often focus on basin-wide counts crossing a wind speed threshold (e.g., ref. 5). The surge index record shows a significant positive trend, and warm years have been associated with twice as many Katrinas as cold years (20).
Results
Statistical models have relied on correlations between cyclone activity and either MDR SST (e.g., ref. 8) or MDR SST relative to tropical mean SST (rMDR) (e.g., ref. 14). Rather than choosing between these two competing hypotheses, we will construct our statistical model from the relationship to the full globally gridded temperatures. We also construct a model that relies exclusively on global mean surface temperature. Although this simpler model may not have as strong correlations as the causal link is more indirect, it has the advantage that it does not rely on subtle regional patterns that are difficult for process models to reliably capture. This issue may render it unviable to apply the MDR or rMDR relationships for projections. Furthermore, the causal relationship between MDR temperatures and tropical cyclones is bidirectional, in the sense that tropical cyclones move heat from the MDR to the extratropics. Thus, modeled MDR temperatures will be biased if process models do not adequately capture cyclone activity. For that reason, it is arguable that projections based on the relationship to global temperatures is preferable, as the causal relationship can reasonably be assumed to be unidirectional.
We will use the homogeneous surge index to discriminate changes in extreme statistics (Fig. 1). The surge index quantifies the maximal weekly surge. We therefore expect it to follow a generalized extreme value (GEV) distribution as it is a series of block maxima (22) (SI Methods), and this was verified by Grinsted et al. (20). However, Grinsted et al. (20) showed that the distribution is nonstationary. Here, we therefore model the surge index with a nonstationary GEV distribution, with shape (k), scale (σ), and location (µ) parameters dependent on a predictor (T). The location and scale parameters are primarily related to the frequency of relatively low- and medium-sized storms (i.e., storm counts), whereas the shape parameter controls the frequency of the most extreme storms. For simplicity, we adopt the following relationship to T:
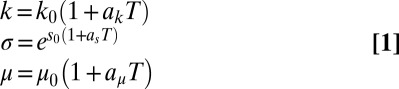 |
following Coles (22). The k0, s0, and µ0 parameters describe the extreme distribution for the baseline climate where T = 0, and the nonstationary parameters (ak, as, aµ) describe how sensitive the distribution is to changes in T with positive values associated with more frequent extreme surges. We estimate the six unknown parameters and their confidence intervals using Markov Chain Monte Carlo (MCMC) (SI Methods).
We examine the links to the temperature from any location on Earth by using the observed grid cell temperature series as the predictor (23). In that way, we are able to construct maps of the relationship between surge index extremes and the full spatial temperature patterns. The resulting odds ratio map (Fig. 2) can be thought of as an extreme teleconnection pattern. Low relative odds can be due to a weak physical link, a spatially nonstationary process, or due to a poor signal-to-noise ratio in the temperature observations. In either case, the model for that particular grid cell should be given less relative weight when used for projections. Finally, we create an average downscaled model, taking all of the inferred spatial information into account by weighing the individual grid cell-based models by likelihood and area. This approach ensures that most weight is given to regions where the temperature data are of sufficient quality to calibrate the model, and to regions where there has been a consistent statistical relationship (i.e., a stationary spatial signature).
Fig. 2.

Extreme teleconnection patterns between local surface temperatures and surge index. (A) Colors indicate the odds ratio between of models using local temperatures to predict changes in surge index extremes compared with a model using global average temperature. Almost all local temperature series are worse predictors than global average temperature. Best-guess values for the nonstationarity parameters (B–D) linking local surface temperatures to surge index extremes. Gray indicates insufficient data and black dots indicate regions where the 5–95% confidence interval spans zero.
Fig. 2 shows the best-guess estimates of the nonstationary parameters (ak, as, aµ) for each global grid point and the relative odds of the individual models. It is clear that all three parameters are strongly affected by temperature, and that warming in general leads to a higher frequency of surges of all magnitudes. For comparison, we also find that all three nonstationary parameters are significantly positive in the model using global average temperature as predictor (P < 0.05; Table 1). With a few notable exceptions, global average surface temperature is a better predictor of Atlantic cyclone activity (as measured by the surge index) than grid cell temperatures from almost anywhere on Earth (Fig. 2A).
Table 1.
Model parameters with confidence intervals for the nonstationary GEV distribution using global average temperature (23) as predictor
| Percentile | k0 | s0 | μ0 | ak | as | aμ |
| 5% | 0.51 | 0.44 | 2.36 | 0.04 | 0.26 | 0.05 |
| 16% | 0.52 | 0.45 | 2.38 | 0.11 | 0.35 | 0.08 |
| Best guess | 0.54 | 0.48 | 2.41 | 0.22 | 0.49 | 0.13 |
| 84% | 0.56 | 0.5 | 2.45 | 0.33 | 0.62 | 0.18 |
| 95% | 0.57 | 0.51 | 2.47 | 0.39 | 0.71 | 0.21 |
In an analogous manner, we calculate the odds (Methods) of seven alternative predictor models (e.g., Southern Oscillation index), which previously have been linked to Atlantic cyclone activity (Table 2). The teleconnection indices all have worse skill than even a simple linear trend over time. We find that the spatially averaged SST over the MDR is a better predictor than global average temperature (Table 2), as expected from many previous studies (7–11, 24, 32). In contrast, the alternative hypothesized predictor model using rMDR shows comparatively poor skill relative to both global temperatures and MDR. In the rMDR hypothesis, the SST in the tropics outside the MDR region are expected to be negatively correlated with cyclone events, but we find that the tail parameter (ak in Fig. 2) has positive values over the tropics with the exception of the eastern Pacific. The relatively poor skill of rMDR is surprising because statistical analysis of process model output indicate that it should be a good predictor of cyclone activity (3, 16, 17). However, there is no physical theory that links rMDR to cyclone activity.
Table 2.
Performance of alternative models expressed as an odds ratio relative to the model using global average temperature as the predictor
| Predictor | Katrina sensitivity | Odds |
| Gridded temperatures (23) | 2.1–6.6× | 4:1 |
| MDR SST (24) | 1.8–5.5× | 3:1 |
| Global T (23) | 1.5–6.6× | 1:1 |
| Linear increase | 1.3–4.7× | 1:5 |
| Radiative forcing (25) | 1:10 | |
| rMDR (24) | 1.8–10× | 1:75 |
| Pacific Decadal Oscillation (26) | 1:400 | |
| Quasi-Biennial Oscillation (27) | 1:600 | |
| Southern Oscillation index (28) | 1:700 | |
| North Atlantic Oscillation (29, 30) | 1:800 | |
| Sahel rainfall index (31) | 1:1,200 |
The average likelihood of each hypothesis is calculated from entire sample of models from the MCMC, while ensuring that the likelihood is calculated over the same time interval in the numerator and denominator of the ratio. The Katrina sensitivity is expressed as the relative frequency increase of Katrinas [5–95%] per degree Celsius. The linear trend sensitivity is given per century.
Several of the spatial relationships observed in Fig. 2 are consistent with well-known physical relationships. The positive relationship with western Pacific SST is consistent with the teleconnection between El Niño–Southern Oscillation and Atlantic hurricanes (1, 2, 33). We note, however, that the Southern Oscillation index by itself is a relatively poor predictor of cyclone activity (Table 2), possibly because it lacks the global warming signal. The weaker positive relationship between the SSTs over the Atlantic subpolar gyre and k, has been mechanistically related to reduced wind shear and increased precipitation in the MDR (34). A warm subpolar gyre produces a reduced temperature gradient with the equator, a reduced northward heat transport (34), and an anomalously warm SST in the MDR (35).
Desert region temperatures are in general good predictors, even as far away as Australia (Fig. 2A). The North-African pattern is likely due to the well-known Sahel rainfall teleconnection (36). More generally, the conditions that favor cyclones may be similar to those that favor warm desert temperatures, rather than a direct causal link between cyclones and desert temperatures. Fig. 2A indicates the importance of land temperatures rather than SSTs, although the weak North Atlantic feature is consistent with earlier suggested links (2, 35, 37). One possible explanation could be a better observational network and thus a higher signal-to-noise ratio of land temperatures. The extensive field of teleconnections surrounding the Indian Ocean has not been previously reported.
The best local predictors are found over Central and subtropical North and South Americas (Fig. 2A). The relationship to subtropical North American temperatures is opposite in sign (Fig. 2 C and D). We may expect that North American land temperatures are cooled by the passing of cyclones in particularly active years. That is, these temperatures are affected by cyclone activity rather than vice versa.
Discussion
We have calibrated models from each individual grid cell and combined all of these into a single model. This downscaled model incorporates all of the competing teleconnection effects discussed above. We map the projected warming patterns through this statistical model to project future changes. We emphasize that this is not a blind statistical extrapolation exercise, as we have verified that the teleconnection patterns are consistent with well-known physical relationships. To demonstrate the cyclone number evolution over the 21st century (Fig. 3), we project changes in the frequency of Katrinas using gridded and global mean temperatures from an ESM with a ∼2.4 °C warming over the 21st century (RCP4.5) (38). We examine the intraclimate model variability using output from six models (BNU-ESM, BCC-CSM-1.1, CanESM2, HadGEM2-ES, INM-CM4, and NorESM1-M). The response to a 1-°C warming is consistently an increase by a factor of 2–7, despite the spread in climate sensitivity between ESMs. The model forced by global average temperature yield projections near identical to the full spatial model (Fig. 3 and SI Katrina Sensitivity to Global Warming). The MDR model is less sensitive to warming (Table 2, Fig. 3, and Fig. S1), but results in projections that are consistent with the results from both the full spatial model, and the global model. In SI Sensitivity Tests, we perform a range of sensitivity tests by changing statistical methods, data treatment, and impact of data gaps. All tests indicate confidence in the factor 2–7 increase in the number of Katrina magnitude surges for each degree of global warming. This increase does not include the additional increasing surge threat from sea level rise (21).
Fig. 3.

Number of Katrina magnitude surge events per decade (B) hindcast and projected changes in temperatures from BNU-ESM under for RCP4.5 (A). The thick blue line shows the projection using the full spatial gridded temperatures and confidence interval (5–16–84–95%); magenta and black show the projections using only MDR and global average surface temperature. Confidence intervals for MDR and global T (not shown for clarity) are about the same size as for the gridded model.
There is no straightforward correspondence between the surge magnitude, and hurricane counts or wind speed. However, the sensitivity of surge activity to warming we infer (Fig. 4) appears to be greater than obtained from downscaled projections of basinwide hurricane counts (5), and of hurricane surge statistics in New York (21). Bender et al. (5) estimate an 81% increase in the frequency of basinwide category 4–5 hurricanes for a scenario with ∼2.5 °C warming. Projected changes in hurricane surge levels above mean sea level at New York have been shown to be sensitive to model choices and results range from a 10% reduction to a 50% increase in a scenario with ∼2.8 °C global warming (21).
Fig. 4.

(Left) Estimated return periods for global temperatures being 0 °C (blue) and 1 °C (red) warmer than present (1980–2000 average). The best-guess GEV distribution (lines) with confidence intervals (shading). Crosses show the empirically estimated return period assuming stationarity 1923 to present. (Right) Relative increase in frequency associated with a 1 °C warming in global temperatures (relative to a 1980–2000 baseline). (Left and Right) Light shading shows the 5–95% confidence intervals, and dark shading shows the 16–84%.
Small changes in the probability density function extreme event tail lead to large relative reductions in the return period of the largest storm surges (Fig. 4), consistent with most process modeling studies (1, 2, 5). Our empirical evidence shows that warming also leads to an increase in the number of relatively common events (Figs. 2 and 4) in agreement with surge modeling (21). This is in contrast to many model studies of Atlantic cyclone numbers, which on average predict a decrease (2, 5) or only a slight increase (6) with rising temperatures, although we emphasize that cyclone numbers does not directly translate into coastal surge impact. Previously climate model projections of cyclone numbers have been limited by resolution (1, 2), which results in weaker cyclones than observed (1). Higher resolution models are becoming feasible and show closer correspondence with our statistical downscaling (2, 16). Our analysis shows that the rMDR predictor used in recent statistical projections (17, 39) has comparatively poor skill when applied to the homogeneous surge index.
The empirical evidence here demonstrates a greatly increased Atlantic hurricane surge threat in a warmer world (Figs. 3 and 4, and Fig. S1). The escalating threat from cyclone-driven storm surges is further exacerbated by rising sea level (1, 2, 21, 40). Additionally, the observed recent increase in Atlantic coastal wave power (41) is concomitant with these increases in surge index. Finally, we find that ∼0.4 °C global average warming results in a halving of the return period of Katrina magnitude events. This is less than the warming over the 20th century. Therefore, we have probably crossed the threshold where Katrina magnitude hurricane surges are more likely caused by global warming than not.
Methods
In this section, we compare the model using global average temperature with models using alternative predictors. We use odds to quantify the model performance of two competing model hypotheses. All model hypotheses are very similar in that they use Eq. 1, only with different predictors (T). The odds are calculated from the likelihood ratio of the proposed alternative model hypothesis relative to the likelihood of the model using global average temperatures (restricted to years of overlap). All models have the same complexity (six free model parameters) and their odds can therefore easily be compared. The odds ratio can be interpreted as a Bayes factor, where an odds value of 10:1 is traditionally considered the limit for strong evidence, and 100:1, the limit for decisive evidence.
In Table 2, we list the performance comparison for various common predictors/teleconnections. Odds ratios for temperature series from individual grid points over almost the entire world are worse predictors than global average temperature (Fig. 2A). However, spatial averaging over the MDR region (85W–20W, 10N–20N) reduces noise and leads to a better predictor series (Table 2). All predictors have been smoothed with an annual average filter. We obtain compatible results when using a 3-mo averaging.
Supplementary Material
Acknowledgments
We acknowledge the international modeling groups, Program for Climate Model Diagnosis and Intercomparison and Coupled Model Intercomparison Project, for access to model outputs. This research was partly supported by China’s National Key Science Program for Global Change Research Grant 2010CB950504, the Danish Strategic Research Council through its support of Centre for Regional Change in the Earth System (www.cres-centre.dk) under Contract DSF-EnMi 09-066868, European Research Council Advanced Grant 246815 (WATERundertheICE), and an Inge Lehmann travel grant.
Footnotes
The authors declare no conflict of interest.
This article is a PNAS Direct Submission.
This article contains supporting information online at www.pnas.org/lookup/suppl/doi:10.1073/pnas.1209980110/-/DCSupplemental.
References
- 1. World Weather Research Programme (2007) Proceedings of the Sixth WMO International Workshop on Tropical Cyclones (IWTC-VI) (World Meteorological Organization, Geneva, Switzerland), WMO TD No. 1383.
- 2.Knutson TR, et al. Tropical cyclones and climate change. Nat Geosci. 2010 3(3):157–163, 10.1038/ngeo779. [Google Scholar]
- 3.Vecchi GA, Soden BJ. Increased tropical Atlantic wind shear in model projections of global warming. Geophys Res Lett. 2007;34:L08702. doi: 10.1029/2006GL028905. [DOI] [Google Scholar]
- 4.Bruyère C, Holland G, Towler E. Investigating the use of a genesis potential index for tropical cyclones in the North Atlantic basin. J Clim. 2012;25(24):8611–8626. doi: 10.1175/JCLI-D-11-00619.1. [DOI] [Google Scholar]
- 5.Bender MA, et al. Modeled impact of anthropogenic warming on the frequency of intense Atlantic hurricanes. Science. 2010;327(5964):454–458. doi: 10.1126/science.1180568. [DOI] [PubMed] [Google Scholar]
- 6.Emanuel K, Sundararajan R, Williams J. Hurricanes and global warming, results from downscaling IPCC AR4 simulations. Bull Am Meteorol Soc. 2008;89(3):347–367. doi: 10.1175/BAMS-89-3-347. [DOI] [Google Scholar]
- 7.Jagger TH, Elsner JB. Climatology models for extreme hurricane winds near the United States. J Clim. 2006;19:3220–3226. [Google Scholar]
- 8.Emanuel K. Increasing destructiveness of tropical cyclones over the past 30 years. Nature. 2005;436(7051):686–688. doi: 10.1038/nature03906. [DOI] [PubMed] [Google Scholar]
- 9.Mann ME, Emanuel KA, Holland GL, Webster PJ. Atlantic tropical cyclones revisited. Eos Trans AGU. 2007;88(36):349–350. [Google Scholar]
- 10.Webster PJ, Holland GJ, Curry JA, Chang H-R. Changes in tropical cyclone number, duration, and intensity in a warming environment. Science. 2005;309(5742):1844–1846. doi: 10.1126/science.1116448. [DOI] [PubMed] [Google Scholar]
- 11.Holland GJ, Webster PJ. Heightened tropical cyclone activity in the North Atlantic: Natural variability or climate trend? Philos Transact A Math Phys Eng Sci. 2007;365(1860):2695–2716. doi: 10.1098/rsta.2007.2083. [DOI] [PubMed] [Google Scholar]
- 12.Swanson KL. Nonlocality of Atlantic tropical cyclone intensities. Geochem Geophys Geosyst. 2008;9(4):Q04V01. doi: 10.1029/2007GC001844. [DOI] [Google Scholar]
- 13.Knutson TR, Sirutis JJ, Garner ST, Vecchi GA, Held IM. Simulated reduction in Atlantic hurricane frequency under twenty-first-century warming conditions. Nat Geosci. 2008;1(6):359–364. doi: 10.1038/ngeo202. [DOI] [Google Scholar]
- 14.Vecchi GA, Swanson KL, Soden BJ. Climate change. Whither hurricane activity? Science. 2008;322(5902):687–689. doi: 10.1126/science.1164396. [DOI] [PubMed] [Google Scholar]
- 15.Villarini G, Vecchi GA, Smith JA. Modeling of the dependence of tropical storm counts in the North Atlantic basin on climate indices. Mon Weather Rev. 2010;138(7):2681–2705. [Google Scholar]
- 16.Zhao M, Held IM, Lin S-J, Vecchi GA. Simulations of global hurricane climatology, interannual variability, and response to global warming using a 50km resolution gcm. J Clim. 2009;22(24):6653–6678. [Google Scholar]
- 17.Villarini G, Vecchi GA, Knutson TR, Zhao M, Smith JA. North Atlantic tropical storm frequency response to anthropogenic forcing: projections and sources of uncertainty. J Clim. 2011;24(13):3224–3238. doi: 10.1175/2011JCLI3853.1. [DOI] [Google Scholar]
- 18.Landsea CW. Counting Atlantic tropical cyclones back to 1900. Eos Trans AGU. 2007;88(18):197. [Google Scholar]
- 19.Vecchi GA, Knutson TR. On estimates of historical North Atlantic tropical cyclone activity. J Clim. 2008;21(24):3580–3600. [Google Scholar]
- 20.Grinsted A, Moore JC, Jevrejeva S. A homogeneous record of Atlantic hurricane surge threat since 1923. Proc Natl Acad Sci USA. 2012;109(48):19601–19605. doi: 10.1073/pnas.1209542109. [DOI] [PMC free article] [PubMed] [Google Scholar]
- 21.Lin N, Emanuel K, Oppenheimer M, Vanmarcke E. Physically based assessment of hurricane surge threat under climate change. Nat Clim Change. 2012;2(6):462–467. [Google Scholar]
- 22.Coles S. An Introduction to Statistical Modeling of Extreme Values. London: Springer; 2001. [Google Scholar]
- 23.Hansen J, Ruedy R, Sato M, Lo K. 2010. Global surface temperature change. Rev Geophys 48:RG4004, doi:10.1029/2010RG000345.
- 24.Rayner NA, et al. Improved analyses of changes and uncertainties in sea surface temperature measured in situ since the mid-nineteenth century: The HadSST2 data set. J Clim. 2006;19(3):446–469. [Google Scholar]
- 25.Meinshausen M, et al. The RCP greenhouse gas concentrations and their extension from 1765 to 2300. Clim Change. 2011;109(1):213–241. doi: 10.1007/s10584-011-0156-z. [DOI] [Google Scholar]
- 26.Mantua NJ, Hare SR, Zhang Y, Wallace JM, Francis RC. A Pacific interdecadal climate oscillation with impacts on salmon production. Bull Am Meteorol Soc. 1997;78(6):1069–1079. [Google Scholar]
- 27.Kalnay E, et al. Roy Jenne, Dennis Joseph (1996), The NCEP/NCAR 40-year reanalysis project. Bull Am Meteorol Soc. 1996;77(3):437–470. [Google Scholar]
- 28.Ropelewski CF, Jones PD. An extension of the Tahiti-Darwin Southern Oscillation Index. Mon Weather Rev. 1987;115:2161–2165. [Google Scholar]
- 29.Jones PD, Jónsson T, Wheeler D. Extension to the North Atlantic Oscillation using early instrumental pressure observations from Gibraltar and South-West Iceland. Int J Climatol. 1997;17(13):1433–1450. [Google Scholar]
- 30.Osborn TJ. Recent variations in the winter North Atlantic Oscillation. Weather. 2006;61(12):353–355. [Google Scholar]
- 31.Janowiak JE. An investigation of interannual rainfall variability in Africa. J Clim. 1988;1(3):240–255. [Google Scholar]
- 32.Elsner JB. Granger causality and Atlantic hurricanes. Tellus. 2007;A 59(4):476–485. [Google Scholar]
- 33.Gray WM. Atlantic seasonal hurricane frequency. Part I: El Niño and 30 mb quasi-biennial oscillation influences. Mon Weather Rev. 1984;112:1649–1668. [Google Scholar]
- 34.Smith DM, et al. Skilful multi-year predictions of Atlantic hurricane frequency. Nat Geosci. 2010;3(12):846–849. doi: 10.1038/ngeo1004. [DOI] [Google Scholar]
- 35.Moore JC, Grinsted A, Jevrejeva S. Gulf stream and ENSO increase the temperature sensitivity of Atlantic tropical cyclones. J Clim. 2008;21(7):1523–1531. [Google Scholar]
- 36.Gray WM. 1990. Strong association between West African rainfall and U.S. landfall of intense hurricanes. Science 249(4974):1251–1256.
- 37.Goldenberg SB, Landsea CW, Mestas-Nunez AM, Gray WM. The recent increase in Atlantic hurricane activity: Causes and implications. Science. 2001;293(5529):474–479. doi: 10.1126/science.1060040. [DOI] [PubMed] [Google Scholar]
- 38.Wei T, et al. Developed and developing world responsibilities for historical climate change and CO2 mitigation. Proc Natl Acad Sci USA. 2012;109(32):12911–12915. doi: 10.1073/pnas.1203282109. [DOI] [PMC free article] [PubMed] [Google Scholar]
- 39.Villarini G, Vecchi GA. 2012. Twenty-first-century projections of North Atlantic tropical storms from CMIP5 models. Nat Clim Change 2(8):604–607, 10:1038/NCLIMATE1530.
- 40.Jevrejeva S, Moore JC, Grinsted A. How will sea level respond to changes in natural and anthropogenic forcings by 2100? Geophys Res Lett. 2010;37(7):L07703. doi: 10.1029/2010GL042947. [DOI] [Google Scholar]
- 41.Bromirski PD, Kossin JP. Increasing hurricane wave power along the U.S. Atlantic and Gulf coasts. J Geophys Res. 2008;113(C7):C07012. doi: 10.1029/2007JC004706. [DOI] [Google Scholar]
Associated Data
This section collects any data citations, data availability statements, or supplementary materials included in this article.