

Abstract
To uncover the potential cardiovascular effects of human polymorphisms influencing transforming growth factor β1 (TGFβ1) expression, we generated mice with Tgfb1 mRNA expression graded in five steps from 10% to 300% normal. Adrenal expression of the genes for mineralocorticoid-producing enzymes ranged from 50% normal in the hypermorphs at age 12 wk to 400% normal in the hypomorphs accompanied with proportionate changes in plasma aldosterone levels, whereas plasma volumes ranged from 50% to 150% normal accompanied by marked compensatory changes in plasma angiotensin II and renin levels. The aldosterone/renin ratio ranged from 0.3 times normal in the 300% hypermorphs to six times in the 10% hypomorphs, which have elevated blood pressure. Urinary output of water and electrolytes are markedly decreased in the 10% hypomorphs without significant change in the glomerular filtration rate. Renal activities for the Na+, K+-ATPase, and epithelial sodium channel are markedly increased in the 10% hypomorphs. The hypertension in the 10% hypomorphs is corrected by spironolactone or amiloride at doses that do not change blood pressure in wild-type mice. Thus, changes in Tgfb1 expression cause marked progressive changes in multiple systems that regulate blood pressure and fluid homeostasis, with the major effects being mediated by changes in adrenocortical function.
Keywords: idiopathic bilateral adrenal hyperplasia, hyperthermia
Transforming growth factor β1 (TGFβ1), the prototypic member of the TGFβ superfamily, is a potent multifunctional cytokine with effects on a broad range of biological processes including cell proliferation, apoptosis, tumor suppression, senescence (1, 2), differentiation (3), migration (4), immunity (5), osteogenesis (6), adipogenesis (7), and wound healing (8).
Whether TGFβ1 plays any role in the control of blood pressure (BP) is not yet clearly demonstrated. Mice have been generated that completely lack TGFβ1 (9, 10), but their death from severe inflammatory disease around weaning precludes BP measurements. The inflammatory disease and early death can be circumvented if the mice also lack functional T and B cells as a result of inactivating the recombination activating gene, Rag1 (11). Unfortunately, inactivating Rag1, either alone or in conjunction with inactive Tgfb1, disturbs the systems controlling BP (12). In humans, the 915C allele of a single nucleotide polymorphism in TGFB1, which leads to proline at residue 25 within the signal peptide sequence, has been associated in a European population with a reduced risk of hypertension (13). The 897C allele of a second polymorphism, which leads to proline at residue 10 within the signal peptide sequence, has been associated in an Asian population with an increased risk of hypertension (14, 15), but whether or how the changes directly affect BP has not been determined.
These studies document the complex effects on the cardiovasculature that result from changes in TGFβ1 function. However, no clear picture emerges of the effects of inherited variations that simply change the basal level of TGFβ1 expression without altering the amino acid sequences of the polypeptides that result. This type of information is of particular importance when amino acid sequences are as highly conserved as are those of the TGFβ1 polypeptides. Thus, 111 of the 112 residues that comprise the TGFβ1 active product are identical in the mouse and human, and large stretches in the remaining 278 residues of the TGFβ1 precursor are also identical (16).
Accordingly, we have generated mice having Tgfb1 expression ∼10%, 50%, 200%, and 300% normal, which covers the range likely in the general human population. We find that multiple parameters known to regulate BP or respond to changes in it are affected in a remarkably proportionate manner by these changes in Tgfb1 expression, indicating that even modest inherited changes in the expression of the human TGFB1 gene are likely to have significant cardiovascular effects.
Results
Generation of Hypo/Hypermorphic Mice for TGFβ1.
As a preliminary to using gene targeting to generate mice expressing altered levels of TGFβ1, we first used our published system (17) to compare the relative effects on mRNA stability of the 3′-untranslated region (UTR) of Tgfb1 compared with a panel of other 3′-UTRs. This test indicated that we could obtain informatively low and high levels of TGFβ1 expression by using gene targeting to replace the natural 3′-UTR of the Tgfb1 with the unstable 3′-UTR of the FBJ osteosarcoma oncogene (Fos) or with the stable 3′-UTR from the bovine growth hormone gene (bGH) (Fig. S1 A–C).
To obtain the desired mice, we used a targeting procedure (17), which initially generates a form of the Tgfb1 gene (Tgfb1L) that gives low expression because it produces an unstable mRNA having the 3′-UTR from Fos (Fig. 1 A, lines A–C, and B); after exposure to Cre recombinase, the low-expressing allele is converted into a high-expressing form (Tgfb1H) because it produces a very stable mRNA having the 3′-UTR from bGH (Fig. 1 A, line D). Targeting was with C57BL/6-derived embryonic stem cells, and the resulting Tgfb1L/+ mice were maintained as C57BL/6 inbreds. Tgfb1L/+ mice were mated with inbred C57BL/6 mice carrying a ubiquitously expressed Cre recombinase to generate Tgfb1H/+ mice. Subsequent matings of mice carrying the low and high expressing alleles, yielded mice with the following five genotypes: Tgfb1L/L (L/L), Tgfb1L/+ (L/+), Tgfb1+/+ (WT), Tgfb1H/+ (H/+), and Tgfb1H/H (H/H) mice. These mice express graded levels of Tgfb1 mRNA relative to their wild-type (WT) littermates in all six tissues tested (Fig. 1B). A two-way ANOVA test showed that the differences in relative Tgfb1 expression due to genotype (P < 10−4) were not affected by tissue (P = 0.89), and there was no interaction between genotype and tissue (P = 0.98). The averaged values of Tgfb1 mRNA expression from the six tissues relative to WT (100%) of the five types of mice are 10 ± 7% for L/L, 62 ± 6% for L/+, 100 ± 7% for WT 182 ± 7% for H/+, and 293 ± 7% for H/H. The levels of active TGFβ1 protein in the plasma of mice with the five genotypes increased in proportion to the mRNA levels and spanned a range from ∼20% to ∼200% normal (Fig. 1C). The relative amounts of phosphorylated Smad2 (p-Smad2), which reflects the activity of intracellular TGFβ signaling, in the kidneys of mice of the five genotypes also increased in proportion to the Tgfb1 mRNA levels (Fig. 1D).
Fig. 1.

Generation of mice having genetically graded expression of TGFβ1. L/L, Tgfb1L/L; L/+, Tgfb1L/+; WT, Tgfb1+/+; H/+, Tgfb1H/+; and H/H, Tgfb1H/H. *P < 0.05, **P < 0.01, †P < 0.001, ††P < 10−4, ‡P < 10−5 vs. WT. (A) The targeting strategy. (A, line A) The target locus is Tgfb1. Coding sequences and the endogenous 3′-UTR of the Tgfb1 gene are shown as black and white columns. (A, line B) The targeting vector contains a loxP sequence, the c-Fos 3′-UTR (blue), two copies of a transcriptional insulator (cHS) from the chicken β-globin gene (yellow), a Neo gene with the MC1 promoter (pMC1), loxP, and the 3′-UTR of the bovine growth hormone gene (bGH3′-UTR, red). The insulators minimize interference between the Tgfb1 promoter and pMC1. TK, thymidine kinase gene. (A, line C) The locus after homologous recombination. TGFβ1 expression is now controlled by the 3′-UTR of Fos [“low” (L) allele], which destabilizes the TGFβ1 mRNA and decreases TGFβ1 protein. (A, line D) The locus after Cre-lox P recombination. TGFβ1 expression is controlled by the 3′-UTR of bGH [“high” (H) allele], which stabilizes TGFβ1 mRNA and increases TGFβ1 protein. Gene targeting was confirmed by PCR with primers (F and R) and by a Southern blot (Fig. S2) with tail genomic DNA digested by Nco I radiolabeled with a probe (P). (B) The mRNA levels of TGFβ1 in different tissues in the five genotypes of 12-wk-old male mice. (C) Plasma concentrations of TGFβ1 in the five genotypes of 12-wk-old male mice. (D) Phosphorylated Smad2 in the hearts of 12-wk-old male mice of the five genotypes.
We conclude that the four types of mice generated by our gene targeting procedure have Tgfb1 mRNA expression of ∼10%, 50%, 200%, and 300% normal, which covers the range likely to occur in the general human population.
Blood Chemistry and Hematology of the TGFβ1 Hypo/Hypermorphic Mice.
Plasma glucose, plasma insulin, plasma urea nitrogen, plasma creatinine, plasma sodium, plasma chloride, and plasma osmolarity (Tables S1 and S2) were indistinguishable from WT in all of the mice at age 12 wk except that plasma potassium of the L/L mice was significantly less than WT (4.9 ± 0.1 mEq/L and 5.7 ± 0.1 mEq/L; P for L/L vs. WT <10−4).
Hematocrits of the L/L, L/+, H/+, and H/H mice were indistinguishable from WT (Tables S1 and S2).
Adrenocortical Function in the TGFβ1 Hypo/Hypermorphic Mice.
Plasma aldosterone levels increased progressively as the genetically controlled expression of Tgfb1 decreased, ranging from ∼50% below WT in the H/H mice to ∼200% of WT in the L/L mice (Fig. 2A). Plasma corticosterone levels (Fig. 2B) were significantly higher than normal in the L/L mice (329 ± 57 and 145 ± 23 ng/mL; P for L/L vs. WT <0.01).
Fig. 2.

Adrenocortical function in the TGFβ1 hypo/hypermorphic mice at age 12 wk. *P < 0.05, **P < 0.01, †P < 0.001, ††P < 10−4, ‡P < 10−5 vs. WT. (A) Plasma aldosterone levels. (B) Plasma corticosterone levels. (C) The mRNA levels for enzymes required for aldosterone synthesis in the adrenal gland. (D) Plasma volume. BW, body weight.
Adrenal mRNA expression of the two genes that determine the mitochondrial enzymes directly involved in the synthesis of corticosterone and its product aldosterone, 11 beta hydroxylase (Cyp11b1) and aldosterone synthase (Cyp11b2), closely matched the progressive changes in plasma aldosterone levels (Fig. 2C). Other genes involved in steroidogenesis, steroidogenic acute regulatory protein (Star), hydroxy-delta-5-steroid dehydrogenase, 3 beta- and steroid delta-isomerase 1 (Hsd3b1), and 21-hydroxylase (Cyp21a1), had increased expression when Tgfb1 expression was below normal, although only in the L/L adrenals did this reach significance (Fig. 2C).
Microscopic examination of the adrenals showed no structural abnormalities, such as nodular hyperplasia, in any of the mice (Fig. S3), but the adrenal weight normalized to body weight was doubled in the L/L mice (0.155 ± 0.014% body weight vs. 0.082 ± 0.007% body weight; P L/L vs. WT <0.05; Tables S1 and S2).
Together these data demonstrate that genetically determined changes in Tgfb1 expression from above to below normal cause a parallel shift in aldosterone and corticosterone production from above to below normal, largely due to altered expression of the genes for mineralocorticoid synthesis in the adrenal cortex of the mice.
Plasma Volumes of the TGFβ1 Hypo/Hypermorphic Mice.
Plasma volumes of the mice as a percentage of their body weights ranged from ∼50% below normal in the H/H mice to ∼50% above normal in the L/L mice (Fig. 2D). However, despite these progressive changes in plasma volumes, the plasma vasopressin concentrations in L/L and WT mice were not significantly different [WT (n = 5): 7.1 ± 0.7 pg/mL vs. L/L (n = 6): 7.4 ± 1.4 pg/mL, P = 0.84]. Nor were plasma adrenocorticotropic hormone (ACTH) [WT (n = 5): 280 ± 37 pg/mL vs. L/L (n = 5): 291 ± 39 pg/mL, P = 0.85] or cardiac expression of atrial natriuretic peptide different from WT [WT (n = 6): 100 ± 16% vs. Tgfb1L/L (n = 6): 64 ± 9%, P = 0.11]. These observations suggest that the most likely factor determining the progressive changes in plasma volume is a shift in sodium reabsorption caused by the progressive changes in plasma aldosterone levels resulting from the genetically determined differences in Tgfb1 expression.
Blood Pressure in the Tgfb1 Hypo/Hypermorphic Mice.
The L/L mice had a markedly higher systolic blood pressure (sBP) than WT whether studied with a tail-cuff method (138 ± 3 mmHg vs. 106 ± 3 mmHg; P < 10−5) or by telemetry (146 ± 3 mmHg vs. WT 120 ± 2 mmHg; P < 10−5); the pulse rate of the L/L mice was substantially lower than WT by both methods (by telemetry, 494 ± 16 beats/min vs. 661 ± 15 beats/min; P < 0.001); the sBPs and pulse rates of the other mice were indistinguishable from WT (Fig. 3 A–D).
Fig. 3.
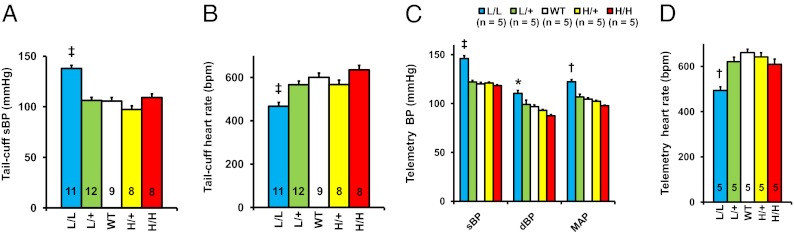
Elevated arterial pressure and decreased heart rate in L/L male mice at age 12 wk. (A) Systolic blood pressure (sBP) in L/L, L/+, WT, H/+, and H/H mice determined with a tail-cuff method. ‡P < 10−5 vs. WT. (B) Heart rate in the five genotypes of mice with a tail-cuff method. ‡P < 10−5. (C) Systolic blood pressure (sBP), diastolic blood pressure (dBP), and mean arterial pressure (MAP) studied with telemetry in the five genotypes of mice. ‡P < 10−5 vs. WT. (D) Heart rate in the five genotypes of mice with telemetry. ††P < 10−4 vs. WT.
Graded Changes in the Renin-Angiotensin System in TGFβ1 Hypo/Hypermorphs.
Multiple changes occurred in the renin–angiotensin system in response to the genetically controlled changes in Tgfb1 expression, all in the direction that would be expected to maintain normal blood pressure in the face of either abnormally low or high blood volumes. Thus, the plasma concentration of angiotensin II ranged from ∼30% normal in the L/L mice to ∼200% normal in the H/H mice in inverse correlation with the plasma volumes (Fig. 4A). Plasma renin levels, Renin 1c (Ren1c) mRNA levels in the kidney, Angiotensin converting enzyme (Ace) mRNA levels in the lung, and Angiotensinogen (Agt) mRNA levels in the liver all show similar changes, although the L/L and H/H mice had proportionately greater responses than the L/+ and H/+ mice (Fig. 4 B and C).
Fig. 4.

Renin–angiotensin–aldosterone system in L/L, L/+, WT, H/+, and H/H male mice at age 12 wk. *P < 0.05, **P < 0.01, †P < 0.001, ††P < 10−4 vs. WT. (A) Angiotensin II levels in the plasma. (B) Active renin concentration in the plasma. (C) Tissue mRNA levels for the components of renin–angiotensin system.
Nitric Oxide and the Other Blood Pressure-Controlling Systems in TGFβ1 Hypomorphs.
Because previous studies suggest that both TGFβ1 and aldosterone affect the activity and/or expression of endothelial nitric oxide (NO) synthase (eNOS) (18, 19), the hypertension in the L/L mice could be due partly to a decrease in eNOS function. To evaluate this possibility, we measured protein content of serine1177-phosphorylated eNOS in the kidney and found it to be greater in the L/L mice than in WT (Fig. 5A), although threonine495-phosphorylated eNOS, total eNOS, and eNOS mRNA levels are comparable between the two genotypes (Fig. 5 B, C, and F). Likewise, the protein content of serine473-phosphorylated serine/threonine protein kinase Akt (Akt) is greater in the L/L mice than in WT, although the content of total Akt is comparable between the two genotypes (Fig. 5 D and E).
Fig. 5.

Nitric oxide (NO) system in the kidney of WT and L/L male mice at age 12 wk. *P < 0.05, †P < 0.001 vs. WT. (A) Ser1177-phosphorylated endothelial NO synthase (eNOS; %WT). (B) Thr495-phosphorylated eNOS (%WT). (C) Total eNOS (%WT). (D) Ser473-phosphorylated Akt (%WT). (E) Total Akt (%WT). (F) eNOS mRNA levels (%WT). (G) Inducible NOS mRNA levels (%WT). (H) Neuronal NOS mRNA levels (%WT). (I) Plasma nitrite/nitrate (NO2−/NO3−) levels (μmol/L).
In contrast to a previous finding that the expression of inducible NOS and the serum levels of NO2−/NO3− (end products of NO metabolism) are markedly increased in TGFβ1-null mice (20), we did not find significant differences between WT and L/L mice in these parameters (Fig. 5 G and I), although the renal expression of neuronal NOS was significantly decreased in the L/L mice (Fig. 5H). From these results, we conclude that the NO system is unlikely to play a causative role in the high blood pressure in the L/L mice.
Additionally, parameters of the activities of several other systems related to BP control did not differ in the L/L and WT mice, including metanephrine [WT (n = 6): 47.5 ± 5.5 pg/mL vs. L/L (n = 6): 38.6 ± 2.9 pg/mL, P = NS] and normetanephrine [WT (n = 6): 668 ± 87 pg/mL vs. L/L (n = 6): 792 ± 89 pg/mL, P = NS], indicators of adrenergic activity, and triiodothyronine [WT (n = 6): 0.97 ± 0.02 pg/mL vs. L/L (n = 6): 0.89 ± 0.07 pg/mL, P = NS] and thyroxine [WT (n = 6): 3.01 ± 0.13 pg/mL vs. L/L (n = 6): 2.65 ± 0.26 pg/mL, P = NS], indicators of thyroid activity.
Water and Electrolyte Balance in TGFβ1 Hypo/Hypermorphic Mice.
Food intake normalized to body weight did not differ in the five genotypes (Fig. 6A), but the water intake of the L/L mice was almost twice normal (Fig. 6B). In contrast, the urine volume and osmolarity in the L/L mice were less than one-fifth normal (Fig. 6 C and G). Their daily excretion of sodium, potassium, and chloride was similarly reduced (Fig. 6 D–F), although as described above, their plasma sodium and chloride concentrations and plasma osmolarity were normal (Tables S1 and S2).
Fig. 6.

Metabolic study data in L/L, L/+, WT, H/+, and H/H male mice at age 12 wk. BW, body weight. *P < 0.05 vs. WT, †P < 0.001 vs. WT. (A) Food consumption. (B) Water consumption. (C) Urine volume. (D) Urinary sodium excretion. (E) Urine potassium excretion. (F) Urinary chloride excretion. (G) Urine osmolarity.
Because of the marked difference between oral intake and urinary output of water and electrolytes in the L/L mice, we compared nonurinary routes of output in WT and L/L mice. Fecal excretion of electrolytes was not significantly different in the L/L mice when normalized by body weight (Fig. S4 A–C). However, electrolytes in the hair were greater in the L/L mice than WT (Fig. S5) and their metabolic cages tended to show water condensation, suggesting that they might be losing water in an attempt to maintain normal body temperature. Evidence favoring this possibility was our finding that the L/L mice have twice normal locomotive activity, a 1.1 °C increase in body temperature, and a heat production that is 1.3 times WT (Fig. S6 A–C).
Thus, the L/L mice are able to maintain near normal plasma electrolyte levels (except K+) and electrolyte balance despite their increased water intake and considerable loss of water and electrolytes via extrarenal mechanisms.
Renal Function in TGFβ1 Hypo/Hypermorphic Mice.
Renal histology in the mice with differences in Tgfb1 expression revealed no significant differences from WT (Fig. S7). Nor were glomerular filtration rates and plasma concentrations of urea nitrogen and creatinine different from WT (Fig. S8 and Tables S1 and S2), indicating that kidney function in the mice is normal at 12 wk age when the general effects of different levels of Tgfb1 are already fully developed.
Renal mRNA levels in the L/L mice of genes related to tubular water and sodium transport were indistinguishable from WT (Fig. S9). However, in contrast to this absence of differences in the mRNA expression of the genes that encode the α, β, and γ subunits of Na+-K+ ATPase (NK; Fig. S9), the activity of NK in kidney homogenates proved to be markedly increased in the L/L mice (2.7 times normal in the L/L vs. WT; P < 0.01; Fig. 7A). This increased NK activity in turn was associated with reduced phosphorylation of Ser residues of NKα1 in the L/L mice (0.69 times WT; P < 0.05; Fig. 7B), although the amount of NKα1 protein was not different from WT (Fig. 7C).
Fig. 7.

Renal function in TGFβ1 hypomorphic mice. *P < 0.05, **P < 0.01 vs. WT. †P < 0.05 vs. WT Veh; ††P < 0.05 vs. L/L Veh. (A) Renal activity of Na+-K+ ATPase (NK) studied by ouabain-sensitive conversion of ATP to inorganic phosphate. (B) Ser phosphorylation of NKα1. (C) Abundance of NKα1 protein. (D) Total ENaC activity in WT and L/L mice treated with vehicle (Veh), spironolactone (Spi; 50 mg/kg/d for 7 d), and DOCA (120 mg/kg/d for 3 d). (E) ENaC open probability (Po). (F) Functional ENaC expression (fN).
Likewise, although the mRNA expression in the L/L mice of the genes Scnna, Scnnb, and Scnng did not differ from WT, total epithelial sodium channel (ENaC) activity proved to be markedly greater (2.0 times WT) in L/L than in WT mice due to increased ENaC open probability (1.5 times WT) and functional ENaC expression (1.6 times WT). Systemic elevation of mineralocorticoids by deoxycorticosterone acetate (DOCA) injection increased ENaC activity 1.9-fold in WT but had no further stimulatory effect in L/L mice, indicating that their ENaC was near maximally activated (Fig. 7 G–J).
We conclude that, although the amounts of NK and ENaC proteins and the corresponding mRNAs are not increased in the L/L mice, tubular sodium reabsorption is increased by supernormal activation of the proteins.
Pharmacological Normalization of the Hypertension of the Tgfb1 10% Hypomorphs.
Pharmacological tests showed that spironolactone (a mineralocorticoid receptor antagonist), at levels that did not significantly change the BP of the WT mice, decreased the BP and the plasma volume and increased urinary sodium of the L/L mice to levels indistinguishable from WT (Fig. 8 A–C, Table S3); it also decreased total ENaC activity in both L/L and WT mice to ∼35% of untreated WT and abolished the difference in ENaC activity between L/L and WT (Fig. 7D). Amiloride (an ENaC inhibitor) also normalized the BP, plasma volume, and urinary sodium of the L/L mice (Fig. 8 A–D). In contrast, aliskiren (a renin inhibitor), losartan (an antagonist for angiotensin II type 1 receptor), when given at doses that significantly decreased the sBP of WT, did not normalize the BP of the L/L mice (Fig. 8A). Furosemide (a loop diuretic) decreased the sBP of the L/L and WT mice independently of genotype, while Nω-nitro-L-arginine methyl ester (NAME; a NOS inhibitor) increased their sBP, likewise independently of genotype. (Fig. 8A, Table S3).
Fig. 8.

Pharmacological normalization of the hypertension of the Tgfb1 10% hypomorphs. (A) Systolic blood pressure (sBP) with a tail-cuff method in 12-wk-old WT (white columns) and L/L (black columns) mice administered vehicle (Veh), aliskiren (Ali; 40 mg/kg/d i.p.), losartan (Los; 10 mg/kg/d i.p.), spironolactone (Spi; 50 mg/kg/d i.p.), amiloride (Ami; 3 mg/kg/d i.p.), furosemide (Fur; 40 mg/kg/d i.p.), or Nω-nitro-L-arginine methyl ester (NAME; 30 mg/kg/d i.p.) for 2 wk. *P < 0.05, **P < 0.01, †P < 0.001, ††P < 10−4 vs. the vehicle-treated group of the same genotype. NS, no significant difference. (B) Plasma volume in WT and L/L mice without and with spironolactone or amiloride. (C) Urinary sodium excretion. BW, body weight. †P < 0.001 vs. WT.
We conclude that the effects of changes in Tgfb1 expression on sBP and plasma volume are due to changes in NK and ENaC activity mediated by the mineralocorticoid receptor and are correctable by inhibitors of the receptor or of ENaC.
Discussion
The mice generated in the present study have Tgfb1 mRNA expression graded in five steps from 10% normal in the L/L mice to 300% normal in the H/H mice. No inflammatory cell infusions were observed in the tissues of any of our mice. Thus, even 10% normal expression of Tgfb1 is sufficient to prevent the multifocal inflammatory disease that develops in mice unable to synthesize the protein (9, 10). Plasma levels of active TGFβ1 and renal expression of p-Smad2 were closely correlated with the expression of Tgfb1, indicating that the activity of intracellular TGFβ signaling is proportionately modified in our mice. Accordingly, these mice have allowed us to determine the consequences of genetically determined differences in Tgfb1 expression covering levels that include those that might be expected to occur in human populations. The primary finding from our studies of these mice is that both increases and decreases in Tgfb1 expression cause marked progressive changes in multiple systems that regulate blood pressure.
The major effects of Tgfb1 expression on blood pressure regulating systems prove to be mediated by changes in adrenocortical function. Thus, we find, in agreement with previous in vitro experiments with cultured human adrenocortical cells (21), that higher than normal levels of TGFβ1 lead to decreases in the expression of the genes, Cyp11b1 and Cyp11b2, that control the synthesis of corticosterone and aldosterone, whereas lower than normal levels of TGFβ1 lead to increased expression of these genes. We also find, in agreement with previous in vitro experiments with cultured bovine adrenocortical cells (22), that higher than normal levels of TGFβ1 lead to decreases in the expression of the genes, Star and Hsd3b1, which control the synthesis of corticosteroids, whereas lower than normal levels of TGFβ1 lead to increased expression of these genes. Plasma volumes range from 50% below normal in the H/H mice to 50% above normal in the L/L mice. The increased plasma volume of the L/L mice is accompanied by increased ENaC activity in the kidney and hence with increased sodium reabsorption. Marked compensatory changes in the renin–angiotensin system accompany the changes in plasma volumes, and are sufficient in the H/H, H/+, and L/+ mice to maintain normal systolic blood pressure, even though plasma volumes and diastolic blood pressure are still abnormal. The L/L mice, in contrast, develop severe hypertension, despite having renin levels less than 30% of normal. Their aldosterone/renin ratios are more than six times normal, and they can reasonably be classified as having secondary hypertension due to primary aldosteronism comparable to that seen in humans with idiopathic bilateral adrenal hyperplasia. The hypertension and aldosteronism of the L/L mice are completely corrected with subpressor doses of a mineralocorticoid receptor antagonist, spironolactone, or an ENaC inhibitor, amiloride, or less completely with a loop diuretic, furosemide. However, their hypertension is not normalized with a renin inhibitor, aliskiren, or an angiotensin II receptor blocker, losartan, even at doses that decrease the blood pressure of WT mice. Thus, the low expression of Tgfb1 in the hypomorphs leads to primary aldosteronism, plasma overload, and a form of resistant hypertension.
In humans, hypertension attributable to either an adrenal tumor or adrenal hyperplasia is one of the more common forms of secondary hypertension. Resistant hypertension, defined as a failure to achieve goal blood pressure in a patient who adheres to the maximum tolerated doses of three antihypertensive drugs of different classes, including a diuretic, is a clinical problem also thought to be relatively common and projected to increase (23, 24). Volume expansion is a frequent pathogenic finding in such patients (23). Whereas we have not studied the effects of multiple antihypertensive agents on the hypertension of our L/L mice, they are resistant to renin-based drugs probably because their renin–angiotensin system is maximally down-regulated. They clearly have abnormal plasma volumes, as do the H/H mice and to a lesser extent the L/+ and H/+ mice. These findings suggest that decreased TGFB1 expression should be considered as a possible factor in patients with resistant hypertension and volume expansion.
In summary, our experiments demonstrate that mice with modest genetically determined increases or decreases in Tgfb1 expression have significant progressive disturbances in their regulation of blood pressure and plasma volume. Mice with 10% normal Tgfb1 expression develop primary aldosteronism and markedly impaired diuresis and natriuresis. Thus, TGFβ1 plays a critical physiological role in controlling blood pressure and maintaining fluid homeostasis. Similar progressive effects can be expected in humans who have genetic changes that affect the expression of the TGFB1 gene or its signaling pathways.
Materials and Methods
We generated TGFβ1 hypomorphic mice by replacing the 3′-UTR of the Tgfb1 gene with the 3′-UTR of the Fos gene (Fig. 1A). The gene targeting vector used for this purpose was constructed from the backbone “low-high vector with insulators” generated by M.K., using the “low-high vector” generated by H.-S.K., and originally the “OS-dupdel vector” generated by O.S. The low-high cassette was inserted by homologous recombination into the Tgfb1 locus of the embryonic stem cell, which is on a C57BL/6 genetic background. The 5′ short homology arm (1.0 kb) immediately 5′ to the stop codon was amplified by PCR with primers as follows: Forward 5′-TCATGGGACTGTTgctagcC-3′; Reverse 5′-TTTctcgagTTCAGCTGCACTTGCAGGAG-3′ (lowercase indicates restriction sites: NheI and XhoI). The 3′-long homology arm (4.6 kb) 3′ to the Tgfb1 3′-UTR was excised with HindIII and KpnI from the BAC clone RP23-421O10 (Invitrogen). The PCR screening of the targeted ES cell clones was performed with primers as follows (amplicon: 1156 bp): Forward 5′-GAGTGCTCATGGGACTGTTG-3′ (immediately 5′ to the short arm); Reverse 5′-TCCTCTCTGTAATGCACCAG-3′ (Fos 3′-UTR). The gene targeting was confirmed by Southern blot using the short arm of the targeting construct as the probe and genomic DNA (5 μg) digested by NcoI. Genotyping of TGFβ1 hypomorphic mice was also performed based on the presence or absence of the 3′-UTR of Tgfb1 and bGH with real-time quantitative PCR (ABI 7700 Sequence Detection system; Perkin-Elmer) using the toe DNA as a template. The primers and probes used for the genotyping are shown in Table S4.
The globally TGFβ1 hypermorphic mice (Tgfb1H/+ and Tgfb1H/H mice) were generated on the C57BL/6 genetic background by obtaining offspring from the Tgfb1L/+ male mice having a tamoxifen-inducible ubiquitously expressed Cre recombinase transgene (Jackson Laboratories)-injected tamoxifen (50 mg⋅kg−1⋅d−1 i.p. in sesame oil for 5 d). The effects of spironolactone (50 mg⋅kg−1⋅d−1 i.p. for 4 wk) and amiloride (3 mg⋅kg−1⋅d−1 i.p. for 4 wk) in 12-wk-old Tgfb1L/L mice were also studied.
Our experiments were approved by the University of North Carolina Institutional Animal Care and Use Committee.
Other methods are described in SI Materials and Methods.
Supplementary Material
Acknowledgments
This work was supported by National Institutes of Health Grants HL49277, HL70523, HL71266, DK20593, DK59637, DK056350, and DK34987; a grant from the American Heart Association (SDG2230391); a grant from the Swedish Heart and Lung Foundation; a grant from the Swedish Research Council (32X-10860); and a Career Development Award (2-2006-108) from the Juvenile Diabetes Research Foundation.
Footnotes
The authors declare no conflict of interest.
This article contains supporting information online at www.pnas.org/lookup/suppl/doi:10.1073/pnas.1302641110/-/DCSupplemental.
References
- 1.Cordenonsi M, et al. Links between tumor suppressors: p53 is required for TGF-beta gene responses by cooperating with Smads. Cell. 2003;113(3):301–314. doi: 10.1016/s0092-8674(03)00308-8. [DOI] [PubMed] [Google Scholar]
- 2.Derynck R, Akhurst RJ, Balmain A. TGF-beta signaling in tumor suppression and cancer progression. Nat Genet. 2001;29(2):117–129. doi: 10.1038/ng1001-117. [DOI] [PubMed] [Google Scholar]
- 3.Zhou L, et al. TGF-beta-induced Foxp3 inhibits T(H)17 cell differentiation by antagonizing RORgammat function. Nature. 2008;453(7192):236–240. doi: 10.1038/nature06878. [DOI] [PMC free article] [PubMed] [Google Scholar]
- 4.Muraoka RS, et al. Blockade of TGF-beta inhibits mammary tumor cell viability, migration, and metastases. J Clin Invest. 2002;109(12):1551–1559. doi: 10.1172/JCI15234. [DOI] [PMC free article] [PubMed] [Google Scholar]
- 5.Yang X, et al. Targeted disruption of SMAD3 results in impaired mucosal immunity and diminished T cell responsiveness to TGF-beta. EMBO J. 1999;18(5):1280–1291. doi: 10.1093/emboj/18.5.1280. [DOI] [PMC free article] [PubMed] [Google Scholar]
- 6.Janssens K, ten Dijke P, Janssens S, Van Hul W. Transforming growth factor-beta1 to the bone. Endocr Rev. 2005;26(6):743–774. doi: 10.1210/er.2004-0001. [DOI] [PubMed] [Google Scholar]
- 7.Clouthier DE, Comerford SA, Hammer RE. Hepatic fibrosis, glomerulosclerosis, and a lipodystrophy-like syndrome in PEPCK-TGF-beta1 transgenic mice. J Clin Invest. 1997;100(11):2697–2713. doi: 10.1172/JCI119815. [DOI] [PMC free article] [PubMed] [Google Scholar]
- 8.Mustoe TA, et al. Accelerated healing of incisional wounds in rats induced by transforming growth factor-beta. Science. 1987;237(4820):1333–1336. doi: 10.1126/science.2442813. [DOI] [PubMed] [Google Scholar]
- 9.Shull MM, et al. Targeted disruption of the mouse transforming growth factor-beta 1 gene results in multifocal inflammatory disease. Nature. 1992;359(6397):693–699. doi: 10.1038/359693a0. [DOI] [PMC free article] [PubMed] [Google Scholar]
- 10.Kulkarni AB, et al. Transforming growth factor beta 1 null mutation in mice causes excessive inflammatory response and early death. Proc Natl Acad Sci USA. 1993;90(2):770–774. doi: 10.1073/pnas.90.2.770. [DOI] [PMC free article] [PubMed] [Google Scholar]
- 11.Schultz JE, et al. TGF-beta1 mediates the hypertrophic cardiomyocyte growth induced by angiotensin II. J Clin Invest. 2002;109(6):787–796. doi: 10.1172/JCI14190. [DOI] [PMC free article] [PubMed] [Google Scholar]
- 12.Guzik TJ, et al. Role of the T cell in the genesis of angiotensin II induced hypertension and vascular dysfunction. J Exp Med. 2007;204(10):2449–2460. doi: 10.1084/jem.20070657. [DOI] [PMC free article] [PubMed] [Google Scholar]
- 13.Cambien F, et al. Polymorphisms of the transforming growth factor-beta 1 gene in relation to myocardial infarction and blood pressure. The Etude Cas-Témoin de l’Infarctus du Myocarde (ECTIM) Study. Hypertension. 1996;28(5):881–887. doi: 10.1161/01.hyp.28.5.881. [DOI] [PubMed] [Google Scholar]
- 14.Niu W. Evaluation of transforming growth factor beta-1 gene 869T/C polymorphism with hypertension: A meta-analysis. Int J Hypertens. 2011;2011:934265. doi: 10.4061/2011/934265. [DOI] [PMC free article] [PubMed] [Google Scholar]
- 15.Yan-Yan L. Transforming growth factor β1 +869T/C gene polymorphism and essential hypertension: A meta-analysis involving 2708 participants in the Chinese population. Intern Med. 2011;50(10):1089–1092. doi: 10.2169/internalmedicine.50.4967. [DOI] [PubMed] [Google Scholar]
- 16.Derynck R, Jarrett JA, Chen EY, Goeddel DV. The murine transforming growth factor-beta precursor. J Biol Chem. 1986;261(10):4377–4379. [PubMed] [Google Scholar]
- 17.Kakoki M, et al. Altering the expression in mice of genes by modifying their 3′ regions. Dev Cell. 2004;6(4):597–606. doi: 10.1016/s1534-5807(04)00094-2. [DOI] [PubMed] [Google Scholar]
- 18.Inoue N, et al. Molecular regulation of the bovine endothelial cell nitric oxide synthase by transforming growth factor-beta 1. Arterioscler Thromb Vasc Biol. 1995;15(8):1255–1261. doi: 10.1161/01.atv.15.8.1255. [DOI] [PubMed] [Google Scholar]
- 19.Nagata D, et al. Molecular mechanism of the inhibitory effect of aldosterone on endothelial NO synthase activity. Hypertension. 2006;48(1):165–171. doi: 10.1161/01.HYP.0000226054.53527.bb. [DOI] [PubMed] [Google Scholar]
- 20.Vodovotz Y, et al. Spontaneously increased production of nitric oxide and aberrant expression of the inducible nitric oxide synthase in vivo in the transforming growth factor beta 1 null mouse. J Exp Med. 1996;183(5):2337–2342. doi: 10.1084/jem.183.5.2337. [DOI] [PMC free article] [PubMed] [Google Scholar]
- 21.Liakos P, Lenz D, Bernhardt R, Feige JJ, Defaye G. Transforming growth factor beta1 inhibits aldosterone and cortisol production in the human adrenocortical cell line NCI-H295R through inhibition of CYP11B1 and CYP11B2 expression. J Endocrinol. 2003;176(1):69–82. doi: 10.1677/joe.0.1760069. [DOI] [PubMed] [Google Scholar]
- 22.Le Roy C, Li JY, Stocco DM, Langlois D, Saez JM. Regulation by adrenocorticotropin (ACTH), angiotensin II, transforming growth factor-beta, and insulin-like growth factor I of bovine adrenal cell steroidogenic capacity and expression of ACTH receptor, steroidogenic acute regulatory protein, cytochrome P450c17, and 3beta-hydroxysteroid dehydrogenase. Endocrinology. 2000;141(5):1599–1607. doi: 10.1210/endo.141.5.7457. [DOI] [PubMed] [Google Scholar]
- 23.Sarafidis PA, Bakris GL. Resistant hypertension: An overview of evaluation and treatment. J Am Coll Cardiol. 2008;52(22):1749–1757. doi: 10.1016/j.jacc.2008.08.036. [DOI] [PubMed] [Google Scholar]
- 24.Calhoun DA, et al. American Heart Association Professional Education Committee Resistant hypertension: Diagnosis, evaluation, and treatment: A scientific statement from the american heart association professional education committee of the council for high blood pressure research. Circulation. 2008;117(25):e510–e526. doi: 10.1161/CIRCULATIONAHA.108.189141. [DOI] [PubMed] [Google Scholar]
Associated Data
This section collects any data citations, data availability statements, or supplementary materials included in this article.