Abstract
The venom of cone snails (ssp. Conus), a genus of predatory mollusks, is a vast source of bioactive peptides. Conus venom expression is complex, and venom composition can vary considerably depending upon the method of extraction and the species of cone snail in question. The injected venom from Conus ermineus, the only fish-hunting cone snail species that inhabits the Atlantic Ocean, was characterized using nanoNMR spectroscopy, MALDI-TOF mass spectrometry, RP-HPLC and nanoLC–ESI-MS. These methods allowed us to evaluate the variability of the venom within this species. Single specimens of C. ermineus show unchanged injected venom mass spectra and HPLC profiles over time. However, there was significant variability of the injected venom composition from specimen to specimen, in spite of their common biogeographic origin. Using nanoLC–ESI-MS, we determined that over 800 unique conopeptides are expressed by this reduced set of C. ermineus specimens. This number is considerably larger than previous estimates of the molecular repertoire available to cone snails to immobilize prey. These results support the idea of the existence of a complex regulatory mechanism to express specific venom peptides for injection into prey. These intraspecies differences can be a result of a combination of genetic and environmental factors. The differential expression of venom components represents a neurochemical paradigm that warrants further investigation.
Keywords: Cone snails, Conus ermineus, Injected venom, Intraspecies variability, Molecular fingerprint, NanoNMR, LC–ESI-MS, Conopeptides
1. Introduction
The complex venoms from cone snail species have been the subject of intense studies [8,19], since they are a rich source of bioactive components that selectively modulate ion channels and neuronal receptors [24]. Although the biological relevance of these peptides is widely recognized, it is not fully known how the expression, maturation, and delivery of these toxins are regulated. In the vast majority of studies, the process of isolation and characterization of peptides from cone snail venom (conopeptides) has employed the use of dissected venom ducts with extracted venom material being pooled from multiple animals [5]. The use of multi-milligram quantities of dissected venom enables conopeptide isolation and characterization based on conventional bioanalytical and sequencing methods [13]. Dissected venom is presumably immature, and thus contains numerous endogenous components not necessarily intended for delivery to the prey. It is not fully understood how, when and where these conopeptides are produced, modified and transported in the venom duct, with subsequent tagging for delivery and actual injection by an individual animal to its prey during the capture process [6]. The process of extracting venom from the dissected venom ducts does involve the inclusion of most material present in the duct; therefore, dissected venom is more complex than injected venom, and quite different from the actual material intended for delivery to the prey [3,13].
The intraspecies variability of cone snails has been examined using dissected venom from individual snails; however, these studies have produced conflicting results. For example, variation in peptide profiles of the dissected venom of Conus textile specimens from the same location has been reported [3]. In contrast, dissected venom of Conus regius was found to be consistent from snail to snail, regardless of the gender, size of the animals, or season of collection [26]. Injected venom from Conus striatus and Conus catus shows significant intraspecies differences in the peptide composition [13]. It has been observed that the mixture of peptides found in injected venom is simpler than the venom mixture extracted from dissected duct of the same snail [13].
Several studies have used injected venom as starting material for conopeptide discovery and characterization [9,17,23,27]. However, these studies did not address the variations in the injected venom composition from snail to snail within a given species, since samples were pooled from multiple individuals in order to accumulate sufficient venom quantities for subsequent characterization. Therefore, prior to pooling venom destined for isolation and characterization, we decided to perform a comparative analysis of the conopeptide components of the injected venom from individual specimens within a species. Studying the injected venom provides the following advantages: (1) it provides the mature, biologically relevant peptide components used by the snail to subdue the prey, (2) it does not require sacrificing the animals, and (3) it can provide a source of conopeptides unique to a particular population of snails within a species. Here, we use the injected venom from Conus ermineus, the only fish-hunting species found in the Atlantic Ocean, collected over three years, and their venom composition was monitored for more than 5 months. The conopeptide composition of injected venom was characterized using nanoNMR, MALDI-TOF MS, RP-HPLC, and nanoLC–ESI-MS to obtain the venom profile of C. ermineus at various levels of molecular analysis. Injected venom from individual snails displays significant intraspecies variation of their conopeptide composition; however, the injected venom composition within each individual specimen remained relatively constant over time. These results support the existence of a complex regulatory mechanism for venom expression from the cone snail exogenome to select for specific conopeptides depending upon environmental variables during development. The variability of the injected venom significantly increases the diversity of the natural conopeptide library, and it has profound consequences for the discovery of neuroactive peptides from these animals.
2. Materials and methods
2.1. Specimen collection
All specimens of C. ermineus were collected by SCUBA diving at night at 15–30 m depths off the reef systems of Palm Beach County, FL, USA. Eight animals were captured at different time intervals (Table 1) and transferred to aquaria.
Table 1.
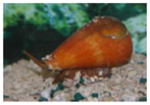
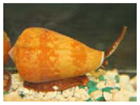
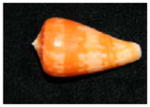
Conus ermineus specimens (60–85 mm shell length, FL, USA) used in this study were collected from coral reef-flats and maintained in aquaria. Specimens were measured, photographed and assigned a sequential number as they arrived.
| C. ermineus specimen | Shell length (mm) | Number of extractions | Days in aquaria |
|---|---|---|---|
C. ermineus 1

|
80 | 26 | 280 |
C. ermineus 2
|
78 | 154 | 1185 |
C. ermineus 3

|
75 | 15 | 94 |
C. ermineus 4
|
70 | 137 | 1126 |
C. ermineus 5
|
65 | 24 | 360 |
C. ermineus 6
|
70 | 16 | 238 |
C. ermineus 7
|
68 | 119 | 1048 |
C. ermineus 8

|
85 | 91 | 694 |
2.2. Injected venom extraction and feeding
Injected venom from captive C. ermineus was extracted as previously described [9]. Briefly, a snail was induced to inject venom into a 0.5 mL centrifuge Eppendorf vial covered with a latex membrane impregnated with pieces of fish fin (Fig. 1). C. ermineus was reluctant to strike unless the tip of its proboscis actually contacted fish tissue; the tail fin sufficed for this purpose. The collected venom was centrifuged in the vial for 10 s; the vials were then sealed and stored at −80 °C prior to analysis. Venom extractions were performed once a week. After the venom extraction procedure, the snails were immediately fed the same live fish used as bait (Fig. 1). The snails engulfed and swallowed the live fish, which were held with tweezers during the ingestion process. Commercially procured goldfish (Carassius auratus) were locally acquired for bait/feeding purposes.
Fig. 1.
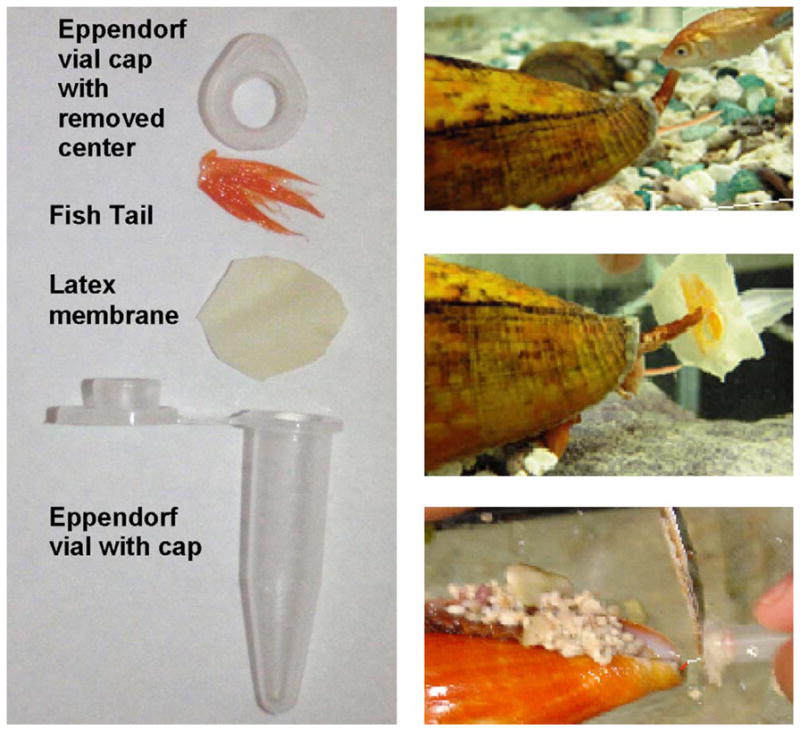
Injected venom extraction procedure: left panel shows the collection vial assembly. The right panel shows the collection procedures: a gold fish (Carassius auratus) is placed in front of the snail until it extends its proboscis (right upper corner). The collection vial (surrogate fish) is quickly substituted for the fish as the snail is about to strike (left middle panel); in right lower panel, once the snail has harpooned the collection tube, the harpoon is cut off and the vial is retrieved from aquaria for processing and storage.
2.3. NanoNMR spectroscopy
Single injections of venom from individual specimens of C. ermineus were dissolved in H2O and spiked with 5% D2O (v/v) containing 0.1 nmol of 3-(trimethylsilyl)-propionate (TSP) as an internal standard. The pH of these solutions was measured with a Thermo micro-pH probe. The solutions were then transferred to a 1.7 mm ID capillary NMR tube (Wilmad WG-1364–1.7). One-dimensional nanoNMR experiments were performed at 500 MHz on a Varian Inova spectrometer as previously described [18]. Spectra were acquired at 25 °C. Suppression of water was achieved by dpfgse [10]. Processing of data was performed using VNMR 6.1C software (Varian NMR Inc.). Chemical shifts were referenced to TSP with no temperature correction.
2.4. MALDI-TOF MS analysis of the injected venom and venom fractions
MALDI-TOF mass spectra were acquired using an AB Voyager-DE STR mass spectrometer in reflector mode (M/ΔM = 10000). Samples were prepared by spotting 0.2 μL of the injected venom or 0.2 μL of dried RP-HPLC fractions re-dissolved in 5 μL of H2O/ACN 40%/60% on 100ss well plates (Applied Biosystems) using a solution of α-cyano-4-hydroxycinnamic acid (HCCA, ACROS Organics, USA) matrix. HCCA solution was prepared by dissolving 10.0 mg of HCCA in 1 mL of 60% ACN in aqueous 0.1% TFA. The “sandwich” method [15] was used as the spotting technique which consists of matrix–sample–matrix applications. The spectrometer was calibrated by using Calmix-1 (Applied Biosystems) as external standard.
2.5. Analytical RP-HPLC of injected venom
Analytical RP-HPLC was performed using a 238SL54 Everest™ analytical monomeric Vydac C18 column (4.6 mm ID × 250 mm). Elution gradients were run using two solutions; solution A = 0.1% TFA/water, and solution B = 60% ACN in 0.1% TFA/water. Samples were dissolved in 0.1% TFA and the gradient ran from 100% solution A to 100% solution B in 100 min. Two different injected venom sampling methods were used: (1) venom was extracted from each specimen and diluted in 100 μL of 0.1% TFA H2O and (2) venom was pooled (four to five injections) in order to analyze the minor components from each snail.
2.6. Nanoflow LC–ESI-MS analysis of the injected venom and analytical RP-HPLC fractions
Nanoflow LC–ESI-MS (nanoLC–ESI-MS) was performed using an Eskigent NanoLC-1D HPLC pump coupled to nano-electrospray ionization source on an AB QSTAR®XL Q-TOF mass spectrometer. Separations were carried out on a capillary Everest Vydac column 238EV5.07505, running a gradient from 100% solution A (0.1% FA/water) to 100% solution B (60% ACN in 0.1% FA/water) over 120 min with a flow rate of 200 nL/min. Analysis of the mass chromatograms was carried out using the Analyst®QS software (Applied Biosystems). Two different sampling methods were utilized for nanoLC–ESI-MS: (1) 0.2 μL of a single injection of venom was diluted in 40 μL of 0.2% FA in H2O, and (2) pooled venom (5 injections) from the same specimen was subjected to analytical RP-HPLC fractionation. After drying (Speedvac), the samples were re-dissolved in 5 μL of 0.2% FA in H2O/ACN 40%/60% and subjected to nanoLC–ESI-MS.
Mass spectra were collected over the range of 400–10,000 Da in a positive ion mode, operating at a resolution of 10,000 Da (M/ΔM). The Analyst QS software was used to perform the mass/ion extractions, deconvolution of multiple charged peaks, and peptide molecular mass reconstruction using Bayesian methods [4]. A 0.5 Da threshold was used to designate mass uniqueness among closely related molecular ions.
2.7. Peptide sequencing
Selected RP-HPLC fractions from the injected venom (pooled within individuals) of C. ermineus were sequenced using Edman degradation. Prior to sequencing, peptides were reduced and alkylated as previously described [18] with slight modifications. An aliquot of each peptide (~1 pmol) was dried and then re-dissolved in 0.1 M Tris–HCl (pH 7.4), 5 mM EDTA, and 0.1% sodium azide, and then reduced with 6 mM DTT. Following incubation at 60 °C for 30 min, peptides were alkylated in a final volume of 15 μL with 20 mM IAM and 2 μL of NH4OH (pH 10.5) at room temperature for 1 h in the dark. The reduced and alkylated peptides were purified using a Zip Tip (C18, size P10, Millipore). Alkylated peptides were adsorbed onto Biobrene-treated glass fiber filters, and amino acid sequencing was carried out by Edman degradation using an Applied Biosystems Procise model 491A protein sequencer. Conopeptide sequences were classified into frameworks and given specific designations according to current nomenclature standards [27].
3. Results
3.1. C. ermineus behavior in aquaria
Eight specimens of C. ermineus were used in this study. Their sizes varied from 65 to 85 mm in length. For this species, these animals are considered large adults. The pattern and coloration of the shell varied considerably from one specimen to the next. Notably, half of the animals had a bright orange pigmentation, which is the citrinus variant of the species. Variation of shell pattern and pigmentation within Conus species are common, and individuals with different shell colors typically co-exist in the same habitat. Differences in shell pigmentation are associated with diet, and changes in pattern and colors occur in captivity. These animals came into captivity at different points in time and their duration in aquaria varied from 94 days to 1185 days. These specimens produced a total of 582 samples of injected venom. Table 1 summarizes the specifications for the animals used here. The amount of injected venom collected at each extraction varied from specimen to specimen, ranging from 5 to 20 μL per injection. This amount remained relatively the same from one injection to another within individual animals. Larger specimens produced more injected venom than smaller specimens. Typically, the presence of fish in the aquaria caused C. ermineus to emerge from its shell, or from the sand if buried, and extend their proboscis to attempt to capture the fish (Fig. 1). Occasional avoidance of the bait, failure to strike, or striking without significant venom production was observed.
3.2. Injected venom characterization by NMR
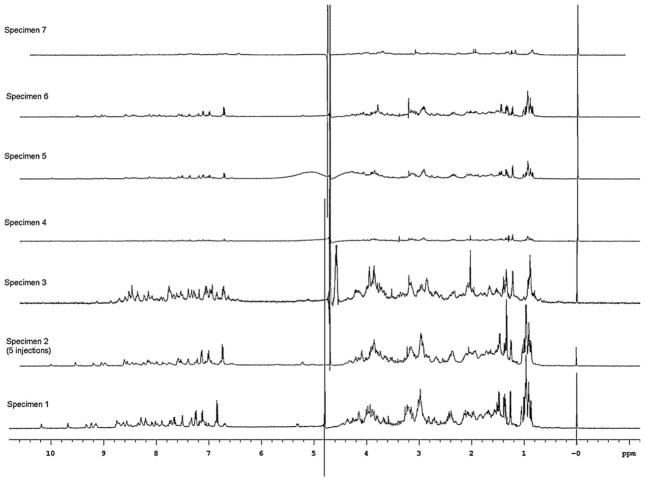
Since NMR is a non-destructive technique, an initial evaluation of the molecular differences in the venom was performed using nanoNMR techniques [18]. The 1H nanoNMR spectra of the injected venom were acquired for individual specimens of C. ermineus (Fig. 2). The 1H NMR of the injected venom produced a typical peptidic spectrum with distinct signals for HN + Haromatics (δ = 6.5–10.5 ppm), αH (δ = 3.8–6.0 ppm) and side chain protons (δ = 0.5–3.8 ppm). The 1H NMR spectrum, while complex, appears to be dominated by the signals from the major conopeptide in the venom. However, the complexity of the spectra varies from specimen to specimen, as additional signals were more significant for some samples. In the deshielded region (δ = 6.5–10.5 ppm), HNs showed peaks that were discrete and equal in intensity. In less complex samples (i.e. specimens 1 and 2), signals were less defined due to resonance overlap for other samples (i.e. specimen 3). Other salient features are the presence of characteristic assignable signals, such as the HNε of Trp (confirmed by TOCSY spectra, data not shown) around δ = 10 ppm and sharp side chain non-exchangeable protons from Tyr or Trp with i around 7 ppm. The rest of the spectra, ranging from δ = 0.5 to 6.0 ppm, show a very complex pattern which varies significantly for each sample. Most protons in this region are coupled to neighboring protons in complex patterns; however, prominent sharp signals (mostly singlets) appear at different chemical shifts depending on the sample. These singlets could be from small molecules or modified amino acids. Methyl signals from aliphatic protons (Val, Leu, Ile) clustered around δ = 0.9 ppm, whereas methyl signals from Ala and Thr residues resonate between δ = 1.2 and 1.6 ppm. These clusters exhibit characteristic patterns that vary from sample to sample. Likewise, the overall intensity of the NMR signals also varied according to specific samples, indicating large differences in their peptidic content.
Fig. 2.
1H nanoNMR spectra of the injected venom of C. ermineus. All samples are single injections of venom from the corresponding specimen number, except for specimen 2, where five injections were combined to obtain its spectra. Spectral intensities were adjusted using TSP as an internal standard, thus the spectra reflect the peptidic content of each sample; for specimen 2, a factor of 0.27X was used to maintain the spectral intensity in the same scale as the other spectra. All spectra were recorded at 25 °C and the pHs of the resulting NMR solution were as follows: specimen 1, pH 6.75; specimen 2, pH 7.14; specimen 3, pH 7.03; specimen 4, pH 7.13; specimen 5, pH 7.34; specimen 6, pH 7.17; specimen 7, pH 7.00. See Section 2 for experimental details.
3.3. Injected venom characterization by MALDI-TOF MS
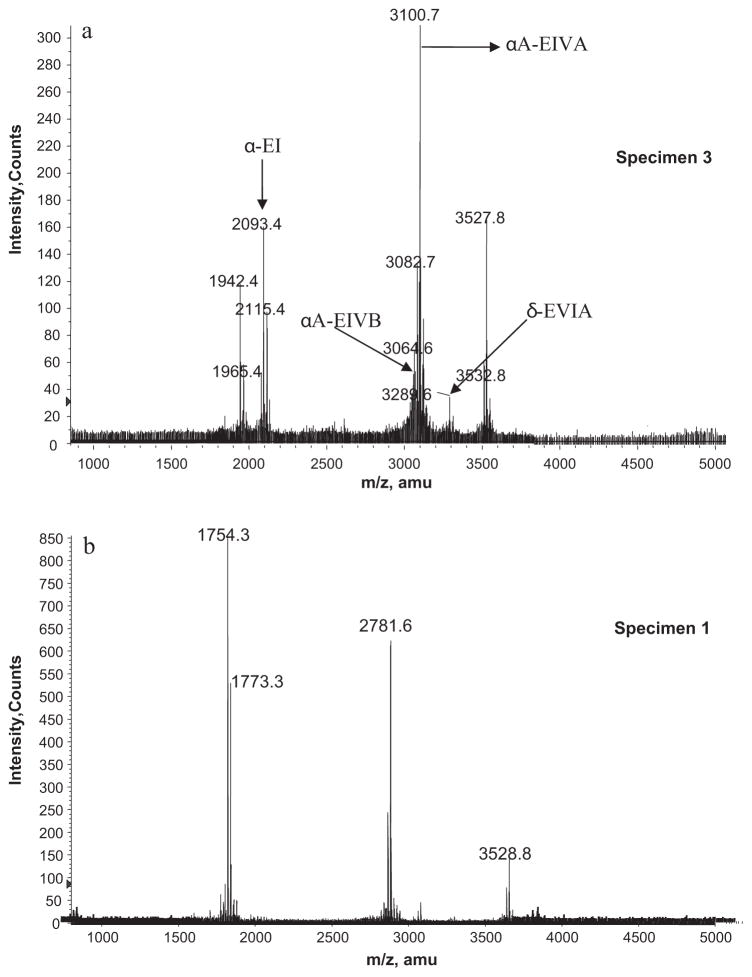
Fig. 3 (bottom) shows the MALDI-TOF mass spectra of the injected venom of specimen 1, which was similar to those of specimens 2 and 4–8. Fig. 3 (top) shows the MALDI-TOF mass spectra of the injected venom of specimen 3, which was significantly different from the other spectra. The major peaks of the mass spectra from specimen 3 corresponded to the monoisotopic masses of previously characterized C. ermineus conotoxins (m/z = 2094.4 for α-EI, m/z = 3064.6 for αA-EIVB, m/z = 3100.7 for αA-EIVA, and m/z = 3289.6 for δ-EVIA); however, additional novel conopeptides (i.e. m/z = 3527.8 and 1942.4) were also found (Fig. 3, top). The mass spectra of specimen 1 also corresponded to novel conopeptides from C. ermineus (m/z = 1754.3, 1773.3, 2781.6 and 3528.8, respectively). The injected venoms from the other specimens of C. ermineus (2, 4–8) have mass spectra profiles very similar to specimen 1. The MALDI-TOF mass fingerprint of the injected venom of C. ermineus showed little or no variations within a given specimen over time (data not shown). The MALDI-TOF mass spectra of the injected venom revealed only the major components of the venom that are preferentially volatile with the MALDI source and with m/z >800. These components do not represent the whole molecular diversity of the venom, which is mostly found in the minor components as determined by mass spectra of fractionated venom (see below).
Fig. 3.
Comparison of MALDI-TOF mass spectra between two different specimens of Conus ermineus. Top: spectra corresponding to specimen 3 expressing mostly known conotoxins. Bottom panel: spectra corresponding to specimen 1 (which is similar to the spectra of specimens 2 and 4–8) expressing all new conotoxins. See Table 2 for the identification of the corresponding conotoxins.
3.4. RP-HPLC profiles of injected venom and MALDI-TOF MS of RP-HPLC of fractions
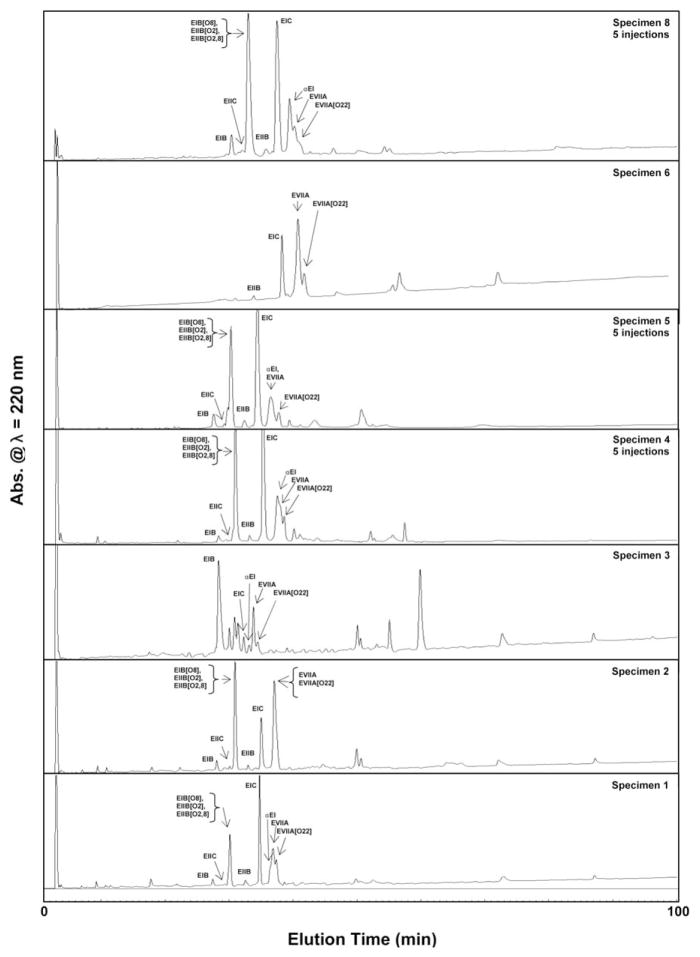
The RP-HPLC profile of the injected venom of C. ermineus shows between 6 and 10 major components at various retention times with a plethora of minor components (barely visible at full scale display) spread throughout the chromatogram (Fig. 4). Most major components elute at the hydrophilic region (<50% of the gradient). These chromatograms are less complex than the previously reported venom profiles of C. ermineus using venom pooled from multiple specimens [11,17] or pooled dissected venom [1].
Fig. 4.
Analytical RP-HPLC profiles of the injected venom of C. ermineus. Most samples are single injections of venom from the corresponding specimen number, except for specimens 4, 5 and 6, where five injections were combined to obtain their respective chromatograms. See Section 2 for chromatographic details.
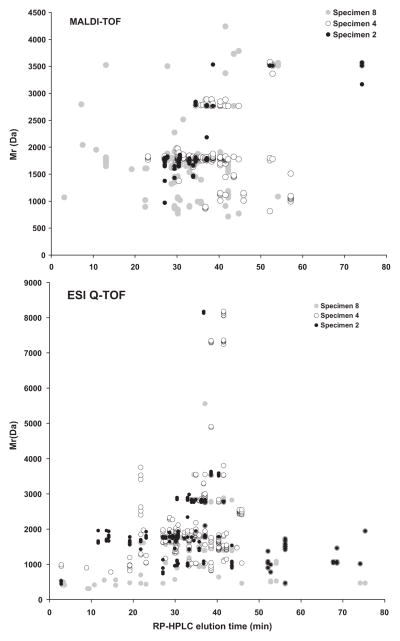
C. ermineus kept in captivity showed unchanged injected venom RP-HPLC traces over time within the same specimen (data not shown). Differences in the levels of expression of components with the same retention times are apparent in Fig. 4. However, when different specimens are compared, substantial differences in their chromatographic profiles are noted. While these venom RP-HPLC profiles are typical and suitable for the isolation of conopeptides, they do not provide the details needed to ascertain the molecular variability of the venom; they instead provide an initial fingerprint of the injected venom of C. ermineus. Therefore, MALDI-TOF mass spectrometry of these RP-HPLC fractions was used for the detailed molecular identification of venom components (Table 2, Fig. 6, top). The combination of RP-HPLC with MALDI-TOF MS yields significant coverage of the molecular components of the injected venom of C. ermineus, and together they provide evidence of intraspecies variability (Fig. 6, top). However, even greater coverage of these components was obtained by combining RP-HPLC and nanoLC–ESI-MS data (see below).
Table 2.
Conus ermineus conotoxin distribution by MALDI-TOF mass spectrometry. X indicates the presence of a particular mass in specific specimens. Known C. ermineus conotoxin biomarkers are indicated. O = hydroxyproline. [O8] and [O22] indicate hydroxylation at the residue indicated in the bracket. αA-EIVA[P5,7,13] has the same sequence as αA-EIVA; however, its Pro residues at positions 5, 7 and 13 are not hydroxylated.
| Conotoxin | m/z | Specimen 1 | Specimen 2 | Specimen 3 | Specimen 4 | Specimen 5 | Specimen 6 | Specimen 7 | Specimen 8 |
|---|---|---|---|---|---|---|---|---|---|
| 1014 | X | X | |||||||
| 1028 | X | ||||||||
| 1099 | X | ||||||||
| 1115 | X | ||||||||
| 1430 | X | X | |||||||
| 1449 | X | ||||||||
| 1581 | X | ||||||||
| 1590 | X | ||||||||
| 1605 | X | X | |||||||
| EIIC | 1644 | X | X | X | X | X | X | X | X |
| 1663 | X | X | |||||||
| 1695 | X | X | |||||||
| 1711 | X | ||||||||
| 1726 | X | ||||||||
| EIIB | 1740 | X | X | X | X | X | X | X | X |
| EIIB[O2] | 1756 | X | X | X | X | X | X | X | X |
| 1757 | X | X | X | ||||||
| EIIB[O2,8] | 1772 | X | X | X | X | X | X | X | X |
| 1773 | X | ||||||||
| EIB | 1775 | X | X | X | X | X | X | X | X |
| 1776 | X | ||||||||
| EIB[O8] | 1791 | X | X | X | X | X | X | X | X |
| 1795 | X | X | |||||||
| 1806 | X | X | |||||||
| 1824 | X | ||||||||
| 1858 | X | ||||||||
| 1928 | X | X | |||||||
| EIC | 1942 | X | X | X | X | X | X | X | X |
| 1949 | X | ||||||||
| 1959 | X | X | |||||||
| 1966 | X | ||||||||
| 1974 | X | ||||||||
| 2047 | X | ||||||||
| 2062 | X | ||||||||
| 2078 | X | X | |||||||
| EI | 2092 | X | X | X | X | X | X | X | |
| 2109 | X | X | |||||||
| 2626 | X | X | |||||||
| 2645 | X | X | |||||||
| 2738 | X | ||||||||
| EVIIA | 2764 | X | X | X | X | X | X | X | |
| EVII[O22] | 2780 | X | X | X | X | X | X | X | X |
| 3024 | X | ||||||||
| 3035 | X | ||||||||
| 3040 | X | ||||||||
| 3049 | X | ||||||||
| αA-EIVA[P5,7,13] | 3065 | X | |||||||
| 3070 | X | ||||||||
| 3081 | X | X | |||||||
| 3086 | X | ||||||||
| αA-EIVA | 3095 | ||||||||
| αA-EIVB | 3099 | X | X | ||||||
| 3101 | X | X | |||||||
| 3114 | X | ||||||||
| δ-EVIA | 3288 | ||||||||
| EIIIA | 3511 | X | X | X | X | X | |||
| 3528 | X | X | X | X | X | X | |||
| 3545 | X | X | |||||||
| 3560 | X | X | X | ||||||
| 3577 | X | ||||||||
| 3592 | X |
Fig. 6.
Differential conopeptide expression in the injected venom of C. ermineus: specimen 2 (black circles), specimen 4 (hollow circles), specimen 8 (gray circles). Top panel shows the MALDI-TOF MS determined molecular masses in Daltons (Da) as they correlate to the RP-HPLC elution time. Bottom panel shows the ESI-Q-TOF MS peptide molecular masses in Daltons (Da) as they correlate to their analytical RP-HPLC elution time.
3.5. NanoLC–ESI-MS of injected venom and RP-HPLC venom fractions
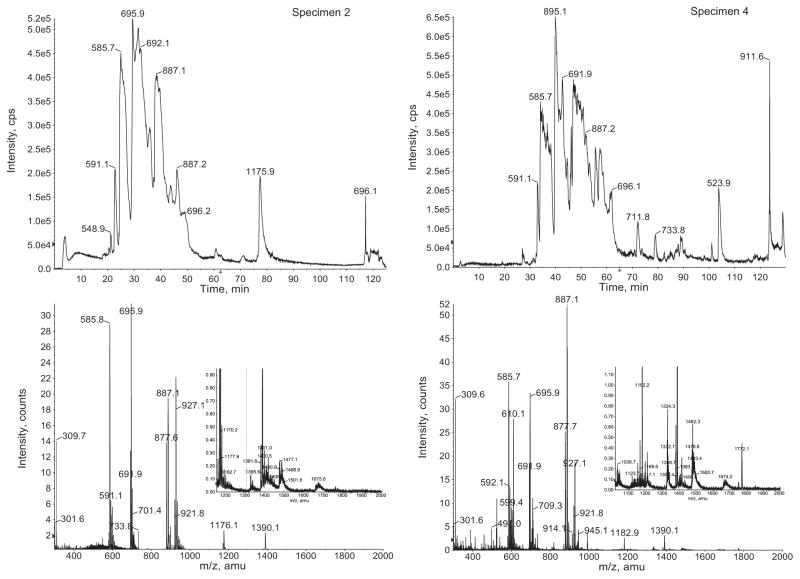
Analysis of the injected venom of C. ermineus by nanoLC–ESI-MS provides direct separation of individual components along with their molecular masses. Immediate assessments of the peptidomics of the venom were obtained through ion extraction and peptide reconstruction of these chromatograms [5] (Fig. 5). In order to increase the coverage of components within the venom, segments of the analytical RP-HPLC elution profile were subjected to nanoLC–ESI-MS analysis (Fig. 6, bottom). After obtaining all component masses from all chromatograms (from the injected venom and corresponding analytical RP-HPLCs) and following peptide reconstruction using the Bayesian algorithm, it was determined that over 800 peptides were found among four specimens of C. ermineus. The reconstructed masses ranged from 400 to 8200 Da. The molecular masses of fractionated injected venom were correlated with their RP-HPLC retention time (Fig. 6, bottom). Fig. 6 shows that most components are uniquely expressed by specific individuals as determined by MALDI (upper panel) or ESI (lower panel), and the variation within these components is significant. While the ESI data is complementary to the MALDI-TOF data, the methods of ionization are different and nanoLC–ESI-MS includes an additional separation of components (nanoLC); the molecular coverage of venom components is expanded when using a combination of RP-HPLC and nanoLC–ESI-MS data.
Fig. 5.
NanoLC–ESI-MS total ion chromatograms and mass spectra of the injected venom of C. ermineus. Left: specimen 2. Right: specimen 4. Top: total ion current chromatograms reflecting the relative abundance in counts per second (cps) over time of elution (in minutes). Bottom: ions extracted (m/z) from the chromatogram. A magnified inset is provided for higher m/z values. These spectra were used for the peptide Bayesian reconstruction for the determination of peptide molecular weight distribution within the venom. The numerical labels over the peaks represent the m/z ions of the major components of the venom.
3.6. Biomarkers and molecular fingerprinting
Fifteen conopeptide components from the venom of C. ermineus have been sequenced by several laboratories including EI [17], EIVA [11], EIVB [11], EVIA [1], as well as those identified from the specimens used in this study: EIB, EIB[O8], EIC, EIIB, EIIB[O2], EIIB[O2,8], EIIC, EIIIA, EIVA[P5,7,13], EVIIA, EVIIA[O22] (Table 2). Details on the biochemical and functional characterization of these novel conopeptides will be provided in a follow-up publication. Table 2 shows the distribution of sequenced conopeptides in all individuals of C. ermineus used in this study, where individual variability is clearly illustrated.
4. Discussion
It is known that the venom of cone snails contains an immense source of bioactive peptides. The scope of the molecular diversity of venom from of the Conus genus (inter- and intraspecies) necessitates further assessment. Using different sources of venom, such as dissected venom or injected venom from multiple individuals, complicates such assessment [3,11,13]. As the bioanalytical techniques for peptide separation and characterization increase in resolution and sensitivity, additional components of Conus venom can be identified [25] and differences in peptide content within and between species can be better ascertained.
The results from the analysis of the injected venom of C. ermineus used in this study are significant, as clear intraspecies molecular variability is observed. At first glance, it appears that different individuals can produce apparently similar venom profiles, as judged by MALDI-TOF mass spectra of the venom and RP-HPLC. However, with sufficient fractionation and appropriate detection, a more complete view of the molecular content of the venom was obtained, which provides evidence of significant venom variability among specimens (Fig. 6).
Since these specimens were collected from the same area, nourished with the same prey, and their venom was extracted at the same time, we can attest that their venom is the product of the same general environmental conditions. Therefore, we are demonstrating unequivocal intraspecies variability of venom expression. The presence of marker conotoxins EI, EIB, EI[O8], EIIB, EIIB[O2], EIIB[O2,8], EIIC, EVIIA and EVIIA[O22] in all specimens (Table 2) indicates that C. ermineus may have a common molecular imprint.
It was initially assumed that even in biogeographically unrelated individuals, the venom from the same species does not exhibit unusual peptide polymorphism [20]. Differences in chromatographic profiles were explained by concentration differences, and the content of conopeptides was presumed to be constant. This was supported by preliminary observations in the variability of the dissected venom of C. regius [26]. However, other studies with dissected venom of Conus geographus [3], C. striatus [13], C. textile [5], Conus marmoreus [5], Conus imperialis [5], Conus ventricosus [22] and Conus consors [2] do provide evidence of variability between samples. The systematic analysis of injected venom components across individuals of the same species warrants investigation on a case-by-case basis. It has been shown that the injected venom of C. striatus did indeed show remarkable intraspecies variability [13], whereas the injected venom of C. consors showed little “long term” intraspecies variation, in spite of the observed unusual intraspecimen venom variability [7]. The use of injected venom for these studies is essential, as this is the actual concoction delivered to the prey for immobilization.
NanoNMR spectra of the injected venom corresponded to a complex mixture of small molecules, peptides and proteins. Therefore, these spectra are most useful as molecular fingerprints of the venom. Accordingly, differences in the nanoNMR spectra of these specimens are a good indication of venom variability. However, since individual components cannot be resolved in the spectra, the exact level of molecular variability cannot be assessed. On the other hand, as known amounts of internal standard were used, NMR can be used to estimate the relative amounts expressed by each individual [16]. It is clear from Fig. 2 that levels of venom expression vary considerably from individual to individual. Additionally, nanoNMR allows this assessment without sample loss.
Direct MALDI-TOF MS analysis on the injected venom can readily reveal if there is significant intraspecies variability of the venom in C. ermineus, such as in the case of specimen 3, whose major conopeptides differ significantly from the other specimens. However, only a few of the major components of the venom with molecular masses larger than 800 Da and ionizable under MALDI volatilization conditions are discernible. Furthermore, MALDI-TOF mass spectrometry has a limited dynamic range, as the detector is saturated with signals from the major components, and signals derived from minor components become indistinguishable from the level of the noise. Thus, separation of the venom was needed to expand our molecular identification coverage.
Since we did not observe venom variability within a given specimen, we used venom pooled from several extractions from an individual for further separation and characterization of components. RP-HPLC profiles of pooled injected venom from several specimens of C. ermineus (unspecified origin) have been reported [11,17]. The profiles in these reports are similar, but not identical in spite of coming from the pooled venom of the same snails. In both cases, the main peaks correspond to αA-EIVB. Other dominant peaks are eluted toward the end of the gradient (Ref. [17], Fig. 1; Ref. [11], Fig. 2) (tr ~85 min). These hydrophobic components were not significantly expressed in our samples, but αA-EIVB was found in some individuals (specimens 3 and 7) and was absent in others (specimens: 1, 2, 4, 5, and 8, Table 2). Unlike previously reported chromatograms of the injected venom of C. ermineus, our profiles showed several moderately hydrophobic products of comparable size to the major components of the venom. The RP-HPLC chromatogram of the excitotoxic components of the dissected venom of C. ermineus collected in West Africa (Senegal) has also been reported. While this RP-HPLC chromatogram from a size exclusion fraction of dissected venom cannot be directly compared with our RP-HPLC chromatograms of whole injected venom, it did reveal additional complexity of the venom that leads to the isolation of the δ-EVIA conotoxin.
RP-HPLC profiles are valuable to compare the expression of the components of injected venom. Coupled to “off-line” mass spectrometry (MALDI-TOF or ESI), they can provide good coverage of the molecular components of the venom, and it is the most widely used tool for conopeptide discovery. The disadvantage is that this process is labor intensive and time consuming. In order to obtain a rapid assessment of venom variability and eventual criterion for pooling venom for molecular screening purposes, nanoLC–ESI-MS is the analytical tool of choice.
NanoLC–ESI-MS techniques allow high throughput analysis of complex peptidic mixtures by combining high performance separations with nano-electrospray ionization, followed by immediate MS detection. Depending on the mass spectrometer used, simultaneous high sensitivity and high resolution data can be obtained. This technique is routinely applied in current proteomics protocols as a rapid source for MS-based sequencing. In principle, by reduction and alkylation followed by nanoLC–ESI-MS/MS, de novo sequencing of large conopeptide libraries can be accomplished for a “conopeptidomic” analysis of the venom [12,14,25]. In practice, this approach is hampered by reproducibility, reliability, difficulties associated with “de novo” sequencing, assessment of posttranslational modifications and cost [25]. Using nanoLC–ESI-MS on the injected venom and corresponding analytical RP-HPLC fractions, we were able to determine that each specimen of C. ermineus is capable of producing between 100 and 300 different peptides, with little m/z overlap between components of different specimens. Using this limited set of individuals, we obtained over 800 mass-distinct conopeptides in the injected venom of C. ermineus. This figure departs from initial estimates that indicated the conopeptide content was in the low hundreds per species [21]. The peptidomic information obtained using a combination of techniques provided complementary coverage that revealed a new level of complexity of the injected venom of Conus ermineus. Indicators of further venom complexity can be expected when more individuals from biogeographically diverse sources, sex and stages of development are considered for analysis.
Here we have demonstrated that there is animal-to-animal variation in the peptide composition of the injected venom of C. ermineus. These findings support previous observations of the intraspecies variability in cone snail venom [2,3,5,13,22]. We also found that the composition of the injected venom remained constant over time in captivity for a given specimen of C. ermineus. In spite of the variability of the venom of C. ermineus, some peptides are expressed in all individuals and can be considered as molecular fingerprints of the species. Whether intraspecies variability in the injected venom is a genus-wide phenomenon remains to be established. However, for C. ermineus, C. striatus [13], C. catus [13], and C. purpurascens (data not shown), the variability is striking. This suggests the existence of a novel regulatory mechanism to select specific peptides for injection into the prey. These intraspecies differences may be the result of a combination of genetic and environmental factors. The differential expression of venom components represents a neurochemical paradigm that warrants further investigation.
Acknowledgments
We thank Dr. Janelle Lauer, Mari Heghinian and Jessica McCall for helpful discussions. This work was partially funded by the Florida Seagrant Program (Grant R/LR-MB-28) and the NIH (Grant 1R21NS066371-01).
References
- 1.Barbier J, Lamthanh H, Le Gall F, Favreau P, Benoit E, Chen H, et al. A δ-conotoxin from Conus ermineus venom inhibits inactivation in vertebrate neuronal Na+ channels but not in skeletal and cardiac muscles. J Biol Chem. 2004;279:4680–5. doi: 10.1074/jbc.M309576200. [DOI] [PubMed] [Google Scholar]
- 2.Biass D, Dutertre S, Gerbault A, Menou JL, Offord R, Favreau P, et al. Comparative proteomic study of the venom of the piscivorous cone snail Conus consors. J Proteomics. 2009;72:210–8. doi: 10.1016/j.jprot.2009.01.019. [DOI] [PubMed] [Google Scholar]
- 3.Bingham J-P, Jones A, Lewis RJ, Andrews PR, Alewood PF. Conus venom peptides (conopeptides): interspecies, intraspecies and within-individual variation revealed by ion-spray mass spectrometry. In: Lazarovici P, Spira ME, Zlotkin E, editors. Biochemical aspects of marine pharmacology. Eilat: The Interuniversity Institute for Marine Sciences; 1996. pp. 13–27. [Google Scholar]
- 4.Chen SS, Deutsch EW, Yi EC, Li XJ, Goodlettt DR, Aebersold R. Improving mass and liquid chromatography based identification of proteins using Bayesian scoring. J Proteome Res. 2005;4:2174–84. doi: 10.1021/pr050251c. [DOI] [PubMed] [Google Scholar]
- 5.Davis J, Jones A, Lewis RJ. Remarkable inter- and intra-species complexity of conotoxins revealed by LC/MS. Peptides. 2009;30:1222–7. doi: 10.1016/j.peptides.2009.03.019. [DOI] [PubMed] [Google Scholar]
- 6.Duda TF, Lee T. Isolation and population divergence of a widespread Indo-West Pacific marine gastropod at Easter Island. Mar Biol. 2009;156:1193–202. [Google Scholar]
- 7.Dutertre S, Biass D, Stocklin R, Favreau P. Dramatic intraspecimen variations within the injected venom of Conus consors: an unsuspected contribution to venom diversity. Toxicon. 2010;55:1453–62. doi: 10.1016/j.toxicon.2010.02.025. [DOI] [PubMed] [Google Scholar]
- 8.Halai R, Craik DJ. Conotoxins: natural product drug leads. Nat Prod Rep. 2009;26:526–36. doi: 10.1039/b819311h. [DOI] [PubMed] [Google Scholar]
- 9.Hopkins C, Grilley M, Miller C, Shon K-J, Cruz LJ, Gray WR, et al. A new family of Conus peptides targeted to the nicotinic acetylcholine receptor. J Biol Chem. 1995;270:22361–7. doi: 10.1074/jbc.270.38.22361. [DOI] [PubMed] [Google Scholar]
- 10.Hwang TL, Shaka AJ. Water suppression that works – excitation sculpting using arbitrary waveforms and pulsed-field gradients. J Magn Reson Ser A. 1995;112:275–9. [Google Scholar]
- 11.Jacobsen R, Yoshikami D, Ellison M, Martinez J, Gray WR, Cartier GE, et al. Differential targeting of nicotinic acetylcholine receptors by novel αA-conotoxins. J Biol Chem. 1997;272:22531–7. doi: 10.1074/jbc.272.36.22531. [DOI] [PubMed] [Google Scholar]
- 12.Jakubowski JA, Keays DA, Kelley WP, Sandall DW, Bingham J-P, Livett BG, et al. Determining sequences and post-translational modifications of novel conotoxins in Conus victoriae using cDNA sequencing and mass spectrometry. J Mass Spectrom. 2004;39:548–57. doi: 10.1002/jms.624. [DOI] [PubMed] [Google Scholar]
- 13.Jakubowski JA, Kelley WP, Sweedler JV, Gilly WF, Schulz JR. Intraspecific variation of venom injected by fish-hunting Conus snails. J Exp Biol. 2005;208:2873–83. doi: 10.1242/jeb.01713. [DOI] [PubMed] [Google Scholar]
- 14.Jakubowski JA, Sweedler JV. Sequencing and mass profiling highly modified conotoxins using global reduction/alkylation followed by mass spectrometry. Anal Chem. 2004;76:6541–7. doi: 10.1021/ac0494376. [DOI] [PubMed] [Google Scholar]
- 15.Kussmann M, Nordhoff E, RahbekNielsen H, Haebel S, RosselLarsen M, Jakobsen L, et al. Matrix-assisted laser desorption/ionization mass spectrometry sample preparation techniques designed for various peptide and protein analytes. J Mass Spectrom. 1997;32:593–601. [Google Scholar]
- 16.Larive CK, Jayawickrama D, Orfi L. Quantitative analysis of peptides with NMR spectroscopy. Appl Spectrosc. 1997;51:1531–6. [Google Scholar]
- 17.Martinez JS, Olivera BM, Gray WR, Craig AG, Groebe DR, Abramson SN, et al. α-Conotoxin EI, a new nicotinic acetylcholine receptor antagonist with novel selectivity. Biochemistry. 1995;34:14519–26. doi: 10.1021/bi00044a030. [DOI] [PubMed] [Google Scholar]
- 18.Moller C, Rahmankhah S, Lauer-Fields J, Bubis J, Fields GB, Mari F. A novel conotoxin framework with a helix–loop–helix (Cs α/α) fold. Biochemistry. 2005;44:15986–96. doi: 10.1021/bi0511181. [DOI] [PubMed] [Google Scholar]
- 19.Olivera BM. Conus peptides: biodiversity-based discovery and exogenomics. J Biol Chem. 2006;281:31173–7. doi: 10.1074/jbc.R600020200. [DOI] [PubMed] [Google Scholar]
- 20.Olivera BM, Hillyard DR, Marsh M, Yoshikami D. Combinatorial peptide libraries in drug design: lessons from venomous cone snails. Trends Biotechnol. 1995;13:422–6. doi: 10.1016/S0167-7799(00)88996-9. [DOI] [PubMed] [Google Scholar]
- 21.Olivera BM, Rivier J, Clark C, Ramilo CA, Corpuz GP, Abogadie FC, et al. Diversity of Conus neuropeptides. Science (Washington, DC, United States) 1990;249:257–63. doi: 10.1126/science.2165278. [DOI] [PubMed] [Google Scholar]
- 22.Romeo C, Di Francesco L, Oliverio M, Palazzo P, Massilia GR, Ascenzi P, et al. Conus ventricosus venom peptides profiling by HPLC–MS: a new insight in the intraspecific variation. J Sep Sci. 2008;31:488–98. doi: 10.1002/jssc.200700448. [DOI] [PubMed] [Google Scholar]
- 23.Shon K-J, Grilley M, Jacobsen R, Cartier GE, Hopkins C, Gray WR, et al. A noncompetitive peptide inhibitor of the nicotinic acetylcholine receptor from Conus purpurascens venom. Biochemistry. 1997;36:9581–7. doi: 10.1021/bi970235w. [DOI] [PubMed] [Google Scholar]
- 24.Terlau H, Olivera BM. Conus venoms: a rich source of novel ion channel-targeted peptides. Physiol Rev. 2004;84:41–68. doi: 10.1152/physrev.00020.2003. [DOI] [PubMed] [Google Scholar]
- 25.Ueberheide BM, Fenyo D, Alewood PF, Chait BT. Rapid sensitive analysis of cysteine rich peptide venom components. Proc Natl Acad Sci U S A. 2009;106:6910–5. doi: 10.1073/pnas.0900745106. [DOI] [PMC free article] [PubMed] [Google Scholar]
- 26.Vianna Braga MC, Konno K, Portaro FCV, Carlos de Freitas J, Yamane T, Olivera BM, et al. Mass spectrometric and high performance liquid chromatography profiling of the venom of the Brazilian vermivorous mollusk Conus regius: feeding behavior and identification of one novel conotoxin. Toxicon. 2005;45:113–22. doi: 10.1016/j.toxicon.2004.09.018. [DOI] [PubMed] [Google Scholar]
- 27.Walker CS, Steel D, Jacobsen RB, Lirazan MB, Cruz LJ, Hooper D, et al. The T-superfamily of conotoxins. J Biol Chem. 1999;274:30664–71. doi: 10.1074/jbc.274.43.30664. [DOI] [PubMed] [Google Scholar]


