

Abstract
Cellular components interact with each other to form networks that process information and evoke biological responses. A deep understanding of the behavior of these networks requires the development and analysis of mathematical models. In this article, different types of mathematical representations for modeling signaling networks are described, and the advantages and disadvantages of each type are discussed. Two experimentally well-studied signaling networks are then used as examples to illustrate the insight that could be gained through modeling. Finally, the modeling approach is expanded to describe how signaling networks might regulate cellular machines and evoke phenotypic behaviors.
During the past two decades, substantial progress has been made in understanding the biochemical properties of cellular components, in addition to the organization of various molecular machines such as those involved in transcription and motility. From these studies of components and pathways, the design principles underlying cellular networks have emerged [1,2]. However, a substantial number of experiments is still needed to build up the `parts list' for a cell and to specify `parts function' in terms of cellular location, dynamics and regulatory organization. Because of the sheer number of components and interactions, the analysis of regulatory interactions is not easily achieved through intuition; even pathways and networks with few components are configured into systems that display complex behaviors. Hence, it is becoming increasingly clear that quantitative descriptions that lead to predictive models can be of great use in analyzing signaling pathways.
Models of regulatory networks can be developed at various levels. Each level has its value. The simplest models of regulatory pathways and networks depict them as connections maps (http://stke.sciencemag.org), which are useful starting points for detailed analyses of signaling pathways. Although many signaling pathways have been identified by the study of binary reactions, connections are increasingly deduced from high-throughput experimental analyses of both protein–protein interactions [3–6] and protein location and expression patterns [7,8]. However, these connection maps are largely qualitative and, hence, only limited mathematical analysis can be undertaken. Such analyses often fall along the line of statistical correlations (`clustering'), which reveals co-regulation of each component [9], or an analysis of how the components are connected, which describes the statistical properties of the network as a whole [10–12]. An advantage of these models is that they can be developed for large numbers of components and interactions, and are useful in obtaining an overview of biological systems. However, they have limited use in understanding how networks behave dynamically in space and time.
To understand how extracellular signals evoke dynamic cellular responses, an analysis of the chemical reactions that constitute a biological system is needed. Typically, such models are built in three stages. First, a biochemical scheme that depicts the chemical reactions between the components in the network is generated. Second, a set of mathematical equations that formally represent chemical equations is written. Third, numerical simulations are performed. Although current knowledge of the biochemical interactions and reaction mechanisms is still incomplete, kinetics modeling is still useful in constraining the range of possible dynamic behaviors. Here, we describe approaches for computational analysis of regulatory networks using chemical kinetics models (see Glossary). We review the mathematical foundations for analyzing chemical reactions, and describe how these systems of coupled chemical reactions can provide insight into the behavior of regulatory mechanisms. Current tools and future prospects for building detailed kinetic models are also discussed.
Mathematical frameworks for modeling biochemical reactions
Signaling networks were traditionally perceived as linear cascades that relay and amplify information [13]. Although many cellular functions are regulated by linear propagation of information, it is becoming increasingly clear that this description is incomplete. Signaling pathways are rarely isolated, but are usually branched and interconnected [14–17]. The `nodes' (i.e. cellular components) rarely interact with just upstream and downstream components, but generally have multiple horizontal connections leading to the formation of an extensive network. Furthermore, cellular components rarely function in just one location, but dynamically shuttle between cellular organelles [18–20,81]. The network resulting from multiple interactions and dynamic localization enables the cells to process information in a context-dependent manner.
Using an engineering perspective, the cell can be modeled as a complex chemical reactor. In this model, the interactions between components of the cells and their dynamic localization give rise to the chemical, mechanical and electrical capabilities of the cell. Representation and computation of how these emergent properties arise from the biochemical reactions is a major goal of systems biology. Because the biochemical networks underlying cellular functions are far too complex, the analysis of networks is best achieved through mathematical modeling. Currently, several mathematical approaches are available to represent and analyze the behavior of these complex systems. These approaches are described in Supplementary Box 1. Broadly, mathematical models of biochemical reactions can be divided into two categories: deterministic systems and stochastic systems. In deterministic models, the change in time of the components' concentration is completely determined by specifying the initial, and in some cases, boundary conditions. Once these conditions are specified, the behavior of the system with respect to time can be predicted with complete certainty. By contrast, the changes in concentration of components with respect to time cannot be fully predicted in stochastic models. During a given period, the reaction might or might not occur; the probability of occurrence is related to the kinetic rate constant. Hence, the dynamics of stochastic systems cannot be predicted with complete certainties from the initial conditions. The biochemical fluctuations or `noise' inherent in such stochastic systems are often exploited in cellular functions, resulting in spontaneous switching from one biochemical state to another [21–24].
Under the classification of deterministic and stochastic models, the cell can be viewed as either a spatially homogeneous or a heterogeneous reactor. The vast majority of models that have been constructed for signaling networks are based on solution kinetics in which spatial heterogeneity is ignored. However, a compartmental model or a reaction–diffusion model is often needed when phenomena such as trafficking, transport and cellular geometry are of interest [25–27]. Like solution kinetics models, compartmental models use ordinary differential equations (ODEs) (Supplementary Box 1). A compartmental model treats the same molecule in different compartments as distinct species instead of assuming that they are regulated in the same manner. The exchange of molecules between compartments is modeled as a flux, which can either be determined from a priori knowledge or be fitted to empirical observations [28]. A more complex description of spatially restricted biochemical reactions is achieved using the reaction–diffusion equation. The reaction–diffusion equation is classically described as one in which binding reactions are fast enough to affect the diffusion rate of the molecule of interest. Because the concentration depends on two variables, space and time, the reaction–diffusion system must be modeled using partial differential equations (PDEs) (Supplementary Box 1).
Although the compartmental and reaction–diffusion models afford more biological realism, they come at the increasing cost of complexity, both in terms of the increase in the number of parameters and in terms of computation time [29]. Compartmental models are often used because techniques for solving systems of ODEs are well developed [30]. Deterministic reaction–diffusion models have been used to analyze networks that underlie calcium signaling and describe developmental processes [27,31–35]. Because of the resources required for simulation of stochastic systems, spatially heterogeneous stochastic models are seldom used in modeling biological systems. Nevertheless, some stochastic models have been developed in specialized cases such as signaling in dendrites, immunological synapses, or endocytic vesicles [36–38].
The choice of modeling methodology will depend on the cellular process that is being investigated and the experimental tools that are available. In many cases, deterministic models that presume the existence of a well-stirred reactor are a good first approximation. Although this approach has been useful in analyzing and interpreting data derived from experiments using pull-downs and immunoblots, fluorescent reporters designed for monitoring the activation of signaling molecules in vivo have made it necessary to consider different modeling strategies. One possibility is to use the reaction–diffusion equation to model spatially restricted biochemical reactions. However, this approach is currently limited by experimental data on the rates of movement of signaling components and by the computational power. Compartmental modeling seems to provide a happy medium between the ODE-based and PDE-based approaches, but the decision to use a compartmental model instead of a PDE model must be considered on a case-by-case basis. Finally, the use of a stochastic model is necessary for problems in which fluctuations have a significant role, such as in phenotypic variations and in gene regulation.
Mechanisms of signal propagation in cellular networks
To illustrate how the selection of modeling methodology is guided by biological phenomena, two signaling networks are considered. For instance, one of the key features of a network is the presence of a positive-feedback loop that can lead to switching behavior, which enables the propagation of signals across time-scales. To illustrate this, consider the phenomenon in which a single hormone interacts with multiple receptor subtypes. The ability of hormones and neurotransmitters to interact with multiple subtypes of G-protein-coupled receptors (GPCRs) is well established. Often the same cell has multiple subtypes of GPCRs; as an example, we consider the presence of α1 and α2 adrenoceptors in the same cell [78]. When the cell is stimulated by norepinephrine (NE), the signal is sensed by parallel pathways. When NE binds to the α1 adrenoceptor it activates the Gq pathway, leading to stimulation of phospholipase Cβ (PLCβ). The subsequent release of intracellular calcium activates protein kinase C (PKC), which in turn activates both Ras and Raf. Simultaneously, when NE activates the α2 adrenoceptor, which couples to the Gi/o pathway, the release of Gβγ results in the activation of the Ras mitogen-activated protein kinase (MAPK)-1,2 pathway. Thus, activation of both pathways results in MAPK-1,2 regulation of cytoplasmic phospholipase A2 (cPLA2). This produces arachidonic acid (AA), which activates PKC in the presence of basal levels of diacylglycerol (DAG), setting up a positive-feedback loop as indicated by the circular arrow in Figure 1.
Figure 1.

Switching behavior (bistability) resulting from interacting signaling pathways. (a) By binding to α1 and α2 adrenoceptors, norepinephrine can activate both the Gq and Gi/o pathways. Interactions between these pathways can result in a positive-feedback loop [78]. A key question regarding the behavior of this system is whether the positive-feedback loop can lead to bistability. (b) To answer this question, we can develop a model of this system to determine whether bistability occurs. The first two ordinary differential equations (ODEs) describe the formation of receptor–ligand complexes for α1 and α2 adrenoceptors. The equations state that the rates of change of the receptor–ligand complexes are equal to the rate of binding of the ligand to the receptor (first term), minus the rate of dissociation of the ligand (second term), minus the rate of binding of the G proteins to the complexes, plus the rate of activation of the G proteins. In these equations, the rate of change in concentration is represented as d[C]/dt, where [C] represents the concentration of species C. The parameter ki represents the kinetic constant (forward or reverse rate) for reaction i. The last equation of this set states that the rate of change of phosphorylated mitogen-activated protein kinase (MAPK) is equal to the rate of phosphorylation by MEK minus the rate of dephosphorylation. Here, the phosphorylation of MAPK is assumed to follow Michaelis–Menten kinetics, with the rate specified by the affinity constant Km and the turnover number kcat of MEK. Similar equations can be written for the remaining components of the system. After the equations have been written for all the components, and values assigned for concentration and rate terms, the system can be analyzed for many properties. For instance, bistability can be explored by examining the effect of kinetic parameters and initial concentrations on the steady-state solutions, which are calculated by setting the rate of change of all molecules to zero. Abbreviations: AA, arachidonic acid; AR, adrenoceptor; cPLA2, cytoplasmic phospholipase A2; DAG, diacylglycerol; IP3, inositol (1,4,5)-trisphosphate; NE, norepinephrine; PKC, protein kinase C; PLCβ, phospholipase Cβ. Image in (a) reproduced, with permission, from Ref. [78].
What are the consequences of a positive-feedback loop? In many cases, the presence of a positive-feedback loop results in bistability [39]. Mathematically, bistability is used to describe a system that has two steady states: high and low. Signals of sufficient amplitude and duration enable the network to switch from the `low-activity' state to the `high-activity' state. Under certain conditions, the `output signal' can be sustained even when the `input signal' is removed [39–42]. To determine computationally if the network can display such switching behavior, a set of coupled ordinary differential equations as shown in Figure 1 can be written and analyzed. It is worth noting the presence of a positive-feedback loop is a necessary, but not sufficient, condition for establishing bistability, so the actual behavior will depend on the concentrations of the components within the network and the kinetics parameters. Thus, even though spatial heterogeneity is ignored, models similar to that described in Figure 1 can still provide useful information in terms of defining the cellular concentrations of components required for the functioning of a signaling switch.
In addition to giving rise to propagation of signaling information in time, parallel intracellular processing of extracellular signals can often give rise to propagation of signals in space. For instance, the activation of Ras signaling by receptor tyrosine kinases (RTKs) was generally thought to occur exclusively on the plasma membrane and on endocytic vesicles that are derived from the plasma membrane [43]. In the canonical pathway for Ras activation, binding of epidermal growth factor (EGF) to its cognate receptor results in dimerization and trans-autophosphorylation. The adaptor Grb2 and the Ras guanine-nucleotide-exchange factor (GEF) Sos are sub-sequently recruited to the plasma membrane, resulting in Ras activation. Recently, Bivona and colleagues [44,45] showed that binding of EGF to its receptor could activate another parallel pathway – Src – which then phosphorylates and activates PLCγ. Activated PLCγ catalyzes the production of DAG and inositol (1,4,5)-trisphosphate [Ins(1,4,5)P3], resulting in an elevated intracellular calcium concentration. Interestingly, calcium seems to have both positive and negative regulatory effects on Ras activation [46,47]. On the one hand, calcium activates the exchange factor RasGRP1, which upon calcium binding translocates to the Golgi where it activates Golgi-bound Ras. On the other hand, calcium also activates a Ras GTPase-activating protein (GAP) called CAPRI. Upon calcium binding, CAPRI translocates to the plasma membrane, where it turns off activated Ras. Thus, parallel processing of the EGF signal gives rise to multiple feedback loops that regulate signal propagation both spatially and temporally. This network is shown in Figure 2. Use of diffusible components enables the signal to be propagated from the plasma membrane to the Golgi. For this system, in which differential targeting of the GAP and GEF to different cellular compartments controls the output of the signaling network, a compartmental or reaction–diffusion model is needed.
Figure 2.
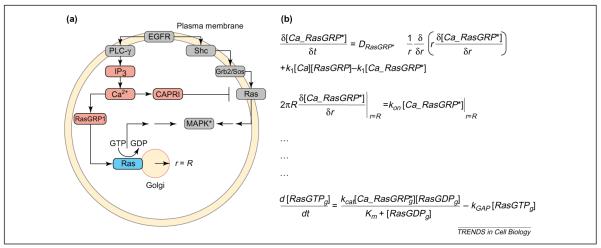
Modeling spatially restricted biochemical reactions. (a) Epidermal growth factor (EGF) activates the canonical Ras mitogen-activated protein kinase (MAPK) pathway on the plasma membrane through Grb2/Sos. In addition, EGF can trigger an elevation in intracellular Ca2+ through phospholipase Cγ (PLCγ). The exchange factor RasGRP1 translocates to the Golgi after Ca2+ binding, activating Golgi-bound Ras. Intracellular Ca2+ also activates the GTPase-activating protein (GAP) CAPRI, which translocates to the plasma membrane and deactivates plasma-membrane-bound Ras. A key question in this system is whether Ras molecules on the plasma membrane and those on the Golgi are activated for different durations by the EGF receptor (EGFR). (b) To answer this question, we need to build a model that includes spatial specifications. Hence, we use a set of partial differential equations (PDEs). The first two equations in this figure describe the activation in the cytoplasm, diffusion and capture of RasGRP1 on the Golgi membrane. The first equation describes the rate of change of activated RasGRP1 with respect to time. The rate of change of activated RasGRP1 has three components. The first term describes the diffusion of RasGRP in the cytoplasm, which is proportional to the second derivative of the concentration, (1/r)∂/∂r(r∂[Ca_RasGRP*]/∂r), multiplied by the diffusion coefficient DRasGRP*. The second and third terms describe the activation of RasGRP by binding of Ca2+ and deactivation by release of bound Ca2+. The parameters k1 and k2 are the rate constants for these processes. The second equation is called a boundary condition; in this case, it states that the flux of activated RasGRP1 to the Golgi membrane, 2πR∂[Ca_RasGRP*]/∂r, is equal to the rate of binding of RasGRP to Ras, konCa_[RasGRP*]|r=R, where the Golgi is defined as a circle with a radius (r) of R. The last equation states that the rate of change of RasGTP on the Golgi is equal to the rate of activation of Ras by RasGRP minus the rate of inactivation by a GAP. Note that, for clarity, the diffusion of RasGTP in the plane of the Golgi membrane is ignored. Similar equations and boundary conditions must be specified for the rest of the components. Analytical solutions are not guaranteed for many systems of PDEs, and PDE models are typically solved numerically. Abbreviation: IP3, inositol (1,4,5)-trisphosphate.
Because Ras is activated and separately regulated on the plasma membrane and the Golgi, an emerging question is whether the activation of Ras in different compartments is achieved by different time courses leading to persistence in Ras signaling. To answer this question, an example of a PDE-based reaction–diffusion model for Ras activation is described in Figure 2. Here, the equations describe the diffusion and binding of active RasGRP to the Golgi compartment, which is modeled as a circle with radius R. Although it is difficult to predict quantitatively the behavior of the system without simulation, it is clear that the rate of diffusion of calcium, and the rates of translocation of RasGRP and CAPRI to the Golgi and the plasma membrane, respectively, will define the extent and duration of the Ras signaling at these two locations. Hence, any computational models that predict the persistence of the EGF signal at the level of Ras in the overall system will have to consider the rates of movement of RasGRP and CAPRI, in addition to the activity of the components at specified locations. Models with such spatial complexity will have to be built, if we are to understand how the cell effectively uses spatial compartmentalization to obtain signaling specificity.
Anatomy of a time bridge: feed-forward relays
Another regulatory motif that occurs frequently in signaling networks is a relay cascade, in which a component might use `feed-forward' interaction as a way of regulating cellular responses (Figure 3). Such relay control might enable sustained activation of downstream effectors, even after the upstream components have been turned off. This `bridge' between the fast and slow time-scales could have important biological implications.
Figure 3.
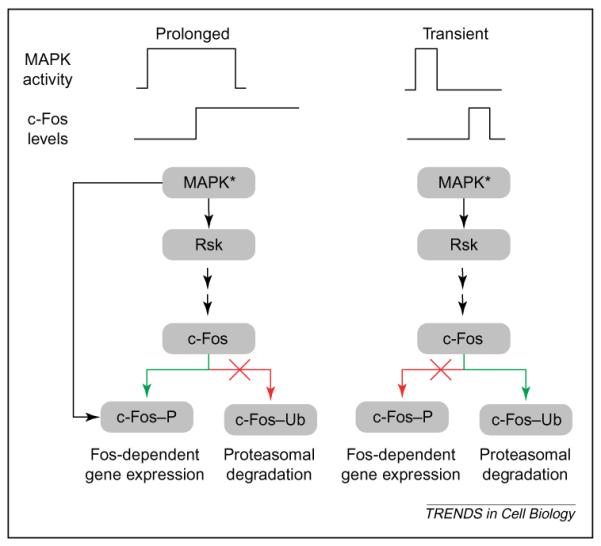
Feed-forward relay for decoding signal duration. Recent studies by Blenis and co-workers have elucidated a potential mechanism for decoding the duration of a mitogen-activated protein kinase (MAPK) response [53,54]. The decoder essentially works as a feed-forward relay system. Activated MAPK induces transcription of intermediate-early genes such as c-fos. After c-fos is transcribed and translated, it can be degraded by the ubiquitin–proteasome pathway or stabilized by MAPK-1,2 interaction and phosphorylation. If the duration of MAPK activation is short compared with the lag associated with c-fos transcription and translation, there will be little activated (MAPK*) to phosphorylate the newly synthesized c-Fos protein, and c-Fos is ubiquitinated (c-Fos–Ub) and degraded. However, if the duration of MAPK activation is longer than the time required for transcription and translation of c-fos, MAPK* can bind to and phosphorylate c-Fos (c-Fos–P) and protect it against degradation. In turn, the stable c-Fos stimulates the transcription of Fos-dependent genes, even after MAPK is deactivated and, thus, the initial signal is propagated across time scales.
Cellular functions as diverse as proliferation and differentiation are regulated by changes in the extracellular environment and the ensuing receptor-mediated stimulation or inhibition of signaling network activity. There has been substantial interest in understanding how the activation of these signaling networks is translated into a particular cellular response. The MAPK-1,2 signaling network is particularly well understood. MAPK-1 and -2 are activated within minutes in response to a large number of extracellular stimuli. This activation typically induces a set of immediate-early genes (IEGs), which can translate the initial MAPK signal into long-lasting biological outcomes. For instance, MAPK activation can lead to proliferation, cell-cycle arrest, or differentiation [48–50]. How do cells interpret the MAPK-1,2 signal to generate the appropriate response? One important determinant seems to be the duration of the signal. In the neuronal cell line PC12, short duration of MAPK-1,2 signaling is thought to promote proliferation, whereas sustained MAPK-1,2 signaling is thought to promote differentiation [50–52]. Recent studies by Murphy and co-workers have elucidated a feed-forward mechanism that decodes the duration of MAPK activation in terms of IEGs expression and function [53,54].
The data obtained by Murphy and colleagues are summarized in the regulatory scheme depicted in Figure 3. The response to MAPK-1,2 activation (whether transient or sustained) involves induction of IEGs such as c-Fos (Figure 3). Because the time required for transcription and translation of the IEGs and their transport to the nucleus is more than the time associated with transient MAPK-1,2 activation, only initially sustained MAPK signaling results in phosphorylation that protects c-Fos against degradation [55,56]. Although sustained MAPK is generally turned off within 30–60 min via negative feedback involving the induction of MAPK phosphatase [57,58], the phosphorylated and activated c-Fos is stable for a much longer period. Thus, c-Fos function persists for hours after the initial MAPK activation. Therefore, the feed-forward regulatory configuration could bridge the time-scale of minutes for MAPK activation and the time-scale of hours for c-Fos-stimulated gene expression.
An interesting feature of this feed-forward regulation is the relationship between structure and function. Fos and several other MAPK1,2-responsive IEGs contain a DEF domain that binds to MAPK1,2 [53,54,56]. Thus, part of the capability to induce feed-forward regulation and time bridges is `hard wired' into the components of the pathway, enabling the cell to decode the duration and amplitude of the external signal. Because this network involves intrinsically stochastic reactions such as transcription and translation, multi-compartment models that possess both deterministic and stochastic regimes might have to be considered. A mathematical model for such a system is likely to be relatively complex and might require not only new experimentation, but also development of new modeling software that enables simultaneous computation of deterministic and stochastic reactions [59,60]. These models might enable predictions of the extent and duration of MAPK-1,2 activity required for defining the lifetime of the Fos protein and expression of Fos-regulated genes (Figure 3).
From signaling networks to functions
Just as information flow within signaling networks can be represented by sets of chemical reactions, the functions of cellular machines can also be represented by coupled chemical reactions. This concept is illustrated by considering force generation by the actin cytoskeleton machinery, which is used for numerous processes within the cell including the process that drives membrane protrusion [61,62]. Force generation by the actin cytoskeleton can be studied at two levels. At the chemical level, one needs to model the biochemical reactions that underlie the actin polymerization and depolymerization cycles, and the regulation of these reactions by the signaling network [63]. At a physical level, one needs to understand how the polymerization and depolymerization cycles of actin generate force, and conversely, how mechanical force modulates the kinetics of polymerization and depolymerization [61,62]. This interdependence between mechanics and chemistry determines whether polymerization occurs, and whether it can provide enough protrusive force to push the cell membrane forward. This is schematically depicted in Figure 4.
Figure 4.
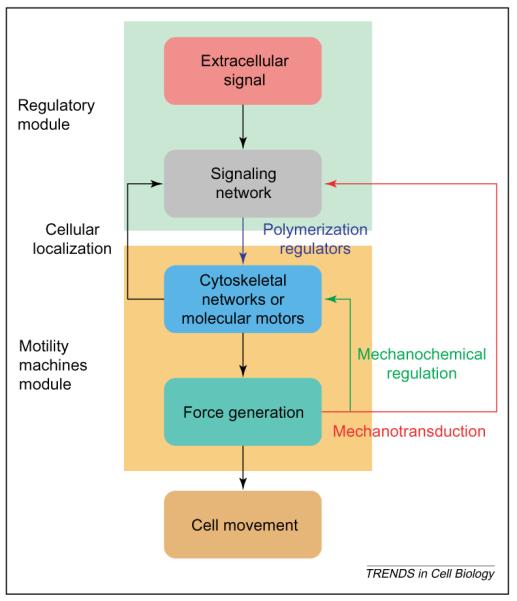
Modular organization of regulated cell movement. A major goal of mathematical modeling in cell biology is to predict cellular function from biochemical reaction networks. Such models might involve multiple networks and can be studied best in a modular fashion. Regulated cell movement can be described by two interacting modules comprising the regulatory network (green background) and the motility machines module (yellow background), which consists of the cytoskeleton and molecular motors that, together, make up the force-generating machinery. The signal network processes and integrates information from extracellular signals, in addition to internal signals from the force-generating machinery (mechanotransduction) to regulate the output force that leads to cell movement. The reverse arrows indicate the ability of cellular localization to regulate the capability of the signaling network, and the ability of force to affect directly both the function of the cytoskeleton and the motors (mechanochemical regulation) and to affect indirectly the signaling network (mechanotransduction).
To model such a system at the chemical level, we must first construct a model of regulated polymerization and depolymerization reactions. A schematic representation of reactions involved in the actin polymerization and depolymerization cycle at the leading edge has been described in a review by Pollard and Borisy [63]. Once a module of regulated actin assembly is constructed, it will have to be integrated with a module of the signaling network that regulates the activity state of the polymerization regulators. In this example, a model of signaling network would function to decode the input signal provided by receptor–ligand interaction, such as integrin binding to extracellular matrix proteins, into an output signal that regulates polymerization regulators such as Arp2/3 [64–66].
To describe function truly, in this case the formation of cellular protrusions, the model of signaling network and regulated actin assembly must be integrated with a model of force generation. Thermodynamically, the mechanical force of the membrane against which polymerization needs to proceed can either decrease the on-rate, augment the off-rate, or both [67,68]. For a typical actin concentration of 50 μM, the chemical-force equation predicts a stalled force on the order of 9 pN per filament [69]. Therefore, an actin bundle with tens of filaments can theoretically generate sufficient force to deform the cell membrane against which it is pushing. It is important to note that models based on thermodynamic arguments provide only theoretical limits within which the system can operate, but do not provide mechanistic details. Elegant models that analyze the relationship between filament assembly and force generation have been proposed at both the single filament and at the `actin–gel' level [61,70]. Integration of these mechanochemical models of filament assembly and force generation with models of the signaling networks might enable prediction of how signals from the extracellular matrix can control the rate of cell movement. Such functional models are important because phenotypes are often the only experimentally accessible measurements. In the case of cell migration, it is much easier to measure the relationship between extracellular matrix protein density and speed of cell migration than it is to measure and quantify Arp2/3 activation in vivo.
Concluding remarks: the cell as an ensemble of interacting networks
As described in this article, one way to represent a cell for computational purposes is to consider it as an ensemble of interacting networks in which a signaling network coordinately regulates multiple molecular machines that are, themselves, networks of interacting cellular components. Although such an ensemble of networks is likely to be a complex system, analysis of such systems will be necessary to understand the phenotypic characteristics of the cell in a context-dependent manner. The development of such functional models faces several hurdles. One of the more difficult experimental challenges is the measurement of chemical kinetics parameters and molecular concentrations in vivo. The minimum requirements for modeling biochemical reactions using a chemical kinetics model are the concentration of the signaling components at the basal state and the kinetics parameters such as the forward and backward reaction rates. Currently, these values exist only for a small fraction of the enzymatic and chemical reactions known to occur within any cell of interest. Furthermore, even when these parameters exist, they are often estimated from studies in systems that have been biochemically purified. The relevance of these in vitro values to reactions in the intact cell needs to be ascertained. In addition, both the information flow within signaling networks and the activity of cellular machines often take place in specified subcellular regions such as the lamellapodium (e.g. actin polymerization) or mitochondria (e.g. apoptosis). Compartment-specific reactions can change both concentration and kinetics. Localization to cellular organelles might serve to increase the effective concentration, by confining the molecules to a smaller region and, thus, might increase reaction rates. To address the gap between in vitro and in vivo data, it will be necessary to develop probes that can measure the molecular concentration and activation states of molecules in their physiological compartments. Fluorescent probes have already been developed for measurement of activation [71–72], and the extraction of quantitative data from such measurements is likely to be the next important task in computational cell biology [28,73].
In addition to the experimental challenges, novel computational paradigms that can be used to study biologically relevant situations need to be developed. One key area of research is multidimensional parameter estimation. Because of the paucity of quantitative data, it is often necessary to estimate several parameters from a single dose–response curve or a single time course. As the number of parameters (`dimensions') to be estimated increases, the time required for parameter estimation also increases exponentially. Thus, mathematical methods for extraction of quantitative data will be an important part of the modeling process.
Another key area of research is in the development of high-performance algorithms, especially for solving large systems of PDEs. Software such as the Virtual Cell offers user-friendly graphical interfaces for solving PDEs [74]. Whereas the current implementation of the Virtual Cell program is useful, additional enhancements are needed to facilitate the development of progressively realistic models, and continued support to develop and enhance such programs is essential for progress in computational cell biology. A modeling platform for simulating hybrid models with both deterministic and stochastic regimes is also desirable [15,75,76]. Cellular networks and genetic circuits often involve small numbers of key molecules, such as transcription factors, or occur in compartments with small volumes (e.g. endocytic vesicles or dendrites). In such systems, the single-molecule chemical events coexist with reactions involving a much larger number of signaling molecules. For example, a reaction describing the binding of a transcription factor to the promoter is best described stochastically, whereas a reaction describing the phosphorylation of MAPK by MEK can be modeled using mass-action kinetics. Attempts to model such hybrid systems currently focus on automated parsing of networks into stochastic and deterministic regimes. These efforts have resulted in simulation software such as H-GENESIS and STOCK [59,60]. A brief list of some currently available software is provided in Table 1.
Table 1.
Freely available tools for modeling cell regulatory networks
| Systems | Software | Features |
|---|---|---|
| Deterministic | Virtual Cella | Graphical user interface (GUI) for simulation of partial differential equation (PDE)-based models |
| Simulation in experimentally obtained cellular geometry | ||
| Gepasib | Extensive parameter estimation and sensitivity analysis tools | |
| Stochastic | StochSimc | Representation of molecules in multiple states |
| Spatial organization is represented as a simple two-dimensional array | ||
| Based on the Morton-Firth algorithm | ||
| MCell d | Incorporation of spatially complex features into biochemical models | |
| Diffusion of individual molecules is simulated using a Brownian dynamics random walk algorithm | ||
| Hybrid | GENESIS Kinetikite | Automatic parsing of deterministic and stochastic reactions |
Although the development of biologically realistic models of mammalian cells for computation remains a daunting challenge, such quantitative analysis is likely to be valuable. It is through the development and analysis of such models that we will be able to understand the basic design principles of a cell. Modeling also often enables the identification of components that are the most susceptible to biological intervention [77]. This should result in the identification of new targets within the cell for therapeutic interventions for many diseases.
Supplementary Material
Acknowledgements
We thank A. Hasseldine for critically reading the manuscript, and the Editor of this journal and the anonymous reviewers for many valuable suggestions during the review process. Research on modeling in our laboratory is supported by National Institutes of Health grants GM-54508 and HL-069733, and an Advanced Research Center grant from NYSTAR.
Glossary
- Bistability
bistability refers to the existence of two steady-state solutions. In biological context, a system exhibiting bistability might shift from `low' to `high' steady state, often abruptly, in response to a signal of sufficient duration and amplitude. Positive feedback is a necessary, but not sufficient, condition for bistability.
- Chemical kinetics model
a chemical kinetics model is based on ordinary differential equations (ODEs). An example of a chemical kinetics model is the mass-action rate law written for chemical reactions.
- Compartmental model
compartmental models are also based on ordinary differential equations (ODEs), but the same molecules in different compartments are modeled separately. The rate of movement of the molecules between compartments is also specified.
- Deterministic systems
when molecules exist in sufficient number, the inherent biochemical noise often averages out, and the model can be described by a mean rate constant.
- Hybrid systems
hybrid systems contain both deterministic and stochastic components. Examples might include the regulation of gene expression by a signaling network (see text).
- Negative feedback
negative feedback occurs when the downstream effector inhibits its own production or activation. The classical example for negative feedback is in the metabolic pathway, when excess metabolites often inhibit the upstream enzymes.
- Ordinary differential equations (ODEs)
the application of ODEs in chemical kinetics modeling typically involves relating the rate of change in the variable of interest to the concentration of other variables. By definition, ODEs have only one independent variable; in the case of a chemical kinetics model, the concentration is only a function of time.
- Partial differential equations (PDEs)
unlike ODEs, which contain one independent variable such as time, PDEs are differential equations that contain two or more independent variables. In most cases, these variables are spatial coordinates and time.
- Positive feedback
positive feedback occurs when the downstream effector activates its regulators. This often serves to `amplify' signal. One example is the voltage-gated sodium channel, which opens in response to depolarization. The depolarization causes even more sodium channels to open, resulting in an action potential in neurons.
- Reaction–diffusion model
the reaction–diffusion models are based on partial differential equations (PDEs). The reaction–diffusion equation states that the rate of change of concentration in time depends on a diffusion term, a reaction term and a convection term, which specifies bulk movement of the molecules.
- Stochastic systems
species that exist in small numbers will show significant deviation from the average behavior predicted in deterministic models. This biochemical `noise' can be significant enough to switch the system from one state to another [79,80].
Footnotes
Supplementary data Supplementary data associated with this article can be found at 10.1016/j.tcb.2004.10.007
References
- 1.Hartwell LH, et al. From molecular to modular cell biology. Nature. 1999;402:C47–C52. doi: 10.1038/35011540. [DOI] [PubMed] [Google Scholar]
- 2.Lum L, Beachy PA. The Hedgehog response network: sensors, switches, and routers. Science. 2004;304:1755–1759. doi: 10.1126/science.1098020. [DOI] [PubMed] [Google Scholar]
- 3.Zhu H, et al. Global analysis of protein activities using proteome chips. Science. 2001;293:2101–2105. doi: 10.1126/science.1062191. [DOI] [PubMed] [Google Scholar]
- 4.Uetz P, et al. A comprehensive analysis of protein–protein interactions in Saccharomyces cerevisiae. Nature. 2000;403:623–627. doi: 10.1038/35001009. [DOI] [PubMed] [Google Scholar]
- 5.Ho Y, et al. Systematic identification of protein complexes in Saccharomyces cerevisiae by mass spectrometry. Nature. 2002;415:180–183. doi: 10.1038/415180a. [DOI] [PubMed] [Google Scholar]
- 6.Giot L, et al. A protein interaction map of Drosophila melanogaster. Science. 2003;302:1727–1736. doi: 10.1126/science.1090289. [DOI] [PubMed] [Google Scholar]
- 7.Ghaemmaghami S, et al. Global analysis of protein expression in yeast. Nature. 2003;425:737–741. doi: 10.1038/nature02046. [DOI] [PubMed] [Google Scholar]
- 8.Huh WK, et al. Global analysis of protein localization in budding yeast. Nature. 2003;425:686–691. doi: 10.1038/nature02026. [DOI] [PubMed] [Google Scholar]
- 9.Maslov S, Sneppen K. Specificity and stability in topology of protein networks. Science. 2002;296:910–913. doi: 10.1126/science.1065103. [DOI] [PubMed] [Google Scholar]
- 10.Milo R, et al. Superfamilies of evolved and designed networks. Science. 2004;303:1538–1542. doi: 10.1126/science.1089167. [DOI] [PubMed] [Google Scholar]
- 11.Strogatz SH. Exploring complex networks. Nature. 2001;410:268–276. doi: 10.1038/35065725. [DOI] [PubMed] [Google Scholar]
- 12.Stelling J, et al. Metabolic network structure determines key aspects of functionality and regulation. Nature. 2002;420:190–193. doi: 10.1038/nature01166. [DOI] [PubMed] [Google Scholar]
- 13.Ferrell JE, Jr., Machleder EM. The biochemical basis of an all-or-none cell fate switch in Xenopus oocytes. Science. 1998;280:895–898. doi: 10.1126/science.280.5365.895. [DOI] [PubMed] [Google Scholar]
- 14.Alm E, Arkin AP. Biological networks. Curr. Opin. Struct. Biol. 2003;13:193–202. doi: 10.1016/s0959-440x(03)00031-9. [DOI] [PubMed] [Google Scholar]
- 15.Jordan JD, et al. Signaling networks: the origins of cellular multitasking. Cell. 2000;103:193–200. doi: 10.1016/s0092-8674(00)00112-4. [DOI] [PMC free article] [PubMed] [Google Scholar]
- 16.Weng G, et al. Complexity in biological signaling systems. Science. 1999;284:92–96. doi: 10.1126/science.284.5411.92. [DOI] [PMC free article] [PubMed] [Google Scholar]
- 17.Vogelstein B, et al. Surfing the p53 network. Nature. 2000;408:307–310. doi: 10.1038/35042675. [DOI] [PubMed] [Google Scholar]
- 18.Haugh JM, Lauffenburger DA. Physical modulation of intracellular signaling processes by locational regulation. Biophys. J. 1997;72:2014–2031. doi: 10.1016/S0006-3495(97)78846-5. [DOI] [PMC free article] [PubMed] [Google Scholar]
- 19.Lippincott-Schwartz J, et al. Studying protein dynamics in living cells. Nat. Rev. Mol. Cell Biol. 2001;2:444–456. doi: 10.1038/35073068. [DOI] [PubMed] [Google Scholar]
- 20.Hirschberg K, et al. Kinetic analysis of intracellular trafficking in single living cells with vesicular stomatitis virus protein G–green fluorescent protein hybrids. Methods Enzymol. 2000;327:69–89. doi: 10.1016/s0076-6879(00)27268-6. [DOI] [PubMed] [Google Scholar]
- 21.Hasty J, et al. Designer gene networks: towards fundamental cellular control. Chaos. 2001;11:207–220. doi: 10.1063/1.1345702. [DOI] [PubMed] [Google Scholar]
- 22.Arkin A, et al. Stochastic kinetic analysis of developmental pathway bifurcation in phage lambda-infected Escherichia coli cells. Genetics. 1998;149:1633–1648. doi: 10.1093/genetics/149.4.1633. [DOI] [PMC free article] [PubMed] [Google Scholar]
- 23.McAdams HH, Arkin A. Stochastic mechanisms in gene expression. Proc. Natl. Acad. Sci. U. S. A. 1997;94:814–819. doi: 10.1073/pnas.94.3.814. [DOI] [PMC free article] [PubMed] [Google Scholar]
- 24.Ozbudak EM, et al. Multistability in the lactose utilization network of Escherichia coli. Nature. 2004;427:737–740. doi: 10.1038/nature02298. [DOI] [PubMed] [Google Scholar]
- 25.Fink CC, et al. Morphological control of inositol-1,4,5-trisphosphate-dependent signals. J. Cell Biol. 1999;147:929–936. doi: 10.1083/jcb.147.5.929. [DOI] [PMC free article] [PubMed] [Google Scholar]
- 26.Smith AE, et al. Systems analysis of Ran transport. Science. 2002;295:488–491. doi: 10.1126/science.1064732. [DOI] [PubMed] [Google Scholar]
- 27.Fink CC, et al. An image-based model of calcium waves in differentiated neuroblastoma cells. Biophys. J. 2000;79:163–183. doi: 10.1016/S0006-3495(00)76281-3. [DOI] [PMC free article] [PubMed] [Google Scholar]
- 28.Dundr M, et al. A kinetic framework for a mammalian RNA polymerase in vivo. Science. 2002;298:1623–1626. doi: 10.1126/science.1076164. [DOI] [PubMed] [Google Scholar]
- 29.Firth CJ, Bray D. Stochastic simulation of cell signaling pathways. In: Bower JM, Bolouri H, editors. Computational Modeling of Genetic and Biochemical Networks. The MIT Press; 2000. pp. 263–286. [Google Scholar]
- 30.Hoffmann A, et al. The IkappaB–NF-kappaB signaling module: temporal control and selective gene activation. Science. 2002;298:1241–1245. doi: 10.1126/science.1071914. [DOI] [PubMed] [Google Scholar]
- 31.Haugh JM, Schneider IC. Spatial analysis of 3′ phosphoinositide signaling in living fibroblasts: I. Uniform stimulation model and bounds on dimensionless groups. Biophys. J. 2004;86:589–598. doi: 10.1016/S0006-3495(04)74137-5. [DOI] [PMC free article] [PubMed] [Google Scholar]
- 32.Schneider IC, Haugh JM. Spatial analysis of 3′ phosphoinositide signaling in living fibroblasts: II. Parameter estimates for individual cells from experiments. Biophys. J. 2004;86:599–608. doi: 10.1016/S0006-3495(04)74138-7. [DOI] [PMC free article] [PubMed] [Google Scholar]
- 33.Haugh JM. A unified model for signal transduction reactions in cellular membranes. Biophys. J. 2002;82:591–604. doi: 10.1016/S0006-3495(02)75424-6. [DOI] [PMC free article] [PubMed] [Google Scholar]
- 34.Shvartsman SY, et al. Modeling and computational analysis of EGF receptor-mediated cell communication in Drosophila oogenesis. Development. 2002;129:2577–2589. doi: 10.1242/dev.129.11.2577. [DOI] [PubMed] [Google Scholar]
- 35.Houchmandzadeh B, et al. Establishment of developmental precision and proportions in the early Drosophila embryo. Nature. 2002;415:798–802. doi: 10.1038/415798a. [DOI] [PubMed] [Google Scholar]
- 36.Resat H, et al. An integrated model of epidermal growth factor receptor trafficking and signal transduction. Biophys. J. 2003;85:730–743. doi: 10.1016/s0006-3495(03)74516-0. [DOI] [PMC free article] [PubMed] [Google Scholar]
- 37.Franks KM, et al. A Monte Carlo model reveals independent signaling at central glutamatergic synapses. Biophys. J. 2002;83:2333–2348. doi: 10.1016/S0006-3495(02)75248-X. [DOI] [PMC free article] [PubMed] [Google Scholar]
- 38.Lee KH, et al. The immunological synapse balances T cell receptor signaling and degradation. Science. 2003;302:1218–1222. doi: 10.1126/science.1086507. [DOI] [PubMed] [Google Scholar]
- 39.Bhalla US, Iyengar R. Emergent properties of networks of biological signaling pathways. Science. 1999;283:381–387. doi: 10.1126/science.283.5400.381. [DOI] [PubMed] [Google Scholar]
- 40.Ferrell JE., Jr. Self-perpetuating states in signal transduction: positive feedback, double-negative feedback and bistability. Curr. Opin. Cell Biol. 2002;14:140–148. doi: 10.1016/s0955-0674(02)00314-9. [DOI] [PubMed] [Google Scholar]
- 41.Bhalla US, Iyengar R. Robustness of the bistable behavior of a biological signaling feedback loop. Chaos. 2001;11:221–226. doi: 10.1063/1.1350440. [DOI] [PubMed] [Google Scholar]
- 42.Bagowski CP, Ferrell JE., Jr. Bistability in the JNK cascade. Curr. Biol. 2001;11:1176–1182. doi: 10.1016/s0960-9822(01)00330-x. [DOI] [PubMed] [Google Scholar]
- 43.Schlessinger J, Ullrich A. Growth factor signaling by receptor tyrosine kinases. Neuron. 1992;9:383–391. doi: 10.1016/0896-6273(92)90177-f. [DOI] [PubMed] [Google Scholar]
- 44.Chiu VK, et al. Ras signalling on the endoplasmic reticulum and the Golgi. Nat. Cell Biol. 2002;4:343–350. doi: 10.1038/ncb783. [DOI] [PubMed] [Google Scholar]
- 45.Bivona TG, et al. Phospholipase Cγ activates Ras on the Golgi apparatus by means of RasGRP1. Nature. 2003;424:694–698. doi: 10.1038/nature01806. [DOI] [PubMed] [Google Scholar]
- 46.Ebinu JO, et al. RasGRP, a Ras guanyl nucleotide-releasing protein with calcium- and diacylglycerol-binding motifs. Science. 1998;280:1082–1086. doi: 10.1126/science.280.5366.1082. [DOI] [PubMed] [Google Scholar]
- 47.Cullen PJ, Lockyer PJ. Integration of calcium and Ras signaling. Nat. Rev. Mol. Cell Biol. 2002;3:339–348. doi: 10.1038/nrm808. [DOI] [PubMed] [Google Scholar]
- 48.Brightman FA, Fell DA. Differential feedback regulation of the MAPK cascade underlies the quantitative differences in EGF and NGF signalling in PC12 cells. FEBS Lett. 2000;482:169–174. doi: 10.1016/s0014-5793(00)02037-8. [DOI] [PubMed] [Google Scholar]
- 49.Yamada S, et al. Model analysis of difference between EGF pathway and FGF pathway. Biochem. Biophys. Res. Commun. 2004;314:1113–1120. doi: 10.1016/j.bbrc.2004.01.009. [DOI] [PubMed] [Google Scholar]
- 50.Schamel WW, Dick TP. Signal transduction: specificity of growth factors explained by parallel distributed processing. Med. Hypotheses. 1996;47:249–255. doi: 10.1016/s0306-9877(96)90088-2. [DOI] [PubMed] [Google Scholar]
- 51.Traverse S, et al. EGF triggers neuronal differentiation of PC12 cells that overexpress the EGF receptor. Curr. Biol. 1994;4:694–701. doi: 10.1016/s0960-9822(00)00154-8. [DOI] [PubMed] [Google Scholar]
- 52.Mark MD, et al. Stimulation of neurite outgrowth in PC12 cells by EGF and KCl depolarization: a Ca(2+)-independent phenomenon. J. Cell Biol. 1995;130:701–710. doi: 10.1083/jcb.130.3.701. [DOI] [PMC free article] [PubMed] [Google Scholar]
- 53.Murphy LO, et al. Molecular interpretation of ERK signal duration by immediate early gene products. Nat. Cell Biol. 2002;4:556–564. doi: 10.1038/ncb822. [DOI] [PubMed] [Google Scholar]
- 54.Murphy LO, et al. A network of immediate early gene products propagates subtle differences in mitogen-activated protein kinase signal amplitude and duration. Mol. Cell. Biol. 2004;24:144–153. doi: 10.1128/MCB.24.1.144-153.2004. [DOI] [PMC free article] [PubMed] [Google Scholar]
- 55.Okazaki K, Sagata N. The Mos/MAP kinase pathway stabilizes c-Fos by phosphorylation and augments its transforming activity in NIH 3T3 cells. EMBO J. 1995;14:5048–5059. doi: 10.1002/j.1460-2075.1995.tb00187.x. [DOI] [PMC free article] [PubMed] [Google Scholar]
- 56.Chen RH, et al. Phosphorylation of c-Fos at the C-terminus enhances its transforming activity. Oncogene. 1996;12:1493–1502. [PubMed] [Google Scholar]
- 57.Sun H, et al. MKP-1 (3CH134), an immediate early gene product, is a dual specificity phosphatase that dephosphorylates MAP kinase in vivo. Cell. 1993;75:487–493. doi: 10.1016/0092-8674(93)90383-2. [DOI] [PubMed] [Google Scholar]
- 58.Bhalla US, et al. MAP kinase phosphatase as a locus of flexibility in a mitogen-activated protein kinase signaling network. Science. 2002;297:1018–1023. doi: 10.1126/science.1068873. [DOI] [PubMed] [Google Scholar]
- 59.Vasudeva K, Bhalla US. Adaptive stochastic-deterministic chemical kinetic simulations. Bioinformatics. 2004;20:78–84. doi: 10.1093/bioinformatics/btg376. [DOI] [PubMed] [Google Scholar]
- 60.Puchalka J, Kierzek AM. Bridging the gap between stochastic and deterministic regimes in the kinetic simulations of the biochemical reaction networks. Biophys. J. 2004;86:1357–1372. doi: 10.1016/S0006-3495(04)74207-1. [DOI] [PMC free article] [PubMed] [Google Scholar]
- 61.Mogilner A, Oster G. Force generation by actin polymerization II: the elastic ratchet and tethered filaments. Biophys. J. 2003;84:1591–1605. doi: 10.1016/S0006-3495(03)74969-8. [DOI] [PMC free article] [PubMed] [Google Scholar]
- 62.Peskin CS, et al. Cellular motions and thermal fluctuations: the Brownian ratchet. Biophys. J. 1993;65:316–324. doi: 10.1016/S0006-3495(93)81035-X. [DOI] [PMC free article] [PubMed] [Google Scholar]
- 63.Pollard TD, Borisy GG. Cellular motility driven by assembly and disassembly of actin filaments. Cell. 2003;112:453–465. doi: 10.1016/s0092-8674(03)00120-x. [DOI] [PubMed] [Google Scholar]
- 64.Weiner OD, et al. Spatial control of actin polymerization during neutrophil chemotaxis. Nat. Cell Biol. 1999;1:75–81. doi: 10.1038/10042. [DOI] [PMC free article] [PubMed] [Google Scholar]
- 65.Welch MD, et al. Actin polymerization is induced by Arp2/3 protein complex at the surface of Listeria monocytogenes. Nature. 1997;385:265–269. doi: 10.1038/385265a0. [DOI] [PubMed] [Google Scholar]
- 66.Mallavarapu A, Mitchison T. Regulated actin cytoskeleton assembly at filopodium tips controls their extension and retraction. J. Cell Biol. 1999;146:1097–1106. doi: 10.1083/jcb.146.5.1097. [DOI] [PMC free article] [PubMed] [Google Scholar]
- 67.Bell GI. Models for the specific adhesion of cells to cells. Science. 1978;200:618–627. doi: 10.1126/science.347575. [DOI] [PubMed] [Google Scholar]
- 68.Howard J. Mechanics of Motor Proteins and the Cytoskeleton. Sinauer Associates; 2001. [Google Scholar]
- 69.Theriot JA. The polymerization motor. Traffic. 2000;1:19–28. doi: 10.1034/j.1600-0854.2000.010104.x. [DOI] [PubMed] [Google Scholar]
- 70.Gerbal F, et al. An elastic analysis of Listeria monocytogenes propulsion. Biophys. J. 2000;79:2259–2275. doi: 10.1016/S0006-3495(00)76473-3. [DOI] [PMC free article] [PubMed] [Google Scholar]
- 71.Tsien RY, et al. FRET for studying intracellular signalling. Trends Cell Biol. 1993;3:242–245. doi: 10.1016/0962-8924(93)90124-j. [DOI] [PubMed] [Google Scholar]
- 72.Violin JD, et al. A genetically encoded fluorescent reporter reveals oscillatory phosphorylation by protein kinase C. J. Cell Biol. 2003;161:899–909. doi: 10.1083/jcb.200302125. [DOI] [PMC free article] [PubMed] [Google Scholar]
- 73.Dundr M, et al. Quantitation of GFP-fusion proteins in single living cells. J. Struct. Biol. 2002;140:92–99. doi: 10.1016/s1047-8477(02)00521-x. [DOI] [PubMed] [Google Scholar]
- 74.Slepchenko BM, et al. Quantitative cell biology with the Virtual Cell. Trends Cell Biol. 2003;13:570–576. doi: 10.1016/j.tcb.2003.09.002. [DOI] [PubMed] [Google Scholar]
- 75.McAdams HH, Shapiro L. A bacterial cell-cycle regulatory network operating in time and space. Science. 2003;301:1874–1877. doi: 10.1126/science.1087694. [DOI] [PubMed] [Google Scholar]
- 76.Maskery SM, et al. Growth Cone Pathfinding: a competition between deterministic and stochastic events. BMC Neurosci. 2004;5:22. doi: 10.1186/1471-2202-5-22. [DOI] [PMC free article] [PubMed] [Google Scholar]
- 77.Saucerman JJ, et al. Modeling beta-adrenergic control of cardiac myocyte contractility in silico. J. Biol. Chem. 2003;278:47997–48003. doi: 10.1074/jbc.M308362200. [DOI] [PubMed] [Google Scholar]
- 78.Eungdamrong NJ, Iyengar R. Modeling cell signaling networks. Biol. Cell. 2004;96:355–362. doi: 10.1016/j.biolcel.2004.03.004. [DOI] [PMC free article] [PubMed] [Google Scholar]
- 79.Wolf DM, Arkin AP. Fifteen minutes of fim: control of type 1 pili expression in E. coli. OMICS. 2002;6:91–114. doi: 10.1089/15362310252780852. [DOI] [PubMed] [Google Scholar]
- 80.Rao CV, et al. Control, exploitation and tolerance of intracellular noise. Nature. 2002;420:231–237. doi: 10.1038/nature01258. [DOI] [PubMed] [Google Scholar]
- 81.Mellman I, Misteli T. Computational cell biology. J. Cell Biol. 2003;161:463–464. doi: 10.1083/jcb.200303202. [DOI] [PMC free article] [PubMed] [Google Scholar]
Associated Data
This section collects any data citations, data availability statements, or supplementary materials included in this article.