

Abstract
Tumor-associated stroma is typified by a persistent, non-resolving inflammatory response that enhances tumor angiogenesis, growth and metastasis. Inflammation in tumors is instigated by heterotypic interactions between malignant tumor cells, vascular endothelium, fibroblasts, immune and inflammatory cells. We found that tumor-associated adipocytes also contribute to inflammation. We have analyzed peritumoral adipose tissue in a syngeneic mouse melanoma model. Compared to control adipose tissue, adipose tissue juxtaposed to implanted tumors exhibited reduced adipocyte size, extensive fibrosis, increased angiogenesis and a dense macrophage infiltrate. A mouse cytokine protein array revealed up-regulation of inflammatory mediators including IL-6, CXCL1, MCP-1, MIP-2 and TIMP-1 in peritumoral versus counterpart adipose tissues. CD11b+ macrophages contributed strongly to the inflammatory activity. These macrophages were isolated from peritumoral adipose tissue and found to overexpress ARG1, NOS2, CD301, CD163, MCP-1 and VEGF, which are indicative of both M1 and M2 polarization. Tumors implanted at a site distant from subcutaneous, anterior adipose tissue were strongly growth-delayed, had fewer blood vessels and were less populated by CD11b+ macrophages. In contrast to normal adipose tissue, micro-dissected peritumoral adipose tissue explants launched numerous vascular sprouts when cultured in an ex vivo model. Thus, inflamed tumor-associated adipose tissue fuels the growth of malignant cells by acting as a proximate source for vascular endothelium and activated pro-inflammatory cells, in particular macrophages.
Keywords: Angiogenesis, Adipose tissue, Tumor-associated macrophage, Fibrosis, Tumor microenvironment, Tumor stroma, Inflammation
Introduction
Both tumors and healing wounds elicit stromal reactions that are characterized by mobilization of pro-inflammatory cells, matrix remodeling, fibroblast activation and angiogenesis [1, 2]. The stromal reaction in wounds is a tightly controlled, physiological process necessary for healing, whereas in tumors, a “smoldering” inflammatory response promotes the survival of malignant cells and stimulates pathophysiological angiogenesis [3]. Heterotypic interactions between malignant cells and the underlying stromal cells are a driving force during progression [4]. Thus, changes in the stroma or nearby tissue may accompany tumor progression and actively contribute to the survival and propagation of malignant cells.
Among the tumor stromal cells are endothelial cells, pericytes, smooth muscle cells, fibroblasts, myofibroblasts and adipocytes. Infiltrating immune cells are represented by lymphocytes, neutrophils and other granulocytes, as well as antigen presenting cells such as dendritic cells and macrophages [1]. Tumor associated macrophages (TAMs) are well-studied for their role in creating a permissive micro-environment for tumor growth [5]. Tumors have a higher number of macrophages when compared to normal tissues [6, 7]. TAMs are derived from circulating monocytes in the blood, which respond to tumor- and stromal-derived chemo-attractants including MCP-1 (CCL2) and SDF-1 (CXCL12) [8-10]. TAMs and other pro-inflammatory cells may be trapped in the tumor microenvironment at the periphery of inflamed tumor blood vessels, associated with fibrosis or localized near areas of necrosis and hypoxia [8, 10-12].
Adipocytes are perhaps the least studied stromal cells in tumors, despite the fact that in some cancer types, particularly breast cancers, malignant cells are in direct contact with the adipocytes [13, 14]. Adipose tissue (AT) is composed of lipid-filled adipocytes and the stromal vascular fraction (SVF). Resident monocytes/macrophages represent a large proportion of the SVF. Macrophages are remarkably plastic cells and can assume multiple phenotypes. Classically activated M1 macrophages, associated with microbial killing, are tumor-suppressive and may lyse tumor cells and stimulate adaptive immunity [15]. Alternatively activated M2 macrophages are associated with tissue remodeling and angiogenesis [15, 16]. It is suggested that TAMs are M2-polarized although they may switch their phenotype depending on tumor grade or stage [17, 18]. Moreover, some TAMs may exhibit a “mixed” phenotype and express pro-inflammatory (e.g. NOS2) and immunosuppressive (e.g. ARG1) factors simultaneously [19, 20].
Excess adiposity (obesity) is associated with an increased cancer risk attributed to higher levels of circulating pro-inflammatory factors and tissue damage caused by the activity of pro-inflammatory cells [21]. Adipocyte-derived trophic factors (adipokines) may also stimulate the growth of tumor cells directly [22]. While AT-associated macrophages (ATMs) have been well-characterized in lean versus obese adipose depots [23-26], tumor-associated AT has not been studied in this regard. We hypothesized that peritumoral AT may serve as a depot for activated, tumor-infiltrating macrophages which could support tumor growth, possibly by stimulating neovascularization and exacerbating inflammation. Collectively our data demonstrate that (1) tumor cells alter an adjacent AT depot by inducing fibrosis, angiogenesis and inflammation (2) macrophages isolated from peritumoral adipose tissue display characteristics of both M1 and M2 phenotypes (3) inflamed, highly vascularized and angiogenic peritumoral AT may support tumor expansion at the periphery. These findings may be of particular relevance for tumors which grow directly within AT (e.g. breast tumors) or in metastases to lymph nodes which are typically ensheathed by adipocytes.
Materials and methods
Mice
7–10 week-old male C57BL/6 mice were used in all experiments and were purchased from The Jackson Laboratory. All animal experiments were performed with the approval of the animal use and care committee at The Children’s Hospital, Boston. Mice were euthanized by CO2 inhalation.
Cell lines
B16F10, Lewis Lung Carcinoma (LLC) and MS1 endothelial cells were obtained from the American Type Culture Collection (ATCC). Tumor cells were grown at 37 °C in 5 % CO2 in Dulbecco’s Modified Eagle’s Medium (DMEM), supplemented with non-essential amino acids, 10 % fetal calf serum, 100U/ml penicillin, 100 μg/ml of streptomycin and 400 μM l-glutamine (Cambrex, Lonza, Switzerland). Endothelial cells were grown at 37 °C in 5 % CO2 in DMEM supplemented with non-essential amino acids, 5 % fetal calf serum, 100U/ml penicillin, 100 μg/ml of streptomycin and 400 μM l-glutamine.
Tumor cell implantation, peritumoral and control adipose tissue collection
For tumor growth studies, cells (1 × 10⁶) were resuspended in 100 μl Matrigel (BD Biosciences) and injected into the anterior, subcutaneous AT depot or along the dorsal midline in C57BL6 mice. The use of matrigel was necessary to prevent tumor cells from spreading beyond the injection site. Tumor growth was measured at regular intervals using calipers. Tumor volume was calculated using the formula a2*b*0.52 where a and b are the shorter and longer diameter of the tumors, respectively. When tumors exceeded 2 cm in diameter, animals were euthanized. For AT studies, peritu-moral AT was collected by microdissection under a stereoscopic microscope. Control AT from the counterpart depot was collected from age- and sex-matched animals.
Adipose tissue incubation and measurement of lipolysis
Lipolysis was measured from control and peritumoral AT explants normalized to 0.2 g. Explants were washed in sterile Hank’s balanced salt solution (HBSS) to remove lipid and cell fragments from cut surfaces and then incubated in DMEM supplemented with non-essential amino acids, 10 % fetal calf serum, 100 U/ml penicillin, 100 μg/ml of streptomycin and 400 μM l-glutamine overnight at 37 °C in 5 % CO2. Hoechst 33258 nuclear staining was performed in order to distinguish lipid droplets from adipocytes. Lipid droplet size was measured using the ImageJ software package available for free from the National Institutes of Health (NIH).
Morphometric analysis of adipocytes
Morphometric data were obtained from >1,000 adipocytes from three 7 μM sections from three different mice per group. Adipocyte volume was determined using NIS-elements AR software from Nikon.
Histochemistry
Oil red O staining
Frozen AT was sectioned in 7 μm slices and mounted on slides. The slides were fixed for 10 min in a 10 % solution of formaldehyde in aqueous phosphate buffer and washed four times with water. This was followed by incubation in 60 % isopropanol for 5 min. Tissue was air-dried and later stained using Oil-Red-O solution for 15 min. After rinsing with isopropanol to remove the Oil-Red-O solution and counterstaining with Mayer’s hematoxylin solution for 2 min, the slides were mounted and observed under light microscopy. To measure neutral triglycerides, control and peritumoral AT were normalized to 0.2 g, minced and stained with Oil Red O according to modified procedure of Janderová et al. [27]. In brief, AT was fixed in a 10 % solution of formaldehyde in aqueous phosphate buffer for 1 h, washed with 60 % isopropanol and then stained with Oil-Red-O solution (in 60 % isopropanol) for 10 min. Tissue was then repeatedly washed with water and destained in 100 % isopropanol for 10 min. The optical density of the isopropanol solution was measured at 500 nm.
Masson’s trichrome staining
Paraffin-embedded AT sections were deparafinized and hydrated in xylene and ethanol and re-fixed for 1 h in Bouin’s solution. After incubation in Harris Hematoxylin solution, the slides were stained with Biebrich Scarlet-Acid Fuchsin, Phosphomolybdic–phosphotungstic acid solution and Aniline Blue and dehydrated in ethanol and xylene. Extensive washes were done between each staining. The collagen fibers were stained blue, the nuclei were stained black. Cytoplasm, muscle and keratin were stained red.
Picrosirius red staining
Paraffin embedded AT sections were deparafinized and hydrated in xylene and ethanol. After incubation in Harris Hematoxylin solution, the slides were stained with Picrosirius Red solution and dehydrated in ethanol and xylene. Washes in two changes of acidified water were done after Picrosirius Red staining. The collagen fibers were stained orange when examined using polarized light microscopy.
Immunohistochemistry and immunofluorescence
Paraffin embedded and frozen sections were used for immunohistochemistry and immunofluorescence. Primary antibodies were as follows: rabbit anti-CD45 (1:500; Abcam), goat anti-CD31 (1:100; Santa Cruz Biotechnology), rabbit anti-LYVE-1 (1:100; Abcam), rat anti-CD301 (1:50; AbD Serotec), rabbit anti-CD163 (1:100; Santa Cruz Biotechnology), rabbit anti-CD11b (1:200; Abcam), rabbit anti-IL6 (1:100; Abcam), rabbit anti-Ki-67 (1:100; Ab-cam), rat anti-CD31 (1:100; Abcam). Secondary antibodies were as follows: Alexa Fluor 488 anti-rat IgG (1:200; Invitrogen). Cy2 anti-rat IgG (1:200, Jackson ImmunoResearch), Cy3 anti-rabbit IgG (1:200, Jackson Immuno Research). Vectastain Elite ABC system kits were used for IHC (Vector Laboratories).
Flow cytometry and FACS
Freshly harvested samples of control and peritumoral AT were incubated with a mixture of collagenase Type-2 (1 mg/ml)/dispase (2.5 μg/ml) and DNase (1 mg/ml) for 1 h at 37 °C with continuous rotation. The dissociated tissue was fractionated by sedimentation centrifugation at 186 g for 10 min and the pelleted stromal vascular fraction was filtered through a 70 μm mesh cell strainer (BD Bioscience) to remove debris. Contaminating erythrocytes were lysed using red blood cell lysis buffer (BD Pharmingen). Single cell suspensions were prepared for flow cytometry by suspension in FACS buffer (0.5 % w/v BSA, 0.5 M EDTA in sterile PBS). Cells were blocked with Fc-blocking reagent (Miltenyi Biotec) to prevent nonspecific binding, labeled with appropriate antibodies for 30 min at 4 °C and then acquired on a BD FACSCalibur (CellQuest Pro software; BD Bioscience), and analyzed using FlowJo software (Tree Star, Inc.).
Preparation of conditioned medium
SF macrophage-conditioned medium was prepared from Cd11b+ cells isolated from control or peritumoral AT by FACS. Twenty-four hours after medium replacement conditioned medium was aspirated and filtered through a 0.22 μm membrane (Millipore) to remove any cell debris and stored at −80 °C. The whole conditioned medium was chosen to maximize the chance of detecting a cell response to soluble factors.
Endothelial cell proliferation assay
Serum-starved MS1 cells were seeded into a 96-well microtiter plate at a final density of 2.5 × 10³ cells/well in 100 μl of SF macrophage-conditioned medium or SF medium supplemented with different concentrations of mIL6 (R&D Systems). After 24 h of incubation, each well was treated with 20 μl of a solution comprising 1.9 mg/mL of MTS [3-(4,5-dimethylthiazol-2-yl)-5-(3-carboxymethoxyphenyl)-2-(4-sulfophenyl)-2 tetrazolium, inner salt; MTS] in phosphate-buffered saline (PBS) pH 6.0. The plate was then incubated for an additional 1 h. The absorbance of the soluble formazan salt was measured against a tetrazolium standard, MTS solution.
Ex vivo angiogenesis assay
Freshly harvested samples of mouse control and peritumoral AT were placed in sterile Endothelial Basal Medium (EBM-2) (Lonza) without supplements. The tissue was cut into 1 mm3 pieces and embedded in an individual well of a 96-well plate containing 50 μl of growth factor–depleted Matrigel (BD Discovery Labware). The size of each piece varied in the range of 1 ± 0.5 mm3. Wells were filled with 200 μl of EBM-2 devoid of growth factors, and half of the media was replaced every second day. After 7 days, the percentage of explants launching capillary branches from control and tumor-bearing mice (n = 4 per group) out of the total number of explants (n = 16 per group) was recorded.
Cytokine protein array
Whole AT protein lysates were incubated with pre-coated cytokine array membranes (Proteome Profiler Arrays, R&D Systems). Densitometric analysis of the dot blots, showing the mean pixel density was performed using ImageJ software. Loading variability between separate membranes was controlled for by densitometry of the positive control spots, followed by normalizing the density of each cytokine to the mean density of positive controls.
RT-PCR
Cd11b+ cells were isolated by FACS and total cellular RNA was extracted using the RNeasy Kit according to the manufacturer’s protocol (Qiagen). RNA purity and quantity was measured spectrophotometrically. Two hundred and fifty ng of RNA was subjected to reverse transcription by standard methods. 1.5 μl of cDNA was then used in a 25 μl PCR reaction containing a 250 nM concentration of each primer, 0.5 μl of dNTPs (10 mM stock), 2.5 μl of 10 × PCR buffer with MgCl2 (Invitrogen), and 0.5 μl of Taq DNA polymerase (Roche).
Statistics
In all experiments, the statistical significance was analyzed by unpaired Student’s t test, using Prism software (GraphPad Inc.). The value of p < 0.05 was considered statistically significant.
Results
Peritumoral AT is characterized by reduced adipocyte size, lipolysis and reduced lipid accumulation in vivo
To characterize peritumoral AT, B16F10 melanoma cells were implanted into one of the anterior subcutaneous AT depots in immunocompetent C57BL6/J mice. At 14 days post implantation, peritumoral AT was carefully microdissected away from the surrounding tumor mass and subcutaneous connective tissue. Gross examination of peritumoral AT revealed an inflamed, dark reddish-white mass compared to control AT from a corresponding depot (Fig. 1A, a). Peritumoral AT weighed almost twice as much as control AT (Fig. 1A, b) although there was no difference in body weight between control and tumor-bearing mice (Fig. 1A, c). Under microscopic examination of H&E-stained sections, peritumoral adipocytes were smaller than their normal counterparts and typified by areas of dense collagen deposition (as judged by eosin stain) (Fig. 1A, d). Adipocytes in breast tissues from autochthonous tumors in C3-Tag mice were also smaller and more sparse compared to normal breast tissues (Fig. 1A, e). When measured using NIS-elements AR software, adipocytes from peritumoral AT were approximately 30 % smaller than adipocytes from control AT. The median size was 666 μm2 (n = 1,369) for peritumoral AT adipocytes and 1,032 μm2 (n = 1,358) for control AT adipocytes (Fig. 1b, a–b). The mean sizes were 824.5 ± 16.29 μm2 for adipocytes from peritumoral AT and 1,179 ± 17.68 μm2 for adipocytes from control AT (p <0.0001) (Fig. 1B, c). There was no difference in the total number of adipocytes between control and peritumoral AT (data not shown).
Fig. 1.
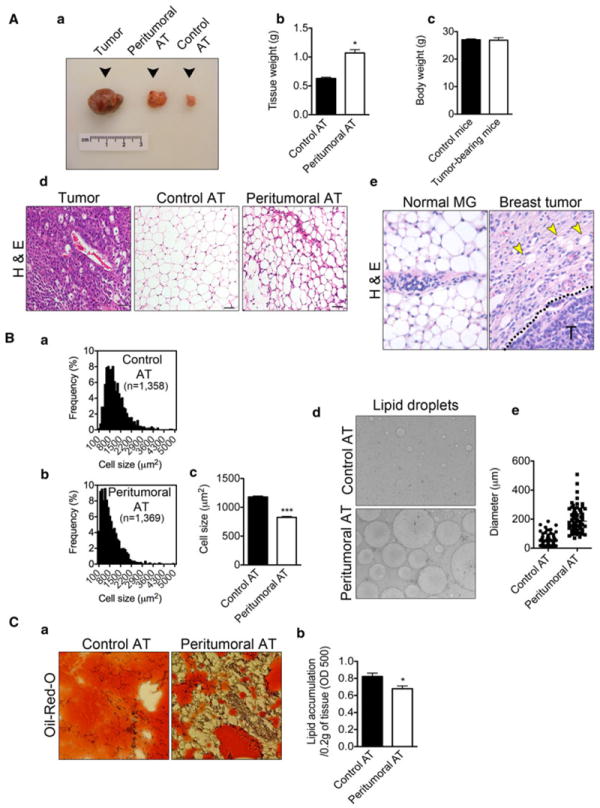
Reduced size of adipocytes, increased lipolysis and decreased lipid content are features of peritumoral AT. Gross morphology examination revealed peritumoral AT as a hypertrophied, highly vascularized, dark reddish-white mass (A, a). Peritumoral AT (n = 6) hypertrophy revealed by increase in tissue mass in comparison to control AT (n = 6) (A, b). Body weights of tumor-bearing mice (n = 6) in comparison to healthy controls (n = 6) (A, c). Hematoxylin-eosin histological examination of tumor tissue (left panel), control AT (middle panel) and peritumoral AT (right panel) revealed reduced size of adipocytes within peritumoral AT together with increased fibrosis. Size bar, 50 μm (A, d). Similar findings observed in breast tissues from autochthonous tumors in C3-Tag mice (A, e). Yellow arrow heads mark adipocytes and “T” marks tumor cells. Adipocyte size distribution from control and peritumoral AT (B, a–b). Average size of adipocytes from control (n = 1,358) and peritumoral AT (n = 1,369) (B, c). Increased lipolysis in peritumoral AT revealed by increased lipid spillage during AT culture (B, d–e). Oil-Red-O histological examination of lipid content in control and peritumoral AT (n = 3) (C, a). Measurement of lipid content in peritumoral and control AT (C, b). Data presented are mean values ± SEM. *p < 0.05; **p < 0.01; and ***p <0.001, Student’s t test
Next, freshly isolated adipocytes from control versus peritumoral AT were placed into culture. After an overnight incubation, we observed increased numbers of lipid droplets from peritumoral AT that were on average 2-5 fold larger than those from control AT (lipid droplet diameter was measured using ImageJ software, n = 100) (Fig. 1B, d–e). Hoechst 33258 nuclear staining allowed distinguishing lipid droplets from true adipocytes (not shown). In vivo, when normalized as a per tissue mass basis, there was a 17 % decrease in lipid accumulation in peritumoral versus control AT determined by extracting Oil-Red-O and measuring the absorbance at 500 nm according to modified procedure of Janderová et al. [27] (Fig. 1C, a–b). Taken together, these results suggest that peritumoral AT is characterized by smaller adipocytes, lipolysis and decreased lipid accumulation.
Peritumoral AT is characterized by extensive fibrosis and greater blood vessel density
We hypothesized that decreased lipid accumulation in peritumoral AT might be explained by increased collagen content, fibrosis and loss of adipocyte function (as judged by eosin and Oil-Red-O staining). Masson’s and Picrosirius Red stains were used to identify collagen. When measured by NIS-elements AR software, a 2-3 fold increase in collagen content was observed in peritumoral versus control AT using Masson’s trichrome (Figs. 2A, B, a). Furthermore, increased numbers of vessels filled with red blood cells were observed within peritumoral AT (Figs. 2A, B, b–c). After confirming peritumoral AT fibrosis using Picrosirius Red (Fig. 2C, a–b), we performed immunohistochemical staining using CD31 as a pan-EC marker. The results confirmed an increased number of blood vessels in peritumoral AT when compared to control AT (Fig. 2C, c). Notably, the majority of blood vessels were localized within or adjacent to fibrotic areas as shown in Fig. 2A above.
Fig. 2.
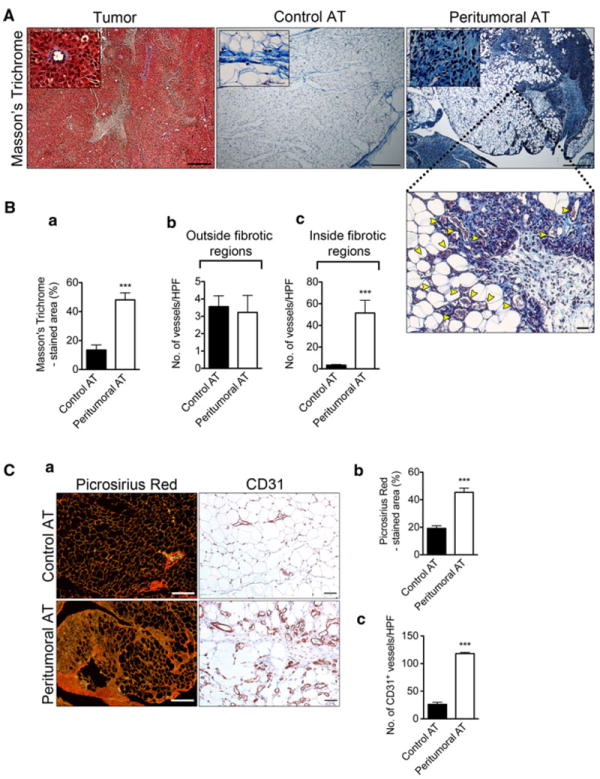
Increased fibrosis and number of blood vessels within fibrotic areas of peritumoral AT. Masson’s Trichrome histological examination of tumor tissue (left panel), control AT (middle panel) and peritumoral AT (right panel) (A) at low (size bar, 200 μm) and high magnification (size bar, 50 μm). Histological examination revealed increased number of blood vessels within peritumoral AT restricted to fibrotic areas (A). Yellow arrow heads clearly mark blood vessels. Quantification of Masson’s Trichrome staining (B, a). Quantification of blood vessels within control and peritumoral AT fibrotic regions (B, b–c). Picrosirius red histological examination of control and peritumoral AT using polarized light microscopy. Size bar, 100 μm (C, a, left panel). Quantification of Picrosirius Red staining (C, b). Immunohistochemical analysis of tissue sections from control and peritumoral AT using CD31 (C, a—right panel). Total number of blood vessels within control and peritumoral AT (C, c). Data presented are mean values ± SEM. *p < 0.05; **p < 0.01; and ***p < 0.001, Student’s t test
Peritumoral AT is enriched with macrophages that express the C-type lectin 10A (CLEC10A/CD301), a marker of M2 polarization
Fibrotic areas within peritumoral AT were infiltrated by what appeared to be mononuclear cells. To define the cellular component of these fibrotic areas, control and peritumoral AT were examined using immunohistochemistry. This analysis revealed a massive infiltration of CD45-positive hematopoietic cells in peritumoral AT (Fig. 3A). Since macrophages, for example in obese subjects, can constitute up to 40 % of the cell population within AT [24, 28], we quantitatively and qualitatively characterized macrophages in control and peritumoral AT. Flow cytometric analysis using CD11b and CD301 antibodies was performed. When normalized to 0.2 g of tissue, the number of both CD11b+/CD301− (17,078 ± 4,403 cells/depot vs. 1,339 ± 222 cells/depot, n = 3, p < 0.05) and CD11b+/CD301+ (112,128 ± 6,510 cells/depot vs. 1,606 ± 93 cells/depot, n = 3, p <0.0001) cells was greater in peritumoral AT compared to control AT (Fig. 3B). Within control AT, there was no statistically significant difference between CD11b+/CD301− and CD11b+/CD301+ cells, whereas within peritumoral AT there was a 6.6-fold increase in the number of CD11b+/CD301+ cells (Fig. 3B, graph). Immunohistochemical analysis using antibodies against CD301 and CD163 (a scavenger receptor expressed by monocytes/macrophages) revealed that the majority of positively stained cells were found mainly within fibrotic and highly vascularized areas (Fig. 3C, a–c), suggesting that the formation of blood vessels could be related to the infiltration of macrophages.
Fig. 3.
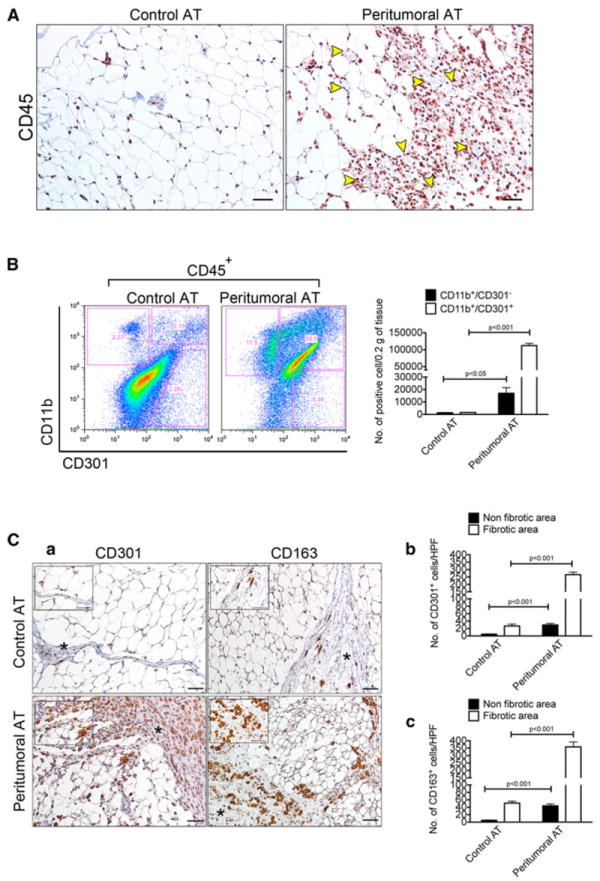
Peritumoral AT is infiltrated by M2 macrophages based on surface marker expression. Immunohistochemical analysis for the pan-leukocyte marker CD45 revealed massive infiltration of immune cells in peritumoral AT. Size bar, 50 μm (A). Yellow arrowheads clearly mark blood vessels. Flow cytometric analysis of the M2 macrophage marker CD301 in control and peritumoral AT. Note that 100 % of analyzed cells are CD45+ (B). Quantification of CD11b+/CD301+ and CD11b+/CD301− cells between and within the same control (n = 3) and peritumoral AT (n = 3) depot. Results were normalized to 0.2 g of tissue (B). Immunohistochemical analysis for the CD301 and CD163 M2 macrophage markers in control and peritumoral AT. Size bar, 50 μm (C, a). Fibrotic areas are marked by an asterisk. Quantification of CD301+ and CD163+ cells between and within the same control (n = 3) and peritumoral AT (n = 3) depot revealed accumulation of macrophages within fibrotic areas. Data presented are mean values ± SEM. *p <0.05; **p < 0.01; and ***p < 0.001, Student’s t test
Peritumoral AT is characterized by an up-regulation of pro-inflammatory cytokines and chemokines
Next, we characterized the cytokine expression signature of peritumoral versus control AT using proteome profiler arrays specific for mouse cytokines. Of 40 total cytokines, the majority were unchanged in peritumoral versus control AT. However, IL-6, CXCL1, MCP-1, MIP-2, and TIMP-1 were expressed 2-6 fold higher in peritumoral AT compared to control AT (Fig. 4A, a–b). On the other hand, IL-16 expression was about 2 fold lower in peritumoral versus control AT. Because IL-6 showed the most striking difference in peritumoral versus control AT we further characterized IL-6 expression using immunohistochemistry. The results showed intense IL-6 expression in peritumoral AT (Fig. 4B, a). IL-6 appeared to co-localize with vascular and mononuclear cells. Colocalization of IL-6 with CD11b, confirmed IL-6 expression in monocytes/macrophages (Fig. 4B, b). We hypothesized that macrophage or vascular-derived IL-6 might stimulate proliferation of vascular endothelial cells [8, 11, 29]. To test this possibility, we examined mouse endothelial cell proliferation under IL-6 stimulation in low serum conditions. Quantification of endothelial cell numbers showed a 2-2.5 fold increase in proliferation in IL-6-treated versus untreated controls (Fig. 4B, c).
Fig. 4.
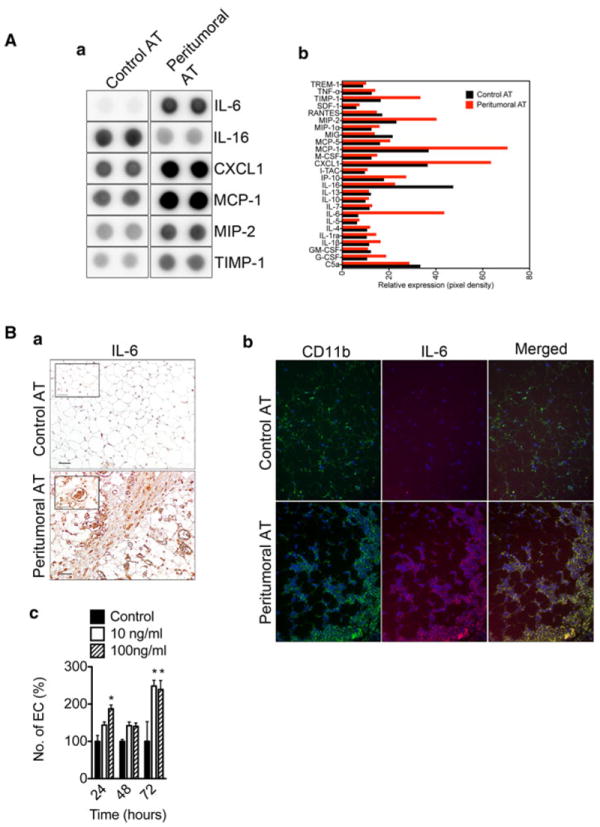
Over-expression of pro-inflammatory cytokines within peritumoral AT. Mouse cytokine protein arrays were performed using control and peritumoral AT pooled from four mice per group. Array analysis revealed increased expression of pro-inflammatory cytokines within peritumoral AT (A, a). Results are in duplicate. Quantification of the mouse cytokine array data (A, b). Immunohistochemical analysis for IL-6 reveals the presence of IL-6 positive immune and endothelial cells in peritumoral AT. Size bar, 50 μm (B, a). The inset shows a blood vessel stained positive for IL-6. Immunofluorescence analysis of control and peritumoral AT shows CD11b+ macrophages co-expressing IL-6 (B, b). Increased proliferative potential of MS1 mouse endothelial cells upon stimulation with IL-6 (B, c). Data presented are mean values ± SEM. *p <0.05; **p < 0.01; and ***p < 0.001, Student’s t test
Peritumoral AT-associated macrophages are closely aligned with vascular structures and they express markers of both M1 and M2 polarization
Immunohistochemical analysis showed that CD11b+ macrophages within peritumoral AT were typically found surrounding blood vessels, or tethered to the blood vessel wall (Fig. 5A, a). Vascular cells within peritumoral AT were also Ki-67 positive suggesting that these cells were proliferating (Fig. 5A, a). Ki-67 staining could be co-localized with the endothelial cell marker CD31 (data not shown). Next CD11b+ macrophages from control AT, peritumoral AT and tumors (TAMs) were sorted by FACS and analyzed for markers of M1- and M2-polarization. RT-PCR showed appropriate sorting of the macrophages based on expression of F4/80 (Fig. 5A, b). Both TAMs and peritumoral AT macrophages expressed the M2 macrophage markers ARG1 and VEGFA. The M1 macrophage markers NOS2 and MCP-1 were also expressed by TAMs and macrophages from peritumoral AT (Fig. 5A, b). These results suggest that macrophages from peritumoral AT are qualitatively different from control AT and closely resemble TAMs and that either two distinct populations of macrophages are present or that M1 and M2 markers are co-expressed in a single population.
Fig. 5.
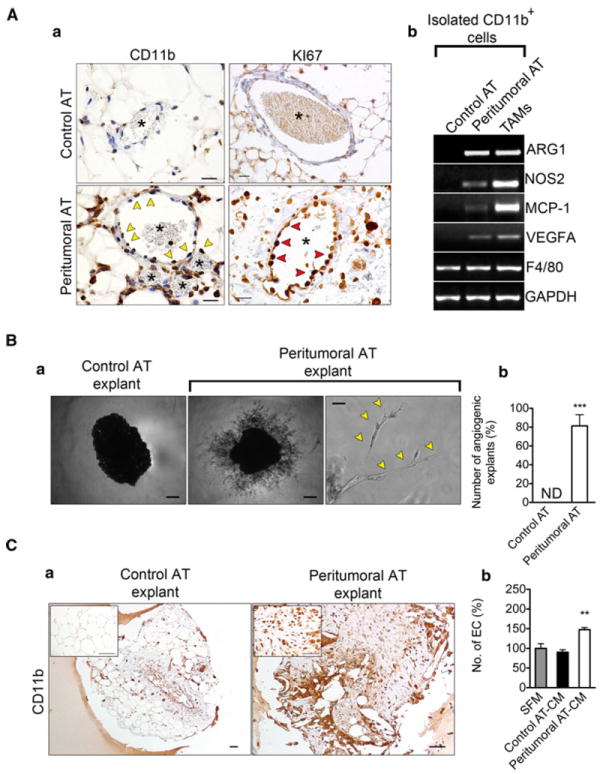
Increased angiogenic potential in peritumoral AT is associated with the presence of CD11b+ macrophages. Immunohistochemical analysis of control and peritumoral AT revealed CD11b+ cells (yellow arrow heads) surrounding blood vessels (asterisk) exhibiting proliferative potential (A, a). Ki-67+ cells are marked with red arrowheads. FACS sorted CD11b+ macrophages from peritumoral AT express markers of both M1 and M2 polarization as revealed by RT-PCR (A, b). Representative examples of explants from control or peritumoral AT after seven days in culture (B, a). Quantification of AT explants with capillary sprouts present (n = 16, per group) (B, b). Yellow arrow heads mark vascular structures, “ND” = none-detected. Immunohistochemical analysis of AT explants from control and peritumoral AT revealed persistence of CD11b+ cells in highly angiogenic peritumoral AT explants (C, a). Increased proliferative potential of MS1 mouse endothelial cells upon stimulation with macrophage-conditioned medium using macrophages isolated from peritumoral AT (peritumoral AT-CM), macrophages from control AT (control AT-CM) or serum-free medium (SFM). Data presented are mean values ± SEM. *p < 0.05; **p < 0.01; and ***p < 0.001, Student’s t test
To gain insight into the angiogenic potential of peritumoral AT versus control AT we performed a modified ex vivo AT angiogenesis assay originally described by Gealekman et al. [30]. One week after AT explants were embedded in growth factor reduced matrigel, capillary sprouts emerged from peritumoral, but not control AT explants. (Fig. 5B, a–b). Immunohistochemical analysis of tissue explants revealed that CD11b+ cells persisted within peritumoral AT during the course of the experiment (7 days) (Fig. 5C, a). We speculated that the increased angiogenic capacity of peritumoral AT was related to the presence of activated macrophages. To examine this possibility, we collected conditioned medium (CM) from freshly isolated control or peritumoral AT Cd11b+ cells. CM from peritumoral AT macrophages alone was sufficient to stimulate EC proliferation above controls by 1.5 fold (Fig. 5C, b).
Tumors implanted at a site distant from flank white adipose tissue are growth delayed, less angiogenic and contain fewer monocytes/macrophages
In mice, two white AT depots are located along the scapula and near the hind limbs. We took advantage of the anatomic position of these AT depots to examine differences in tumor growth and neovascularization when tumors were implanted directly within an AT depot, or in site distant from one of these depots. B16F10 melanoma cells or Lewis Lung Carcinoma (LLC) cells were implanted into one of the anterior subcutaneous AT depots (fat pad) or into the dorsal midline (no fat pad) of the same mouse. There was a striking difference in tumor appearance depending on where tumor cells were implanted (Fig. 6A, a). B16F10 tumors implanted along the midline were pale in appearance and appeared less vascular. Tumor cells implanted in AT grew more rapidly, were more vascularized and weighed 2-4 fold more than those implanted along the dorsal midline for both B16F10 (Fig. 6A, b, c) and LLC (Fig. 6A, d, e). Next, we assessed the tumor vasculature in tumors implanted in the two different anatomical sites. Immunohistochemical analysis of CD31 expression showed a 3 fold increase blood vessel density and a 4 fold increase in blood vessel area in tumors growing in AT compared to those growing along the dorsal midline (Fig. 6B, a–c). Furthermore, tumors growing within AT were replete with CD11b+ monocytic cells, in contrast to those growing along the dorsal midline (Fig. 6B, d). Taken together, these results suggest that tumors growing within or near AT are more vascular, they harbor more pro-inflammatory cells and they have a growth advantage compared to those tumors grown without a nearby AT depot.
Fig. 6.
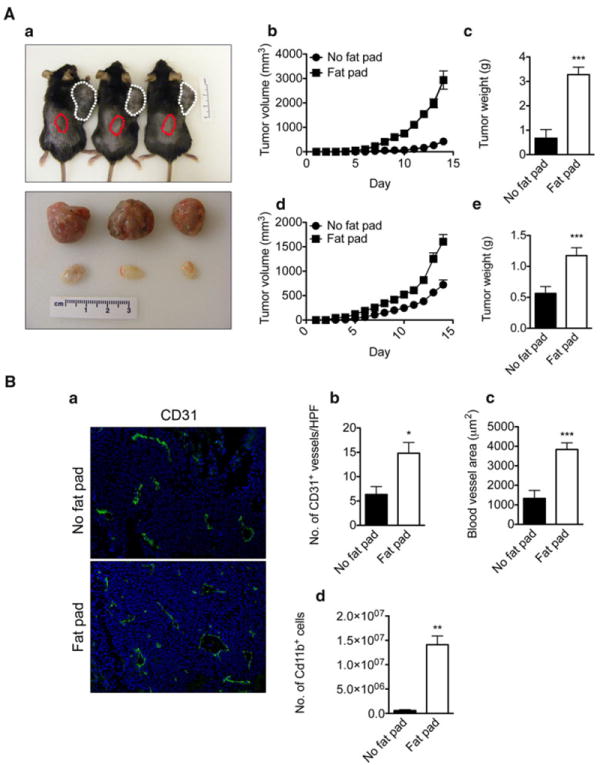
AT accelerates tumor growth by affecting its neovascularization. Representative photograph of mice 14 days after B16F10 cells injection (A, a). B16F10 melanoma cells (1 × 10⁶) were co-injected with Matrigel into the anterior subcutaneous AT depot (white dotted line) and dorsal midline devoid of AT (red dotted line) of C57BL6 mice. At the end of the experiment, tumors were removed and photographed. Three tumors from AT (top) are compared with three tumors from the dorsal midline (bottom) of the same mouse (bottom photograph). Tumor growth is shown during the two weeks after injection (n = 6) (A, a). Accelerated B16F10 mouse melanoma (A, b) and Lewis Lung Carcinoma (LLC) (A, d) growth in subcutaneous AT. At sacrifice, tumors were removed and weighed. Quantification of B16F10 (n = 6, per group) (A, c) and LLC tumor weights (A, e) (n = 6, per group). Immunohistochemical analysis of tumor samples from fat-pad and non-fat pad using the endothelial cell marker, CD31 (B, a). Quantification of blood vessels (B, b) and their diameters (B, c) revealed increased numbers and diameters of blood vessels in tumors growing in AT. Flow cytometric analysis of CD11b+ macrophages in tumors from fat-pad and non-fat pad (B, d) shows increased numbers of positive cells in tumors grown in AT. Data presented are mean values ± SEM. *p < 0.05; **p < 0.01; and ***p < 0.001, Student’s t test
Discussion
Although normal cells and tissue architecture may impede cancer growth and underlie the persistence of occult tumors, occasionally, tissue homeostasis is disrupted and the scales are tipped towards a microenvironment that favors tumor progression [31]. For example, the “angiogenic switch” whereby tumors acquire the ability to stimulate neovascularization greatly enables tumor expansion [32, 33]. Similarly, tumor-associated inflammation, which could be fueled by the activity of oncogenes or associated with tissue damage and hypoxia, creates a permissive microenvironment favorable for tumor growth. While malignant cells are primarily dependent on cell-autonomous mutations that result in their immortality [33], three-dimensional growth beyond a few millimeters requires collaboration with stromal cells which provide additional growth and survival signals, cellular scaffolds and blood vessels [34-36].
It is well established that stromal cells in tumors do not resemble their counterparts in normal tissue. There are multiple reports of morphological, cytogenetic, and epigenetic alterations in the stroma or tissue located at the periphery of various malignancies [1, 37, 38]. These studies have primarily focused on tumor-associated fibroblasts or mesenchymal-like cells which, along with pro-inflammatory cells, comprise perhaps the largest proportion of the stromal compartment. Spurred by the observation that adipose tissue located adjacent to tumors implanted under the skin in mice was inflamed, fibrotic and replete with pro-inflammatory cells, we have characterized tumor-associated AT using immunohistochemistry, high-throuput proteome arrays and gene expression analysis of freshly isolated adipocytes and AT-associated macrophages.
Adipocytes from peritumoral AT were reduced in size and lipid content when compared to their normal counterparts suggestive of lipolysis and modification of adipocyte basement membranes [13]. Similar to what occurs in tumor blood vessels [39, 40], biomechanical forces created by the growing mass of tumor cells may “squeeze” the tumor-associated adipocytes resulting in distortion of cellular membranes and rupture. Adipocyte membranes are fragile and vulnerable to mechanical pressure; thus, spillage of lipids and triglycerides from damaged adipocytes could trigger macrophage activation and inflammation [26]. Nieman et al. demonstrated that adipocyte/cancer cell co-culture leads to the transfer of lipids from adipocytes to cancer cells, which accelerates tumor cell proliferation in vitro and in vivo [41]. Additionally, adipocytes undergo lipolysis whereas cancer cells undergo beta-oxidation, suggesting that adipocytes act as an energy source by providing free fatty acids (FFA) needed for tumor growth [41].
It is suggested that adipocytes are diminished during early steps of tumor progression; thus, histological images of tumor biopsies frequently contain few adipocytes [13]. Accounting for this feature, tumor-associated adipocytes, after undergoing a process of de-differentiation, may form tumor-associated fibroblasts [42, 43]. Adipocyte de-differentiation into mesenchymal-like cells could therefore represent one source of fibrosis and collagen deposition we observed in peritumoral versus control AT depots. Endothelial cells undergoing endothelial-to-mesenchymal transition may also give rise to fibroblast-like cells in tumors [44] and in sites of inflammation [45]. There are clear links between fibrosis and inflammation, especially in the kidney, gut and in tumors [46]. For example, obstructive nephropathy has a major inflammatory component, characterized by increased expression of pro-inflammatory cytokines including TNF-α and IL-1 and increased infiltration of macrophages and lymphocytes [47]. Recently, granulin+ neutrophils were shown to stimulate fibrosis and formation of desmoplastic stroma in breast cancer [48]. Macrophages both stimulate and resolve fibrosis [49]. Macrophage depletion during the recovery phase in a reversible model of liver injury led to a failure of matrix degradation [49]. Wound healing in PU.1-null mice, which essentially lack macrophages, occurs in the absence of fibrosis [50, 51]. In MCP-1(−/−) mice, which lack monocytes, tissue repair is characterized by delayed angiogenesis and reduced collagen synthesis [52]. TIMP-1 is suggested to play a role in fibrosis and collagen deposition because it inhibits the activity of macrophage-derived matrix metalloproteinases (MMPs) including MMP2 and MMP9 [53]. We found that TIMP-1 expression was two-fold higher in peritumoral AT compared to counterpart AT. Peritumoral AT was also highly vascularized, and the majority of blood vessels were localized within fibrotic areas [54]. One possibility is that the overproduction of TIMP-1 in peritumoral AT blocks the activity of MMPs, which enables fibrosis and angiogenesis. Interestingly, Liu et al. demonstrated that fibroblast-derived TIMP-1 enhances the tube-forming abilities of endothelial cells in an in vitro model [55].
Macrophages patrol most tissues throughout the body. Their numbers increase during inflammation, wounding and malignancy through both increased mobilization and proliferation of resident macrophages [50, 56]. Peritumoral AT harbored greater numbers of monocytes/macrophages compared to counterpart AT. The source for these macrophages may be the bone marrow, spleen or proliferation of resident AT-associated macrophages. Jenkins et al. found that macrophage proliferation, rather than recruitment, was the principle source of M2-polarized macrophages in sites of inflammation related to pathogen infection [57]. We found a large number of Ki-67+ macrophages in peritumoral AT consistent with proliferation; however, we cannot rule out the possibility that new macrophages in peritumoral AT are derived from multiple sources, including the circulation. Indeed, we found increased expression of monocyte/macrophage chemotactic factors including CXCL1, macrophage-inflammatory protein-2 (MIP-2) and monocyte chemotactic protein-1 (MCP-1) in peritumoral AT. As shown by Tanimoto et al., antibodies against CXCR2, a receptor for CXCL1 and MIP-2, almost completely inhibited the infiltration of neutrophils and monocytes/macrophages in an inflammation model induced by injection of necrotic leukemic P388 cells into the peritumoral cavity [58]. On the other hand, administration of an antibody against MCP-1 alone inhibited the infiltration of monocytes/macrophages but not neutrophils [58]. These data indicate that necrotic cells alone induce inflammation and suggest that CXCL1, MIP-2 and MCP-1 play important roles in the infiltration of inflammatory cells during this process. Moreover, Armstrong et al. demonstrated that CXCL1 and MIP-2 are expressed by different cell types at different times following tissue injury. Fibroblasts and endothelial cells are the main source of CXCL1 in the skin six hours after injury whereas later production of MIP-2 is confined to inflammatory cells including neutrophils and monocytes/macrophages [59].
In wounds, macrophages operate as phagocytes, which scavenge matrix and cellular debris and initiate revascularization and repair of the tissue. Macrophages from peritumoral AT were typified as M2-like by expression of CD301 and CD163, which are scavenger receptors. However, further characterization revealed expression of NOS2 and arginase. The NOS2 pathway predominates in M1-polarized macrophages and competes with arginase for the same substrate, l-arginine. In M1-activated macrophages, l-arginine is metabolized to nitric oxide by NOS2. On the other hand, in M2 macrophages l-arginine is metabolized by arginase to urea and l-ornithine, precursors of polyamines and collagen involved in tissue remodeling. It has been shown that NOS2 expression precedes arginase expression at wound sites [61]. Early inflammatory responses are characterized by increased NOS2 expression where nitrogen intermediates are involved in microbial killing, vasodilation, and inhibition (or reversal) of platelet aggregation [60]. Expression of both NOS2 and arginase in macrophages from peritumoral AT might be indicative of a non-resolving wounding process, which is a common feature of cancer [2].
Angiogenesis is prominent in sites of inflammation, wounding and malignancy. Several studies have suggested an important role for IL-6 in this process. Aoki et al. showed accelerated growth of highly vascularized tumors when IL-6-expressing NIH3T3 cells were injected into BALB/c nu/nu mice [62]. We found a 6-fold increase in IL-6 levels in peritumoral AT compared to control AT. By immunohistochemistry, both mononuclear and endothelial cells were strongly positive for IL-6. This finding together with the increased vasculature in peritumoral AT suggests that IL-6 might be a stimulator of angiogenesis in our model. Murine sarcoma MCG101 growth and leukocyte infiltration were reduced in IL-6 gene knockout mice and after administration of IL-6 blocking antibodies to tumor-bearing mice [63]. Increased IL-6 expression was shown during angiogenesis accompanying folicullogenesis and formation of the maternal decidua after embryo implantation [64]. Lin et al. demonstrated that the absence of IL-6 interfered with angiogenesis at wound sites after skin incisions [65]. Furthermore, Hernandez-Rodriguez et al. showed that IL-6 stimulates endothelial cell proliferation and differentiation into capillary-like structures in vitro as well as full angiogenic activity in both the aortic ring (ex vivo) and chick chorioallantoic membrane (in vivo) assays [66].
It is well known that tumors require the establishment of blood vessels to progress beyond a few millimeters in diameter [66-69]. Initially it was believed that malignant tumor cells were the primary source of angiogenic factors. However, it has recently been recognized that stromal cells in tumors are also a major source for these factors. Tumor-associated pro-inflammatory cells, in particular neutrophils and macrophages, secrete VEGF, IL-6, IL-8 and TNF-α. Our results suggest that peritumoral AT, by serving as a depot for macrophages, forms a supportive microenvironment for tumor progression. Furthermore, peritumoral AT is inflamed and highly angiogenic, which could provide a source of new blood vessels as tumors expand at their periphery. The possibility to modulate recruitment and/or reorientate macrophage polarization could theoretically slow or reverse tumor progression, especially in tumors growing directly within AT including lymph node metastases and breast cancers.
Acknowledgments
ACD is supported by a K99/ROO award (CA140708) from the National Cancer Institute and National Institutes of Health.
Footnotes
Conflict of interest None.
Contributor Information
Marek Wagner, Department of Biomedicine, University of Bergen, Bergen, Norway.
Rolf Bjerkvig, Department of Biomedicine, University of Bergen, Bergen, Norway; Centre de Recherché Public de la Santé, Luxembourg, Luxembourg.
Helge Wiig, Department of Biomedicine, University of Bergen, Bergen, Norway.
Juan M. Melero-Martin, Department of Cardiac Surgery, Children’s Hospital Boston and Harvard Medical School, Boston, MA, USA
Ruei-Zeng Lin, Department of Cardiac Surgery, Children’s Hospital Boston and Harvard Medical School, Boston, MA, USA.
Michael Klagsbrun, Vascular Biology Program, Children’s Hospital Boston and Harvard Medical School, Boston, MA, USA; Department of Surgery, Children’s Hospital Boston and Harvard Medical School, Boston, MA, USA.
Andrew C. Dudley, Email: acdudley@med.unc.edu, Department of Cell and Molecular Physiology, Lineberger Comprehensive Cancer Center and McAllister Heart Institute, University of North Carolina at Chapel Hill, 8340 Medical Biomolecular Research Bldg., Chapel Hill, NC 27599, USA.
References
- 1.Mueller MM, Fusenig NE. Friends or foes—bipolar effects of the tumour stroma in cancer. Nat Rev Cancer. 2004;4:839–849. doi: 10.1038/nrc1477. [DOI] [PubMed] [Google Scholar]
- 2.Schafer M, Werner S. Cancer as an overhealing wound: an old hypothesis revisited. Nat Rev Mol Cell Biol. 2008;9:628–638. doi: 10.1038/nrm2455. [DOI] [PubMed] [Google Scholar]
- 3.Balkwill F, Charles KA, Mantovani A. Smoldering and polarized inflammation in the initiation and promotion of malignant disease. Cancer Cell. 2005;7:211–217. doi: 10.1016/j.ccr.2005.02.013. [DOI] [PubMed] [Google Scholar]
- 4.McAllister SS, Weinberg RA. Tumor-host interactions: a far-reaching relationship. J Clin Oncol. 2010;28:4022–4028. doi: 10.1200/JCO.2010.28.4257. [DOI] [PubMed] [Google Scholar]
- 5.Mantovani A, Sozzani S, Locati M, Allavena P, Sica A. Macrophage polarization: tumor-associated macrophages as a paradigm for polarized M2 mononuclear phagocytes. Trends Immunol. 2002;23:549–555. doi: 10.1016/s1471-4906(02)02302-5. [DOI] [PubMed] [Google Scholar]
- 6.Lewis CE, Pollard JW. Distinct role of macrophages in different tumor microenvironments. Cancer Res. 2006;66:605–612. doi: 10.1158/0008-5472.CAN-05-4005. [DOI] [PubMed] [Google Scholar]
- 7.Nucera S, Biziato D, De Palma M. The interplay between macrophages and angiogenesis in development, tissue injury and regeneration. Int J Dev Biol. 2011;55:495–503. doi: 10.1387/ijdb.103227sn. [DOI] [PubMed] [Google Scholar]
- 8.Murdoch C, Giannoudis A, Lewis CE. Mechanisms regulating the recruitment of macrophages into hypoxic areas of tumors and other ischemic tissues. Blood. 2004;104:2224–2234. doi: 10.1182/blood-2004-03-1109. [DOI] [PubMed] [Google Scholar]
- 9.Guleng B, Tateishi K, Ohta M, Kanai F, Jazag A, Ijichi H, Tanaka Y, Washida M, Morikane K, Fukushima Y, Yamori T, Tsuruo T, Kawabe T, Miyagishi M, Taira K, Sata M, Omata M. Blockade of the stromal cell-derived factor-1/CXCR4 axis attenuates in vivo tumor growth by inhibiting angiogenesis in a vascular endothelial growth factor-independent manner. Cancer Res. 2005;65:5864–5871. doi: 10.1158/0008-5472.CAN-04-3833. [DOI] [PubMed] [Google Scholar]
- 10.Murdoch C, Muthana M, Coffelt SB, Lewis CE. The role of myeloid cells in the promotion of tumour angiogenesis. Nat Rev Cancer. 2008;8:618–631. doi: 10.1038/nrc2444. [DOI] [PubMed] [Google Scholar]
- 11.Murdoch C, Muthana M, Lewis CE. Hypoxia regulates macrophage functions in inflammation. J Immunol. 2005;175:6257–6263. doi: 10.4049/jimmunol.175.10.6257. [DOI] [PubMed] [Google Scholar]
- 12.Grimshaw MJ, Balkwill FR. Inhibition of monocyte and macrophage chemotaxis by hypoxia and inflammation–a potential mechanism. Eur J Immunol. 2001;31:480–489. doi: 10.1002/1521-4141(200102)31:2<480::aid-immu480>3.0.co;2-l. [DOI] [PubMed] [Google Scholar]
- 13.Tan J, Buache E, Chenard MP, Dali-Youcef N, Rio MC. Adipocyte is a non-trivial, dynamic partner of breast cancer cells. Int J Dev Biol. 2011;55:851–859. doi: 10.1387/ijdb.113365jt. [DOI] [PubMed] [Google Scholar]
- 14.Dirat B, Bochet L, Dabek M, Daviaud D, Dauvillier S, Majed B, Wang YY, Meulle A, Salles B, Le Gonidec S, Garrido I, Escourrou G, Valet P, Muller C. Cancer-associated adipocytes exhibit an activated phenotype and contribute to breast cancer invasion. Cancer Res. 2011;71:2455–2465. doi: 10.1158/0008-5472.CAN-10-3323. [DOI] [PubMed] [Google Scholar]
- 15.Mosser DM, Edwards JP. Exploring the full spectrum of macrophage activation. Nat Rev Immunol. 2008;8:958–969. doi: 10.1038/nri2448. [DOI] [PMC free article] [PubMed] [Google Scholar]
- 16.Montovani A, Sica A, Sozzani S, Allavena P, Vecchi A, Locati M. The chemokine system in diverse forms of macrophage activation and polarization. Trends Immunol. 2004;25:677–686. doi: 10.1016/j.it.2004.09.015. [DOI] [PubMed] [Google Scholar]
- 17.Qian BZ, Pollard JW. Macrophage diversity enhances tumor progression and metastasis. Cell. 2010;141:39–51. doi: 10.1016/j.cell.2010.03.014. [DOI] [PMC free article] [PubMed] [Google Scholar]
- 18.Biswas SK, Sica A, Lewis CE. Plasticity of macrophage function during tumor progression: regulation by distinct molecular mechanisms. J Immunol. 2008;180:2011–2017. doi: 10.4049/jimmunol.180.4.2011. [DOI] [PubMed] [Google Scholar]
- 19.Kusmartsev S, Gabrilovich DI. STAT1 signaling regulates tumor-associated macrophage-mediated T cell deletion. J Immunol. 2005;174:4880–4891. doi: 10.4049/jimmunol.174.8.4880. [DOI] [PubMed] [Google Scholar]
- 20.Tsai CS, Chen FH, Wang CC, Huang HL, Jung SM, Wu CJ, Lee CC, McBride WH, Chiang CS, Hong JH. Macrophages from irradiated tumors express higher levels of iNOS, arginase-I and COX-2, and promote tumor growth. Int J Radiat Oncol Biol Phys. 2007;68:499–507. doi: 10.1016/j.ijrobp.2007.01.041. [DOI] [PubMed] [Google Scholar]
- 21.Hursting SD, Nunez NP, Varticovski L, Vinson C. The obesity-cancer link: lessons learned from a fatless mouse. Cancer Res. 2007;67:2391–2393. doi: 10.1158/0008-5472.CAN-06-4237. [DOI] [PubMed] [Google Scholar]
- 22.Vona-Davis L, Rose DP. Adipokines as endocrine, paracrine, and autocrine factors in breast cancer risk and progression. Endocr Relat Cancer. 2007;14:189–206. doi: 10.1677/ERC-06-0068. [DOI] [PubMed] [Google Scholar]
- 23.Lumeng CN, Bodzin JL, Saltiel AR. Obesity induces a phenotypic switch in adipose tissue macrophage polarization. J Clin Invest. 2007;117:175–184. doi: 10.1172/JCI29881. [DOI] [PMC free article] [PubMed] [Google Scholar]
- 24.Weisberg SP, McCann D, Desai M, Rosenbaum M, Leibel RL, Ferrante AW., Jr Obesity is associated with macrophage accumulation in adipose tissue. J Clin Invest. 2003;112:1796–1808. doi: 10.1172/JCI19246. [DOI] [PMC free article] [PubMed] [Google Scholar]
- 25.Red Eagle A, Chawla A. In obesity and weight loss, all roads lead to the mighty macrophage. J Clin Invest. 2010;120(10):3437–3440. doi: 10.1172/JCI44721. [DOI] [PMC free article] [PubMed] [Google Scholar]
- 26.Gordon S. Macrophage heterogeneity and tissue lipids. J Clin Invest. 2007;117:89–93. doi: 10.1172/JCI30992. [DOI] [PMC free article] [PubMed] [Google Scholar]
- 27.Janderová L, McNeil M, Murrell AN, Mynatt RL, Smith SR. Human mesenchymal stem cells as an in vitro model for human adipogenesis. Obes Res. 2003;11:65–74. doi: 10.1038/oby.2003.11. [DOI] [PubMed] [Google Scholar]
- 28.Xu H, Barnes GT, Yang Q, Tan G, Yang D, Chou CJ, Sole J, Nichols A, Ross JS, Tartaglia LA, Chen H. Chronic inflammation in fat plays a crucial role in the development of obesity-related insulin resistance. J Clin Invest. 2003;112:1821–1830. doi: 10.1172/JCI19451. [DOI] [PMC free article] [PubMed] [Google Scholar]
- 29.Cao Y. Adipose tissue angiogenesis as a therapeutic target for obesity and metabolic diseases. Nat Rev Drug Discov. 2010;9:107–115. doi: 10.1038/nrd3055. [DOI] [PubMed] [Google Scholar]
- 30.Gealekman O, Guseva N, Hartigan C, Apotheker S, Gorgoglione M, Gurav K, Tran KV, Straubhaar J, Nicoloro S, Czech MP, Thompson M, Perugini RA, Corvera S. Depot-specific differences and insufficient subcutaneous adipose tissue angiogenesis in human obesity. Circulation. 2011;123:186–194. doi: 10.1161/CIRCULATIONAHA.110.970145. [DOI] [PMC free article] [PubMed] [Google Scholar]
- 31.Bissell MJ, Hines WC. Why don’t we get more cancer? A proposed role of the microenvironment in restraining cancer progression. Nat Med. 2011;17:320–329. doi: 10.1038/nm.2328. [DOI] [PMC free article] [PubMed] [Google Scholar]
- 32.Bergers G, Benjamin LE. Tumorigenesis and the angiogenic switch. Nat Rev Cancer. 2003;3:401–410. doi: 10.1038/nrc1093. [DOI] [PubMed] [Google Scholar]
- 33.Hanahan D, Weinberg RA. The hallmarks of cancer. Cell. 2000;100:57–70. doi: 10.1016/s0092-8674(00)81683-9. [DOI] [PubMed] [Google Scholar]
- 34.Gimbrone MA, Jr, Leapman SB, Cotran RS, Folkman J. Tumor dormancy in vivo by prevention of neovascularization. J Exp Med. 1972;136:261–276. doi: 10.1084/jem.136.2.261. [DOI] [PMC free article] [PubMed] [Google Scholar]
- 35.Folkman J, Cole P, Zimmerman S. Tumor behavior in isolated perfused organs: in vitro growth and metastases of biopsy material in rabbit thyroid and canine intestinal segment. Ann Surg. 1966;164:491–502. doi: 10.1097/00000658-196609000-00012. [DOI] [PMC free article] [PubMed] [Google Scholar]
- 36.Folkman J, Kalluri R. Cancer without disease. Nature. 2004;427:787. doi: 10.1038/427787a. [DOI] [PubMed] [Google Scholar]
- 37.Bhowmick NA, Neilson EG, Moses HL. Stromal fibroblasts in cancer initiation and progression. Nature. 2004;432:332–337. doi: 10.1038/nature03096. [DOI] [PMC free article] [PubMed] [Google Scholar]
- 38.Bissell MJ, Labarge MA. Context, tissue plasticity, and cancer: are tumor stem cells also regulated by the microenvironment? Cancer Cell. 2005;7:17–23. doi: 10.1016/j.ccr.2004.12.013. [DOI] [PMC free article] [PubMed] [Google Scholar]
- 39.Padera TP, Stoll BR, Tooredman JB, Capen D, di Tomaso E, Jain RK. Pathology: cancer cells compress intratumour vessels. Nature. 2004;427:695. doi: 10.1038/427695a. [DOI] [PubMed] [Google Scholar]
- 40.Boucher Y, Jain RK. Microvascular pressure is the principal driving force for interstitial hypertension in solid tumors: implications for vascular collapse. Cancer Res. 1992;52:5110–5114. [PubMed] [Google Scholar]
- 41.Nieman KM, Kenny HA, Penicka CV, Ladanyi A, Buell-Gutbrod R, Zillhardt MR, Romero IL, Carey MS, Mills GB, Hotamisligil GS, Yamada SD, Peter ME, Gwin K, Lengyel E. Adipocytes promote ovarian cancer metastasis and provide energy for rapid tumor growth. Nat Med. 2011;17:1498–1503. doi: 10.1038/nm.2492. [DOI] [PMC free article] [PubMed] [Google Scholar]
- 42.Andarawewa KL, Motrescu ER, Chenard MP, Gansmuller A, Stoll I, Tomasetto C, Rio MC. Stromelysin-3 is a potent negative regulator of adipogenesis participating to cancer cell-adipocyte interaction/crosstalk at the tumor invasive front. Cancer Res. 2005;65:10862–10871. doi: 10.1158/0008-5472.CAN-05-1231. [DOI] [PubMed] [Google Scholar]
- 43.Motrescu ER, Rio MC. Cancer cells, adipocytes and matrix metalloproteinase 11: a vicious tumor progression cycle. Biol Chem. 2008;389:1037–1041. doi: 10.1515/BC.2008.110. [DOI] [PubMed] [Google Scholar]
- 44.Zeisberg EM, Tarnavski O, Zeisberg M, Dorfman AL, McMullen JR, Gustafsson E, Chandraker A, Yuan X, Pu WT, Roberts AB, Neilson EG, Sayegh MH, Izumo S, Kalluri R. Endothelial-to-mesenchymal transition contributes to cardiac fibrosis. Nat Med. 2007;13:952–961. doi: 10.1038/nm1613. [DOI] [PubMed] [Google Scholar]
- 45.Rieder F, Kessler SP, West GA, Bhilocha S, de la Motte C, Sadler TM, Gopalan B, Stylianou E, Fiocchi C. Inflammation-induced endothelial-to-mesenchymal transition: a novel mechanism of intestinal fibrosis. Am J Pathol. 2011;179:2660–2673. doi: 10.1016/j.ajpath.2011.07.042. [DOI] [PMC free article] [PubMed] [Google Scholar]
- 46.Lee SB, Kalluri R. Mechanistic connection between inflammation and fibrosis. Kidney Int Suppl. 2010:S22–S6. doi: 10.1038/ki.2010.418. [DOI] [PMC free article] [PubMed] [Google Scholar]
- 47.Lebleu VS, Sugimoto H, Miller CA, Gattone VH, 2nd, Kalluri R. Lymphocytes are dispensable for glomerulonephritis but required for renal interstitial fibrosis in matrix defect-induced Alport renal disease. Lab Invest. 2008;88:284–292. doi: 10.1038/labinvest.3700715. [DOI] [PubMed] [Google Scholar]
- 48.Elkabets M, Gifford AM, Scheel C, Nilsson B, Reinhardt F, Bray MA, Carpenter AE, Jirström K, Magnusson K, Ebert BL, Pontén F, Weinberg RA, McAllister SS. Human tumors instigate granulin-expressing hematopoietic cells that promote malignancy by activating stromal fibroblasts in mice. J Clin Invest. 2011;121:784–799. doi: 10.1172/JCI43757. [DOI] [PMC free article] [PubMed] [Google Scholar]
- 49.Duffield JS, Forbes SJ, Constandinou CM, Clay S, Partolina M, Vuthoori S, Wu S, Lang R, Iredale JP. Selective depletion of macropahges reveals distinct, opposing roles during liver injury and repair. J Clin Invest. 2005;115:56–65. doi: 10.1172/JCI22675. [DOI] [PMC free article] [PubMed] [Google Scholar]
- 50.Martin P, Leibovich SJ. Inflammatory cells during wound repair: the goo, the bad and the ugly. Trends Cell Biol. 2005;15:599–607. doi: 10.1016/j.tcb.2005.09.002. [DOI] [PubMed] [Google Scholar]
- 51.Martin P, D’Souza D, Martin J, Grose R, Cooper L, Maki R, McKercher SR. Wound healing in the PU.1 null mouse-tissue repair is not dependent on inflammatory cells. Curr Biol. 2003;13:1122–1128. doi: 10.1016/s0960-9822(03)00396-8. [DOI] [PubMed] [Google Scholar]
- 52.Low QE, Drugea IA, Duffner LA, Quinn DG, Cook DN, Rollins BJ, Kovacs EJ, DiPietro LA. Wound healing in MIP-1alpha(−/−) and MCP-1(−/−) mice. Am J Pathol. 2001;159:457–463. doi: 10.1016/s0002-9440(10)61717-8. [DOI] [PMC free article] [PubMed] [Google Scholar]
- 53.Kessenbrock K, Plaks V, Werb Z. Matrix metalloproteinases: regulators of the tumor microenvironment. Cell. 2010;141:52–67. doi: 10.1016/j.cell.2010.03.015. [DOI] [PMC free article] [PubMed] [Google Scholar]
- 54.Kalluri R, Sukhatme VP. Fibrosis and angiogenesis. Curr Opin Nephrol Hypertens. 2000;9:413–418. doi: 10.1097/00041552-200007000-00013. [DOI] [PubMed] [Google Scholar]
- 55.Liu H, Chen B, Lilly B. Fibroblasts potentiate blood vessel formation partially through secreted factor TIMP-1. Angiogenesis. 2008;11:223–234. doi: 10.1007/s10456-008-9102-8. [DOI] [PubMed] [Google Scholar]
- 56.Hume DA. The mononuclear phagocyte system. Curr Opin Immunol. 2006;18:49–53. doi: 10.1016/j.coi.2005.11.008. [DOI] [PubMed] [Google Scholar]
- 57.Jenkins SJ, Ruckerl D, Cook PC, Jones LH, Finkelman FD, van Rooijen N, MacDonald AS, Allen JE. Local macrophage proliferation, rather than recruitment from the blood, is a signature of TH2 inflammation. Science. 2011;332:1284–1288. doi: 10.1126/science.1204351. [DOI] [PMC free article] [PubMed] [Google Scholar]
- 58.Tanimoto N, Terasawa M, Nakamura M, Kegai D, Aoshima N, Kobayashi Y, Nagata K. Involvement of KC, MIP-2, and MCP-1 in leukocyte infiltration following injection of necrotic cells into the peritoneal cavity. Biochem Biophys Res Commun. 2007;361:533–536. doi: 10.1016/j.bbrc.2007.07.060. [DOI] [PubMed] [Google Scholar]
- 59.Armstrong DA, Major JA, Chudyk A, Hamilton TA. Neutrophil chemoattractant genes KC and MIP-2 are expressed in different cell populations at sites of surgical injury. J Leukoc Biol. 2004;75:641–648. doi: 10.1189/jlb.0803370. [DOI] [PubMed] [Google Scholar]
- 60.Albina JE, Mills CD, Henry WL, Jr, Caldwell MD. Temporal expression of different pathways of 1-arginine metabolism in healing wounds. J Immunol. 1990;144:3877–3880. [PubMed] [Google Scholar]
- 61.Zunić G, Supić G, Magić Z, Drasković B, Vasiljevska M. Increased nitric oxide formation followed by increased arginase activity induces relative lack of arginine at the wound site and alters whole nutritional status in rats almost within the early healing period. Nitric Oxide. 2009;20:253–258. doi: 10.1016/j.niox.2009.01.005. [DOI] [PubMed] [Google Scholar]
- 62.Aoki Y, Jaffe ES, Chang Y, Jones K, Teruya-Feldstein J, Moore PS, Tosato G. Angiogenesis and hematopoiesis induced by Kaposi’s sarcoma-associated herpesvirus-encoded interleukin-6. Blood. 1999;93:4034–4043. [PubMed] [Google Scholar]
- 63.Cahlin C, Körner A, Axelsson H, Wang W, Lundholm K, Svanberg E. Experimental cancer cachexia: the role of host-derived cytokines interleukin (IL)-6, IL-12, interferon-gamma, and tumor necrosis factor alpha evaluated in gene knockout, tumor-bearing mice on C57 Bl background and eicosanoid-dependent cachexia. Cancer Res. 60:5488–5493. [PubMed] [Google Scholar]
- 64.Motro B, Itin A, Sachs L, Keshet E. Pattern of interleukin 6 gene expression in vivo suggests a role for this cytokine in angiogenesis. Proc Natl Acad Sci USA. 1990;87:3092–3096. doi: 10.1073/pnas.87.8.3092. [DOI] [PMC free article] [PubMed] [Google Scholar]
- 65.Lin ZQ, Kondo T, Ishida Y, Takayasu T, Mukaida N. Essential involvement of IL-6 in the skin wound-healing process as evidenced by delayed wound healing in IL-6-deficient mice. J Leukoc Biol. 2003;73:713–721. doi: 10.1189/jlb.0802397. [DOI] [PubMed] [Google Scholar]
- 66.Hernández-Rodríguez J, Segarra M, Vilardell C, Sánchez M, García-Martínez A, Esteban MJ, Grau JM, Urbano-Márquez A, Colomer D, Kleinman HK, Cid MC. Elevated production of interleukin-6 is associated with a lower incidence of disease-related ischemic events in patients with giant-cell arteritis: angiogenic activity of interleukin-6 as a potential protective mechanism. Circulation. 2003;107:2428–2434. doi: 10.1161/01.CIR.0000066907.83923.32. [DOI] [PubMed] [Google Scholar]
- 67.Condeelis J, Pollard JW. Macrophages: obligate partners for tumor cell migration, invasion, and metastasis. Cell. 2006;124:263–266. doi: 10.1016/j.cell.2006.01.007. [DOI] [PubMed] [Google Scholar]
- 68.Wyckoff JB, Wang Y, Lin EY, Li JF, Goswami S, Stanley ER, Segall JE, Pollard JW, Condeelis J. Direct visualization of macrophage-assisted tumor cell intravasation in mammary tumors. Cancer Res. 2007;67:2649–2656. doi: 10.1158/0008-5472.CAN-06-1823. [DOI] [PubMed] [Google Scholar]
- 69.Pollard JW. Macrophages define the invasive microenvironment in breast cancer. J Leukoc Biol. 2008;84:623–630. doi: 10.1189/jlb.1107762. [DOI] [PMC free article] [PubMed] [Google Scholar]