

Abstract
Daclizumab is a monoclonal antibody that reduces inflammation in multiple sclerosis (MS). Through a retrospective analysis, our objective was to determine whether daclizumab treatment reduces the rate of brain structure atrophy in comparison to a mixture of other disease-modifying therapies (mainly different interferon β preparations). We analyzed MRI examinations (1332 scans from 70 MS cases) obtained between 2000 and 2011 in a single center and processed with an automated brain segmentation method. We used mixed-effects multivariable linear regression models to determine whether a median of 4.3 years of daclizumab therapy in 26 patients altered rates of brain-volume change, controlling for variations in MRI protocol. The control group consisted of 44 patients not treated with daclizumab. We found that supratentorial brain volume declined by 5.17 ml per year (95% confidence limits: 3.58–6.77) off daclizumab therapy. On daclizumab, the annual rate of volume loss decreased to 3.72 ml (p=0.01). The rate of ventricular enlargement decreased from 1.26 to 0.42 ml per year (p<0.001). Focused analysis suggests that reduction in gray matter atrophy rate most likely underlies these results. In summary, in this retrospective analysis, daclizumab therapy substantially decreased the rate of brain atrophy in relapsing-remitting MS in comparison to other disease-modifying therapies, predominantly interferon β.
Keywords: Multiple sclerosis, Brain atrophy, Gray matter, Brain volume, Daclizumab, Interferon beta
1. Introduction
Neurodegeneration and axon damage have been proposed to be primary mechanisms of permanent disability in MS. Axon loss can be very prominent in the early stages of the disease and is at least partially independent of the number or volume of inflammatory lesions (De Stefano et al., 2001; Filippi et al., 2003; Kuhlmann et al., 2002). As axon damage causes loss of brain tissue, imaging-based measures of tissue atrophy are considered markers of disease progression and have been adopted as primary and secondary outcome measures in clinical trials (Barkhof et al., 2009; Filippi et al., 2004; Hardmeier et al., 2005; Kapoor et al., 2010; Molyneux et al., 2000; Rudick et al., 2000; Turner et al., 2003). In MS, atrophy is most prominent in gray matter structures and minimal in white matter (Pirko et al., 2007).
Daclizumab, a monoclonal antibody that blocks the CD25 molecule (α chain of the IL-2 receptor), has been tested in clinical trials for the treatment of active forms of relapsing-remitting and secondary-progressive MS since 1999. In clinical trials, adding daclizumab therapy to patients with suboptimal therapeutic response to interferon β reduced, by 70% to 86%, the number of new contrast-enhanced lesions (Bielekova et al., 2009; Rose et al., 2007; Rose et al., 2004; Wynn et al., 2010). Although the drug was initially designed to selectively inhibit activated T cells, its mechanism of action is complex, and its therapeutic efficacy most likely relates to unexpectedly broad effects on the innate immune system (Bielekova et al., 2006; Jiang et al., 2011; Wuest et al., 2011).
We reported previously that short-term daclizumab therapy does not reduce brain atrophy; in fact, in comparison to pretreatment baseline, we observed a decrease in normalized brain volume after either 9 (Bielekova et al., 2009) or 15.5 months (Bielekova et al., 2011) of daclizumab therapy. These results were thought to reflect “pseudoatrophy” –reduced brain volume related to reduction in inflammation-associated edema – because on a case-by-case basis the decrease in brain volume correlated with a decrease in the volume of contrast-enhanced lesions (Bielekova et al., 2011).
Much longer-term follow-up MRI data from daclizumab-treated patients in our center are now available; these data can now be aggregated with those obtained during the original studies. In addition, we have recently found that daclizumab may inhibit lymphoid tissue inducer (LTi) cells (Perry et al., 2012), which may reduce the formation of tertiary lymphoid follicles that appear to be associated with cortical subpial demyelinating lesions (Howell et al., 2011; Magliozzi et al., 2007). For these reasons, and as daclizumab is currently undergoing testing in Phase III trials, we undertook the present study to assess whether daclizumab changes the rate of brain atrophy relative to other disease-modifying therapies (DMT), which are themselves known to slow atrophy. To address this question, we measured the volumes of individual brain structures based on MRI scans in cases of relapsing-remitting MS that were followed for up to 11 years.
2. Material and methods
2.1. Participant and scan selection
We included 70 relapsing-remitting MS cases in this retrospective study (Table 1). All studies were IRB-approved and carried out in accordance with accepted ethical standards. In the context of two single-center trials (Bielekova et al., 2009, 2011; Bielekova and Martin, 2004), and following trial completion in an off-label fashion, patients in the daclizumab group (n=26) were treated with that drug for a median of 4.3 years, with or without adjunctive interferon β-1b therapy. Patients in the non-daclizumab group (n=44) were selected from our research database based on the availability of multiple MRI scans performed during the same time period (2000–2011) using similar data acquisition protocols (i.e., both 3D T1-weighted and T2-FLAIR scans were available). Treatment regimens varied across the non-daclizumab patients: 84% were taking a preparation of interferon β, 15% glatiramer acetate, and the remaining 1% other DMT (Fig. 1). No untreated patients were included in this analysis. Scans performed less than 30 days after intravenous steroid administration for relapses were not included.
Table 1.
Demographics.
| Daclizumab | Non-daclizumab | |
|---|---|---|
| Patients (n) | 26 | 44 |
| Sex (% females) | 58% | 68% |
| Age at baseline, years (median, range) | 35, 18–54 | 39, 19–58 |
| Disease duration at baseline, years (median, range) | 4, 0.1–15 | 8, 0.1–30 |
| EDSS at baseline (median, range) | 1.5, 0–5.5 | 1.5, 0–6.5 |
| Total time on daclizumab, years (median, range) | 4.3, 0.4–9.5 | N/A |
| Normalized brain volume (mean±SD) | 0.785±0.032 | 0.787±0.034 |
| Scans per patient (median, range) | 38, 5–55 | 14, 1–25 |
| Total duration of follow-up, years (median, range) | 6.7 (1.9–10.5) | 5.4 (1.0–9.4) |
Fig. 1.
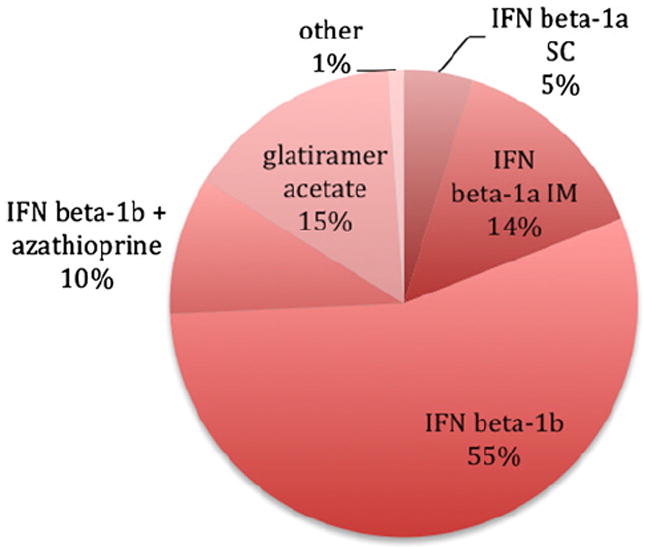
Distribution of non-daclizumab disease-modifying therapies: IFN, interferon; SC, subcutaneous; IM, intramuscular.
2.2. MRI acquisition
We analyzed 921 brain scans from daclizumab cases and 411 scans from non-daclizumab cases. Scans from the daclizumab cases were performed prior to, on, and in some cases following the discontinuation of, daclizumab. All scans were obtained on a single 1.5T scanner (GE Medical Systems, Milwaukee, WI). During this period, and across the clinical protocols under which data were acquired, there were numerous changes in the scanning protocols related to upgrades in scanner software and hardware. The latter include the adoption of multi-channel brain coils and more powerful scanners. The slice thickness also varied. Scanning parameters for the T1-weighted protocols, and for the most common T2-FLAIR protocols, are provided in Table 2.
Table 2.
Range of scanning parameters for T1 and most common T2-FLAIR protocols.
| Weighting | Sequence | # Scans | Field strength (T) | Coil | Slice thickness (mm) | Nominal in-plane resolution (mm) | TR (ms) | TE (ms) | TI (ms) | Flip angle (deg.) |
|---|---|---|---|---|---|---|---|---|---|---|
| T1 | 3D SPGR | 188 | 1.5 | Volume | 1.3 | 0.9 × 0.9 | ~9 | ~2 | none | 20 |
| 3D SPGR | 996 | 1.5 | Volume | 1.4 | 0.9 × 0.9 | ~9 | ~2 | none | 20 | |
| 3D SPGR | 38 | 1.5 | 8-Channel | 1.4 | 0.9 × 0.9 | ~10 | ~3 | none | 20 | |
| 3D SPGR | 110 | 1.5 | 8-Channel | 1.5 | 0.8 × 0.8 | ~9 | ~3.5 | 450 | 13 | |
| T2-FLAIR | 2D IR-SE | 1168 | 1.5 | Volume | 3 | 1.3 × 0.9 | ~10000 | ~145 | 2200 | 90 |
| 2D IR-SE | 37 | 1.5 | 8-Channel | 3 | 1.3 × 0.9 | ~10000 | ~125 | 2200 | 90 | |
| 2D IR-SE | 110 | 1.5 | 8-Channel | 3 | 1.3 × 0.9 | ~10000 | ~125 | 2250 | 90 |
Abbreviations. TR, repetition time; TE, echo time; TI, inversion time; FLAIR, fluid-attenuated inversion recovery; SPGR, spoiled gradient echo; IR-SE, inversion recovery-spin echo.
2.3. Image analysis
Images were examined by a radiologist (ITB) for the presence of artifacts, usually from subject motion, that would interfere with automated segmentation. Brain volumes were automatically derived with Lesion-TOADS (http://nitrc.org/projects/toads-cruise) (Shiee et al., 2010). This method uses intensity information from input images and brain atlases to accomplish detailed segmentation of normal brain structures (cerebral white and gray matter, ventricles, and subcortical structures) and lesions (Fig. 2). Analyzed images were examined for gross segmentation errors, and failed cases were discarded from the analysis.
Fig. 2.
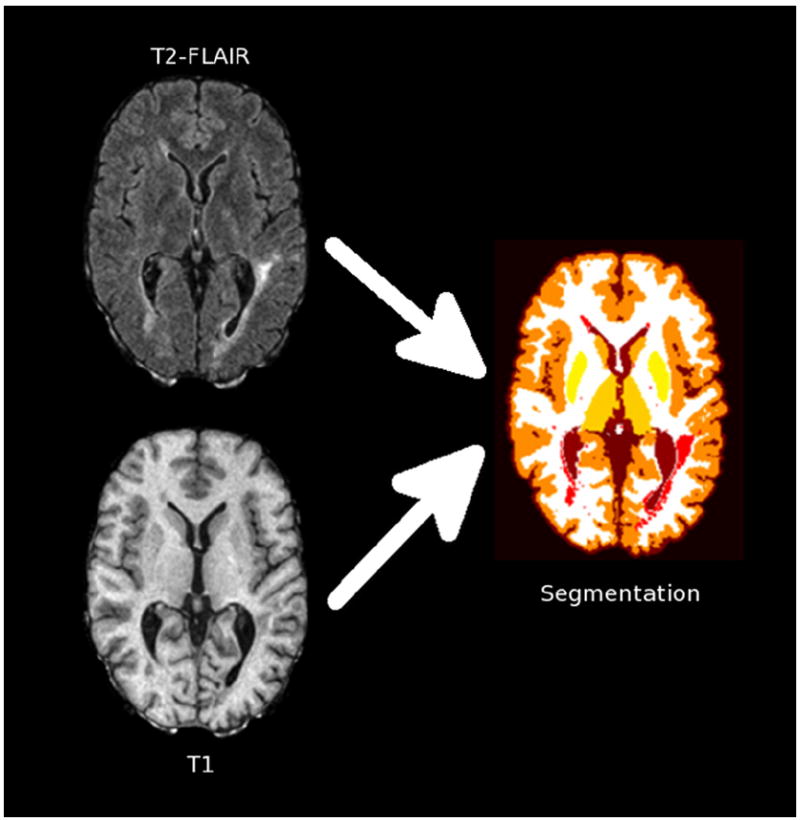
Schematic depiction of the segmentation process, which uses T2-FLAIR and T1-weighted images to derive tissue segmentation including lesions (red), cerebral white matter (white), cerebral cortex (dark orange), caudate (light orange), putamen (light yellow), thalamus (dark yellow), and ventricles (brown). (For interpretation of the references to color in this figure legend, the reader is referred to the web version of this article.)
2.4. Statistical analysis
We tested whether daclizumab therapy altered rates of brain-volume change. In order to investigate this hypothesis, we used a statistical model to account for changes in brain structure volumes
In this multivariable mixed-effects linear regression model, which was applied separately to each brain structure, the volume for patient i at time point j (Volij) was determined by fixed effects (β0, …, β4) and patient-specific “random”) effects (b0,I and b1,i). Sex and MRI protocol were modeled as indicator variables, whereas ageij and time on daclizumab (tDAC,ij)+, measured in days, were continuous. The premise of this model is that brain volume declines approximately linearly with age (Hasan et al., 2010). After fitting, the average background rate of decline, which is derived from patients in both groups, is β1; patient-specific variation is captured in the random slope, b1,i. After 90 days of therapy, the addition of daclizumab is postulated to change the average rate of decline by an amount equal to β2. (We also performed a similar analysis with other delay times.) For simplicity, the model does not consider differential responses to daclizumab therapy across patients. Analysis was performed with STATA version 9.2 (StataCorp LP, College Station, TX). In general, we took p=0.05 as the threshold for statistical significance, without adjustment for multiple testing.
3. Results
There were no significant differences in sex, baseline disease duration, baseline EDSS, baseline brain volume (normalized to skull size), or baseline rates of brain atrophy, between the daclizumab and non-daclizumab groups (p>0.05 in all cases). The median baseline age in the non-daclizumab group was 4 years older than in the daclizumab group (p=0.02, Wilcoxon rank-sum test). There were many more scans per patient in the daclizumab group (median: 38 vs. 14), as well as a longer total duration of follow-up (median: 6.7 vs. 5.4), reflecting the intensity of monitoring during and after the clinical trials under which they received the drug.
The results of the model-fitting procedure are shown in Fig. 3A for supratentorial brain volume, which includes cortex, deep gray matter, extralesional white matter, and white matter lesions. Background supratentorial brain volume declined by 5.17 ml per year (95% confidence limits: 3.58–6.77); on daclizumab, the annual rate of volume loss slowed to 3.72 ml (p=0.01) (Table 3). Specific decreases in atrophy rate in the daclizumab group were also noted in the thalamus and caudate nucleus, and a trend toward decreased atrophy was observed in the cerebral cortex. There was no evidence of background atrophy or daclizumab-related volume changes in cerebral white matter, which includes both lesions and so-called normal-appearing white matter. In the putamen, the model fit found increased atrophy in the daclizumab group, but the background rate of putamen atrophy was only 0.006 ml per year.
Fig. 3.
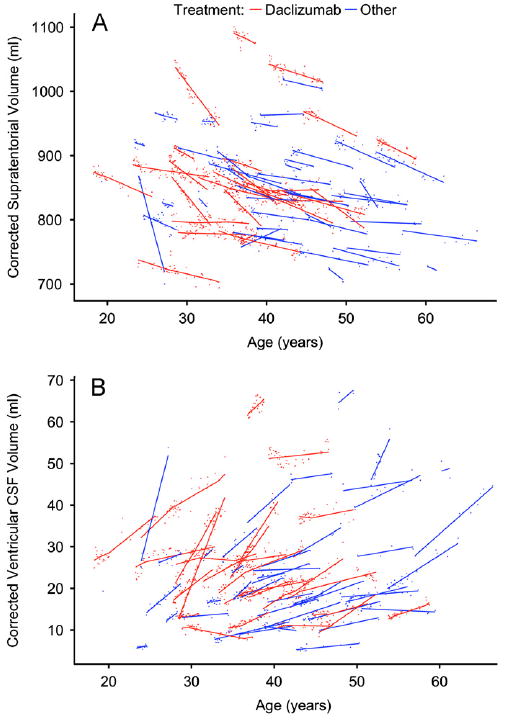
Supratentorial brain volume (A, small points) and ventricular volume (B, small points), with corresponding model fits (solid lines), for each participant. In both, a change in slope can be seen in the daclizumab cases (red points and lines), beginning 90 days after initiation of therapy and ending 90 days after cessation. Data points are corrected for differences relating to acquisition protocols, as described in Section 2.
Table 3.
Yearly change in brain structure volumes.
| Brain structure | Background
|
Daclizumab
|
||||
|---|---|---|---|---|---|---|
| Volume in mla | Rate in ml(%)a | p-value | Rate in ml(%) | Δ in ml | p-valueb | |
| Supratentorial (total) | 885 | −5.17 (−0.58) | <0.001 | −3.72 (−0.42) | 1.46 | 0.01 |
| Cerebral cortex | 408 | −4.88 (−1.20) | <0.001 | −4.05 (−0.99) | 0.83 | 0.09 |
| Cerebral white matterc | 454 | 0.59 (0.13) | 0.1 | 0.31 (0.07) | −0.28 | 0.6 |
| Thalamus | 12 | −0.21 (−1.84) | <0.001 | −0.13 (−1.16) | 0.08 | 0.002 |
| Putamen | 9 | −0.006 (−0.06) | 0.4 | −0.05 (−0.58) | −0.04 | <0.001 |
| Caudate | 5 | −0.14 (−2.84) | <0.001 | −0.07 (−1.47) | 0.07 | 0.03 |
| Ventricles | 28 | 1.26 (4.50) | <0.001 | 0.42 (1.49) | −0.84 | <0.001 |
Volumes and percentages are derived from model fits to a typical 40-year-old man.
The p-values in the right column refer to the change in rate attributable to daclizumab.
Cerebral white matter includes lesions and normal-appearing white matter.
Fig. 3B shows the results of the model fitting procedure for the ventricles. The background rate of ventricular enlargement was 1.26 ml per year (4.50% in a typical 40-year-old man). This decreased significantly to 0.42 ml per year (1.49%; p<0.001) in daclizumab-treated patients and represented the largest percentage change of any structure that we examined.
By varying the parameter in the model that controls the delay between initiation of daclizumab therapy and the onset of a treatment effect, we investigated the point at which the brain atrophy rate begins to slow. For supratentorial brain volume, the earliest evidence of a treatment effect occurred at a delay of 60 days (p=0.05), with larger effects at 90 days (p=0.01) and 120 days (p=0.003).
4. Discussion
Our aim was to evaluate whether daclizumab substantially reduces the rate of brain atrophy in relapsing-remitting MS relative to other DMT. Daclizumab’s strong ability to inhibit the formation of new white matter lesions in MS has been effectively demonstrated in Phase II trials, and a form of the drug is now undergoing definitive Phase III trials. Although it is a retrospective analysis, the present study is the first to show a substantial reduction in brain atrophy rate related to daclizumab therapy.
We analyzed data from a cohort of 70 patients with a large number (1332) of MRI scans who were seen at our center over an 11-year period (average: 19 scans per patient). These patients were seen in a variety of clinical trials and natural history studies, and analysis was pooled across these studies. Despite the fact that the data were not prospectively acquired for the analysis described here, the study groups were relatively well matched, including for baseline brain atrophy rate. Our primary finding is that in daclizumab-treated patients, there was a significantly smaller atrophy rate in the supratentorial brain, which includes cerebral cortex, deep gray matter, extralesional white matter, and white matter lesions. This translates into a meaningful difference of nearly 1.5 ml less brain volume loss per year, compared with about 5 ml brain volume loss per year in patients treated with other DMT.
A recent meta-analysis demonstrated that brain volume loss occurs at a rate of ~0.5% per year in untreated MS (De Stefano et al., 2010), compared to 0.1–0.3% per year in normal controls (Chard et al., 2002; Coffey et al., 1992; Pfefferbaum et al., 1994); our background data (see Table 3) replicate these findings. Brain atrophy in MS occurs throughout the course of the disease, even in its early stages (Chard et al., 2002; Zivadinov et al., 2001), as demonstrated in studies of patients with clinically isolated syndromes suggestive of MS. On MRI, this is manifested as loss of brain tissue as well as increasing ventricular size (Dalton et al., 2006), and our results confirmed, not surprisingly, that these two processes occur in parallel.
Studies have repeatedly demonstrated that deep gray matter volume loss, particularly in the thalamus and caudate nucleus but also in the cortex, occurs from the earliest stages of MS (Bendfeldt et al., 2012b; Hasan et al., 2009; Mesaros et al., 2011; Neema et al., 2009; Tao et al., 2009; Wylezinska et al., 2003). Some studies indicate that conventional DMT, including interferon, reduce the rate of brain atrophy (Filippi et al., 2004; Khan et al., 2012) and, in particular, gray matter atrophy (Nakamura et al., 2010; Zivadinov et al., 2007). In our study, the protective effect of daclizumab on gray matter was evident through significant reductions in atrophy rate in the thalamus and caudate nucleus, and through a trend toward a significant reduction in cerebral cortical atrophy. (The paradoxical increase in putamen atrophy in daclizumab-treated patients may be a statistical fluctuation, and given the low background rate of putamen atrophy of 0.006 ml per year, it is probably not important.) On the other hand, we found no evidence for white matter atrophy in our study population, consistent with other studies in relapsing-remitting MS (Pirko et al., 2007).
There are many mechanisms by which anti-inflammatory therapies can protect against loss of brain tissue over the long term, following the initially high rate of brain volume loss (pseudoatrophy) that was observed in the early daclizumab trials and that can be attributed to reduced inflammation (Zivadinov et al., 2008). If, as we and others have observed (Shiee et al., 2012), most brain atrophy occurs in gray matter to begin with, then it makes sense that DMT-related reductions in brain atrophy would be most strongly manifested in the gray matter. Specific possible mechanisms include direct inhibition of tissue destruction within lesions as well as indirect effects, such as creating a milieu where remyelination and tissue repair can occur.
In the case of daclizumab, a potential mechanism for decreased atrophy in structures that are directly apposed to the meninges – including the cerebral cortex – is inhibition of lymphoid tissue inducer (LTi) cells (Perry et al., 2012). These cells have been linked to the formation of ectopic lymphoid follicles (Bouskra et al., 2008; Schmutz et al., 2009) that have been observed in the meninges in MS and that may be linked with destruction of underlying tissue (Howell et al., 2011; Magliozzi et al., 2007, 2010). Unfortunately, lymphoid follicles cannot currently be visualized in vivo, so the results of our study are consistent with, but do not provide direct evidence for, this hypothesis.
The finding that the daclizumab-induced change in cerebral cortical atrophy rate did not meet the significance threshold of p=0.05 probably reflects inconsistent segmentations of white and gray matter across the heterogeneous scans that were aggregated in this study. Moreover, most of the volumetric data were obtained using an older, non-inversion-prepared T1-weighted sequence performed with a volume head coil on a 1.5 T MRI system, which yields inferior gray–white matter contrast compared to contemporary image acquisition methods. It is also the case that although simple, regression-based, additive adjustments for differences in MRI acquisition protocols were generally statistically significant, for these data, at least, more sophisticated adjustments may be necessary, particularly when assessing volumes of individual brain structures. Recent reports suggest that this may be possible to accomplish (Bendfeldt et al., 2012a).
Our conclusions about daclizumab’s effects on brain atrophy rate are based on multivariable, mixed-effects linear regression modeling that accounts for covariates including age, sex, and MRI protocol (the last two modeled as indicator variables). This model assumes linear changes in brain volume, which is reasonable in the age range of participants in this study (Hasan et al., 2010), and yields participant-specific atrophy rates. It also assumes that the effect of daclizumab is delayed by approximately 3 months (90 days) following treatment initiation, and that the atrophy rate returns to pre-daclizumab values 3 months following treatment cessation. The results of our analysis suggest that the onset of daclizumab’s effect on brain atrophy is likely to occur within the first 2 to 3 months after treatment initiation, but the model framework and structure of our data, with variable lengths of follow-up across the population, preclude a direct investigation of the exact timing of the effect.
A major advantage of the type of modeling performed here is that it allows individuals to contribute data prior to, during, and following daclizumab therapy. Although there are numerous potential sources of variance that we did not account for in our modeling, the results (see Fig. 3) suggest that the fits were reasonable. Nevertheless, the study has certain limitations, principal among which is that it retrospectively amalgamates data from a variety of clinical protocols that ran over slightly more than a decade at our center, rather than being a prospective trial with matched cohorts. We used historical controls originally recruited for other purposes. For prospective validation of our results, the ongoing DECIDE trial (Efficacy and Safety of Daclizumab High Yield Process Versus Interferon β-1a in Patients With Relapsing-Remitting Multiple Sclerosis; http://clinicaltrials.gov identifier NCT01064401), which includes 1800 patients and is scheduled to be completed in March 2014, should yield adequate data. An additional limitation is that we did not separately evaluate changes in lesion burden over time. Our segmentation method (Shiee et al., 2010) identifies and localizes white matter lesions, and it correctly distinguishes lesions from gray matter, a common and important problem with automated and semi-automated segmentation tools that can mar the assessment of brain volumes (Battaglini et al., 2012; Chard et al., 2010; Gelineau-Morel et al., 2012 Sdika and Pelletier, 2009). However, this method has not yet been evaluated in the context of a longitudinal study, and manual segmentation of lesions in the 1332 scans we included was not within the scope of our study.
5. Conclusions
Our study provides initial, retrospective evidence that daclizumab, a promising therapy that is currently in Phase III clinical trials, reduces the rate of brain atrophy in MS relative to conventional DMT.
Acknowledgments
We thank Joseph Frank, Nancy Richert, the Neuroimmunology Branch clinical team, and the NIH NMR Center technologists, who were instrumental in helping to acquire the data but were not directly involved in the data analysis for, or preparation of, this paper. We thank Irene Cortese and members of the NINDS Translational Neuroradiology Unit for critical comments on the manuscript, and Russell Shinohara for consultation on the statistics. The Intramural Research Program of the National Institute of Neurological Disorders and Stroke supported the research. No industry support was used.
Abbreviations
- DAC-HYP
daclizumab high-yield process
- DMT
disease-modifying therapy
- EDSS
expanded disability status scale
- FLAIR
fluid-attenuated inversion recovery
- TOADS
topology-preserving anatomy-driven segmentation
Footnotes
Conflicts of interest
Henry McFarland and Bibiana Bielekova receive royalties as inventors on several NIH patents related to the use of daclizumab in MS. No other author reports conflicts of interest.
References
- Barkhof F, Calabresi PA, Miller DH, Reingold SC. Imaging outcomes for neuroprotection and repair in multiple sclerosis trials. Nature Reviews Neurology. 2009;5:256–66. doi: 10.1038/nrneurol.2009.41. [DOI] [PubMed] [Google Scholar]
- Battaglini M, Jenkinson M, De Stefano N. Evaluating and reducing the impact of white matter lesions on brain volume measurements. Human Brain Mapping. 2012;33(9):2062–71. doi: 10.1002/hbm.21344. [DOI] [PMC free article] [PubMed] [Google Scholar]
- Bendfeldt K, Hofstetter L, Kuster P, Traud S, Mueller-Lenke N, Naegelin Y, et al. Longitudinal gray matter changes in multiple sclerosis-differential scanner and overall disease-related effects. Human Brain Mapping. 2012a;33:1225–45. doi: 10.1002/hbm.21279. [DOI] [PMC free article] [PubMed] [Google Scholar]
- Bendfeldt K, Kloppel S, Nichols TE, Smieskova R, Kuster P, Traud S, et al. Multivariate pattern classification of gray matter pathology in multiple sclerosis. NeuroImage. 2012b;60:400–8. doi: 10.1016/j.neuroimage.2011.12.070. [DOI] [PubMed] [Google Scholar]
- Bielekova B, Catalfamo M, Reichert-Scrivner S, Packer A, Cerna M, Waldmann TA, et al. Regulatory CD56(bright) natural killer cells mediate immunomodulatory effects of IL-2Ralpha-targeted therapy (daclizumab) in multiple sclerosis. Proceedings of the National Academy of Sciences of the United States of America. 2006;103:5941–6. doi: 10.1073/pnas.0601335103. [DOI] [PMC free article] [PubMed] [Google Scholar]
- Bielekova B, Howard T, Packer AN, Richert N, Blevins G, Ohayon J, et al. Effect of anti-CD25 antibody daclizumab in the inhibition of inflammation and stabilization of disease progression in multiple sclerosis. Archives of Neurology. 2009;66:483–9. doi: 10.1001/archneurol.2009.50. [DOI] [PMC free article] [PubMed] [Google Scholar]
- Bielekova B, Martin R. Development of biomarkers in multiple sclerosis. Brain. 2004;127:1463–78. doi: 10.1093/brain/awh176. [DOI] [PubMed] [Google Scholar]
- Bielekova B, Richert N, Herman ML, Ohayon J, Waldmann TA, McFarland H, et al. Intrathecal effects of daclizumab treatment of multiple sclerosis. Neurology. 2011;77:1877–86. doi: 10.1212/WNL.0b013e318239f7ef. [DOI] [PMC free article] [PubMed] [Google Scholar]
- Bouskra D, Brezillon C, Berard M, Werts C, Varona R, Boneca IG, et al. Lymphoid tissue genesis induced by commensals through NOD1 regulates intestinal homeostasis. Nature. 2008;456:507–10. doi: 10.1038/nature07450. [DOI] [PubMed] [Google Scholar]
- Chard DT, Griffin CM, Parker GJ, Kapoor R, Thompson AJ, Miller DH. Brain atrophy in clinically early relapsing-remitting multiple sclerosis. Brain. 2002;125:327–37. doi: 10.1093/brain/awf025. [DOI] [PubMed] [Google Scholar]
- Chard DT, Jackson JS, Miller DH, Wheeler-Kingshott CA. Reducing the impact of White matter lesions on automated measures of brain gray and white matter volumes. Journal of Magnetic Resonance Imaging. 2010;32:223–8. doi: 10.1002/jmri.22214. [DOI] [PubMed] [Google Scholar]
- Coffey CE, Wilkinson WE, Parashos IA, Soady SA, Sullivan RJ, Patterson LJ, et al. Quantitative cerebral anatomy of the aging human brain: a cross-sectional study using magnetic resonance imaging. Neurology. 1992;42:527–36. doi: 10.1212/wnl.42.3.527. [DOI] [PubMed] [Google Scholar]
- Dalton CM, Miszkiel KA, O’Connor PW, Plant GT, Rice GP, Miller DH. Ventricular enlargement in MS: one-year change at various stages of disease. Neurology. 2006;66:693–8. doi: 10.1212/01.wnl.0000201183.87175.9f. [DOI] [PubMed] [Google Scholar]
- De Stefano N, Giorgio A, Battaglini M, Rovaris M, Sormani MP, Barkhof F, et al. Assessing brain atrophy rates in a large population of untreated multiple sclerosis subtypes. Neurology. 2010;74:1868–76. doi: 10.1212/WNL.0b013e3181e24136. [DOI] [PubMed] [Google Scholar]
- De Stefano N, Narayanan S, Francis GS, Arnaoutelis R, Tartaglia MC, Antel JP, et al. Evidence of axonal damage in the early stages of multiple sclerosis and its relevance to disability. Archives of Neurology. 2001;58:65–70. doi: 10.1001/archneur.58.1.65. [DOI] [PubMed] [Google Scholar]
- Filippi M, Bozzali M, Rovaris M, Gonen O, Kesavadas C, Ghezzi A, et al. Evidence for widespread axonal damage at the earliest clinical stage of multiple sclerosis. Brain. 2003;126:433–7. doi: 10.1093/brain/awg038. [DOI] [PubMed] [Google Scholar]
- Filippi M, Rovaris M, Inglese M, Barkhof F, De Stefano N, Smith S, et al. Interferon beta-1a for brain tissue loss in patients at presentation with syndromes suggestive of multiple sclerosis: a randomised, double-blind, placebo-controlled trial. Lancet. 2004;364:1489–96. doi: 10.1016/S0140-6736(04)17271-1. [DOI] [PubMed] [Google Scholar]
- Gelineau-Morel R, Tomassini V, Jenkinson M, Johansen-Berg H, Matthews PM, Palace J. The effect of hypointense white matter lesions on automated gray matter segmentation in multiple sclerosis. Human Brain Mapping. doi: 10.1002/hbm.21402. http://dx.doi.org/10.1002/hbm.21402, in press. [DOI] [PMC free article] [PubMed]
- Hardmeier M, Wagenpfeil S, Freitag P, Fisher E, Rudick RA, Kooijmans M, et al. Rate of brain atrophy in relapsing MS decreases during treatment with IFN beta-1a. Neurology. 2005;64:236–40. doi: 10.1212/01.WNL.0000149516.30155.B8. [DOI] [PubMed] [Google Scholar]
- Hasan KM, Halphen C, Kamali A, Nelson FM, Wolinsky JS, Narayana PA. Caudate nuclei volume, diffusion tensor metrics, and T(2) relaxation in healthy adults and relapsing-remitting multiple sclerosis patients: implications for understanding gray matter degeneration. Journal of Magnetic Resonance Imaging. 2009;29:70–7. doi: 10.1002/jmri.21648. [DOI] [PMC free article] [PubMed] [Google Scholar]
- Hasan KM, Walimuni IS, Kramer LA, Frye RE. Human brain atlas-based volumetry and relaxometry: application to healthy development and natural aging. Magnetic Resonance in Medicine. 2010;64:1382–9. doi: 10.1002/mrm.22515. [DOI] [PubMed] [Google Scholar]
- Howell OW, Reeves CA, Nicholas R, Carassiti D, Radotra B, Gentleman SM, et al. Meningeal inflammation is widespread and linked to cortical pathology in multiple sclerosis. Brain. 2011;134:2755–71. doi: 10.1093/brain/awr182. [DOI] [PubMed] [Google Scholar]
- Jiang W, Chai NR, Maric D, Bielekova B. Unexpected role for granzyme K in CD56bright NK cell-mediated immunoregulation of multiple sclerosis. J Immunol. 2011;187:781–90. doi: 10.4049/jimmunol.1100789. [DOI] [PMC free article] [PubMed] [Google Scholar]
- Kapoor R, Furby J, Hayton T, Smith KJ, Altmann DR, Brenner R, et al. Lamotrigine for neuroprotection in secondary progressive multiple sclerosis: a randomised, double-blind, placebo-controlled, parallel-group trial. The Lancet Neurology. 2010;9:681–8. doi: 10.1016/S1474-4422(10)70131-9. [DOI] [PubMed] [Google Scholar]
- Khan O, Bao F, Shah M, Caon C, Tselis A, Bailey R, et al. Effect of disease-modifying therapies on brain volume in relapsing-remitting multiple sclerosis: results of a five-year brain MRI study. Journal of the Neurological Sciences. 2012;312:7–12. doi: 10.1016/j.jns.2011.08.034. [DOI] [PubMed] [Google Scholar]
- Kuhlmann T, Lingfeld G, Bitsch A, Schuchardt J, Bruck W. Acute axonal damage in multiple sclerosis is most extensive in early disease stages and decreases over time. Brain. 2002;125:2202–12. doi: 10.1093/brain/awf235. [DOI] [PubMed] [Google Scholar]
- Magliozzi R, Howell O, Vora A, Serafini B, Nicholas R, Puopolo M, et al. Meningeal B-cell follicles in secondary progressive multiple sclerosis associate with early onset of disease and severe cortical pathology. Brain. 2007;130:1089–104. doi: 10.1093/brain/awm038. [DOI] [PubMed] [Google Scholar]
- Magliozzi R, Howell OW, Reeves C, Roncaroli F, Nicholas R, Serafini B, et al. A Gradient of neuronal loss and meningeal inflammation in multiple sclerosis. Annals of Neurology. 2010;68:477–93. doi: 10.1002/ana.22230. [DOI] [PubMed] [Google Scholar]
- Mesaros S, Rocca MA, Pagani E, Sormani MP, Petrolini M, Comi G, et al. Thalamic damage predicts the evolution of primary-progressive multiple sclerosis at 5 years. American Journal of Neuroradiology. 2011;32:1016–20. doi: 10.3174/ajnr.A2430. [DOI] [PMC free article] [PubMed] [Google Scholar]
- Molyneux PD, Kappos L, Polman C, Pozzilli C, Barkhof F, Filippi M, et al. The effect of interferon beta-1b treatment on MRI measures of cerebral atrophy in secondary progressive multiple sclerosis. European study group on interferon beta-1b in secondary progressive multiple sclerosis. Brain. 2000;123(11):2256–63. doi: 10.1093/brain/123.11.2256. [DOI] [PubMed] [Google Scholar]
- Nakamura K, Rudick R, Lee JC, Foulds P, Fisher E. American Academy of Neurology. Seattle, WA: 2010. Effect of intramuscular interferon beta-1a on gray matter atrophy in relapsing-remitting multiple sclerosis. [DOI] [PubMed] [Google Scholar]
- Neema M, Arora A, Healy BC, Guss ZD, Brass SD, Duan Y, et al. Deep gray matter involvement on brain MRI scans is associated with clinical progression in multiple sclerosis. Journal of Neuroimaging. 2009;19:3–8. doi: 10.1111/j.1552-6569.2008.00296.x. [DOI] [PMC free article] [PubMed] [Google Scholar]
- Perry JSA, Han S, Xu QG, Herman ML, Kennedy LB, Csako G, et al. Inhibition of LTi cell development by cd25 blockade is associated with decreased intrathecal inflammation in multiple sclerosis. Science Translational Medicine. 2012;4(145) doi: 10.1126/scitranslmed.3004140. http://dx.doi.org/10.1126/scitranslmed.3004140. [DOI] [PMC free article] [PubMed] [Google Scholar]
- Pfefferbaum A, Mathalon DH, Sullivan EV, Rawles JM, Zipursky RB, Lim KO. A quantitative magnetic resonance imaging study of changes in brain morphology from infancy to late adulthood. Archives of Neurology. 1994;51:874–87. doi: 10.1001/archneur.1994.00540210046012. [DOI] [PubMed] [Google Scholar]
- Pirko I, Lucchinetti CF, Sriram S, Bakshi R. Gray matter involvement in multiple sclerosis. Neurology. 2007;68:634–42. doi: 10.1212/01.wnl.0000250267.85698.7a. [DOI] [PubMed] [Google Scholar]
- Rose JW, Burns JB, Bjorklund J, Klein J, Watt HE, Carlson NG. Daclizumab phase II trial in relapsing and remitting multiple sclerosis: MRI and clinical results. Neurology. 2007;69:785–9. doi: 10.1212/01.wnl.0000267662.41734.1f. [DOI] [PubMed] [Google Scholar]
- Rose JW, Watt HE, White AT, Carlson NG. Treatment of multiple sclerosis with an anti-interleukin-2 receptor monoclonal antibody. Annals of Neurology. 2004;56:864–7. doi: 10.1002/ana.20287. [DOI] [PubMed] [Google Scholar]
- Rudick RA, Fisher E, Lee JC, Duda JT, Simon J. Brain atrophy in relapsing multiple sclerosis: relationship to relapses, EDSS, and treatment with interferon beta-1a. Multiple Sclerosis Journal. 2000;6:365–72. doi: 10.1177/135245850000600601. [DOI] [PubMed] [Google Scholar]
- Schmutz S, Bosco N, Chappaz S, Boyman O, Acha-Orbea H, Ceredig R, et al. Cutting edge: IL-7 regulates the peripheral pool of adult ROR gamma+ lymphoid tissue inducer cells. Journal of Immunology. 2009;183:2217–21. doi: 10.4049/jimmunol.0802911. [DOI] [PubMed] [Google Scholar]
- Sdika M, Pelletier D. Nonrigid registration of multiple sclerosis brain images using lesion inpainting for morphometry or lesion mapping. Human Brain Mapping. 2009;30:1060–7. doi: 10.1002/hbm.20566. [DOI] [PMC free article] [PubMed] [Google Scholar]
- Shiee N, Bazin PL, Ozturk A, Reich DS, Calabresi PA, Pham DL. A topology-preserving approach to the segmentation of brain images with multiple sclerosis lesions. NeuroImage. 2010;49:1524–35. doi: 10.1016/j.neuroimage.2009.09.005. [DOI] [PMC free article] [PubMed] [Google Scholar]
- Shiee N, Bazin PL, Zackowski KM, Farrell SK, Harrison DM, Newsome SD, et al. Revisiting brain atrophy and its relationship to disability in multiple sclerosis. PLoS ONE. 2012;7:e37049. doi: 10.1371/journal.pone.0037049. [DOI] [PMC free article] [PubMed] [Google Scholar]
- Tao G, Datta S, He R, Nelson F, Wolinsky JS, Narayana PA. Deep gray matter atrophy in multiple sclerosis: a tensor based morphometry. Journal of the Neurological Sciences. 2009;282:39–46. doi: 10.1016/j.jns.2008.12.035. [DOI] [PMC free article] [PubMed] [Google Scholar]
- Turner B, Lin X, Calmon G, Roberts N, Blumhardt LD. Cerebral atrophy and disability in relapsing-remitting and secondary progressive multiple sclerosis over four years. Multiple Sclerosis Journal. 2003;9:21–7. doi: 10.1191/1352458503ms868oa. [DOI] [PubMed] [Google Scholar]
- Wuest SC, Edwan JH, Martin JF, Han S, Perry JS, Cartagena CM, et al. A role for interleukin-2 trans-presentation in dendritic cell-mediated T cell activation in humans, as revealed by daclizumab therapy. Nature Medicine. 2011;17:604–9. doi: 10.1038/nm.2365. [DOI] [PMC free article] [PubMed] [Google Scholar]
- Wylezinska M, Cifelli A, Jezzard P, Palace J, Alecci M, Matthews PM. Thalamic neurodegeneration in relapsing-remitting multiple sclerosis. Neurology. 2003;60:1949–54. doi: 10.1212/01.wnl.0000069464.22267.95. [DOI] [PubMed] [Google Scholar]
- Wynn D, Kaufman M, Montalban X, Vollmer T, Simon J, Elkins J, et al. Daclizumab in active relapsing multiple sclerosis (CHOICE study): a phase 2, randomised, double-blind, placebo-controlled, add-on trial with interferon beta. Lancet Neurology. 2010;9:381–90. doi: 10.1016/S1474-4422(10)70033-8. [DOI] [PubMed] [Google Scholar]
- Zivadinov R, Locatelli L, Cookfair D, Srinivasaraghavan B, Bertolotto A, Ukmar M, et al. Interferon beta-1a slows progression of brain atrophy in relapsing-remitting multiple sclerosis predominantly by reducing gray matter atrophy. Multiple Sclerosis Journal. 2007;13:490–501. doi: 10.1177/1352458506070446. [DOI] [PubMed] [Google Scholar]
- Zivadinov R, Reder AT, Filippi M, Minagar A, Stuve O, Lassmann H, et al. Mechanisms of action of disease-modifying agents and brain volume changes in multiple sclerosis. Neurology. 2008;71:136–44. doi: 10.1212/01.wnl.0000316810.01120.05. [DOI] [PubMed] [Google Scholar]
- Zivadinov R, Sepcic J, Nasuelli D, De Masi R, Bragadin LM, Tommasi MA, et al. A longitudinal study of brain atrophy and cognitive disturbances in the early phase of relapsing-remitting multiple sclerosis. Journal of Neurology, Neurosurgery, and Psychiatry. 2001;70:773–80. doi: 10.1136/jnnp.70.6.773. [DOI] [PMC free article] [PubMed] [Google Scholar]