

Abstract
The unique biodiversity of most oceanic archipelagos is currently threatened by the introduction of alien species that can displace native biota, disrupt native ecological interactions, and profoundly affect community structure and stability. We investigated the threat of aliens on pollination networks in the species-rich lowlands of five Galápagos Islands. Twenty per cent of all species (60 plants and 220 pollinators) in the pooled network were aliens, being involved in 38 per cent of the interactions. Most aliens were insects, especially dipterans (36%), hymenopterans (30%) and lepidopterans (14%). These alien insects had more links than either endemic pollinators or non-endemic natives, some even acting as island hubs. Aliens linked mostly to generalized species, increasing nestedness and thus network stability. Moreover, they infiltrated all seven connected modules (determined by geographical and phylogenetic constraints) of the overall network, representing around 30 per cent of species in two of them. An astonishingly high proportion (38%) of connectors, which enhance network cohesiveness, was also alien. Results indicate that the structure of these emergent novel communities might become more resistant to certain type of disturbances (e.g. species loss), while being more vulnerable to others (e.g. spread of a disease). Such notable changes in network structure as invasions progress are expected to have important consequences for native biodiversity maintenance.
Keywords: biological invasions, insect and vertebrate pollination, modularity, mutualistic interactions, nestedness, oceanic islands
1. Introduction
Islands house a large proportion of global biodiversity. However, much of it is threatened by habitat degradation and loss, exploitation of natural resources and introduction of alien species [1–3]. The impact of alien species is especially severe on islands rich in endemic species [2,4]. As island species are being lost, so are their interactions with other species, initiating cascading effects through entire communities [5–7]. Nevertheless, most conservation and restoration projects on islands fail to incorporate interactions as indicators of ecosystem functions, particularly plant–animal mutualisms such as pollination and seed dispersal [8–10].
Animal pollination is essential to the reproductive success of most plant species, and, as such, is crucial to the maintenance of diversity and functioning of terrestrial ecosystems [5,11]. There are a few general patterns of pollination networks on oceanic islands, which include: (i) small network size; (ii) strong dominance of one or a few taxa and a scarcity or absence of certain groups (e.g. insect pollinators with long proboscises, bees); (iii) low ratio between species richness of pollinators and plants; (iv) dominance of plants with open and easily accessible flowers, pollinated by either insects or vertebrates, especially birds and lizards; and (v) higher generalization level than mainland networks, with some species even operating as super-generalists or density compensators [12–14]. Small network size together with the presence of super-generalists result in highly connected networks (i.e. many potential interactions are also realized). Some of these network properties actually facilitate the integration of alien species [15,16].
(a). Vulnerability of network structure to alien species
The arrival of new species to islands may notably alter the structure and dynamics of their networks [9,16–19]. However, the generality of this is still under debate, and our knowledge of the mechanisms underlying the integration of alien species into native networks and their subsequent impact is still limited. Network analysis is a highly valuable tool in our effort to understand this process of integration, and to plan robust conservation and restoration strategies [10,18,20]. A number of network metrics can inform us about the ability of communities to respond to various kinds of environmental perturbations, and may easily be incorporated into conservation monitoring [20]. For example, higher interaction diversity may increase the rates of ecosystem processes; in pollination networks, it may lead to larger seed set because of increased functional complementarity [21]. Generally, integration of aliens into pollinator networks does not seem to affect overall connectance (but see [22]), although the number of interactions among natives may decline [16,23]. Likewise, interaction evenness, which measures the uniformity in the distribution of interaction frequencies and is inversely related to network stability [24], may decrease with higher invasion intensity [18]. Level of invasion may also reduce species specialization (d′) of native species [19], implying that they become less selective in their choice of mutualists by being compelled to interact with the most abundant aliens as invasion progresses. Invaders can also induce changes in levels of network nestedness [16,25] and modularity [25]; both link patterns are also diagnostic signs of network stability [26,27]. Hence, invaded networks could be more stable, because of a lower interaction evenness and specific changes in nestedness and modularity, making restoration more difficult [22,28].
(b). The threatened Galápagos ecosystems
Over the last century, the unique Galápagos ecosystems have become jeopardized by the effects of globalization. Humans have increasingly settled on the islands, mediating the establishment of many aliens [29]. The number of alien plants has increased exponentially, currently forming 60 per cent of the vascular flora [30]. Likewise, around 500 insect species (representing 25% of all Galápagos insect species) have been introduced, a number continuously growing [31]. However, little is known about the mechanisms by which such aliens become integrated into the native Galápagos ecosystems and how they affect mutualistic networks.
In this study, we investigated the pollination patterns in the arid zone of the Galápagos. First, we assessed the diversity of interactions within and across islands, identifying the main network hubs and comparing interaction patterns of native and alien species. Second, we evaluated the level of link structure with respect to nestedness and modularity, especially in relation to alien links. In particular, we examined the importance of geography, phylogeny and aliens as drivers of a modular structure of the pollination network of the archipelago.
2. Methods
(a). Study sites
The Galápagos Islands lie on the Equator in the eastern Pacific, 960 km to the west of the South American continent. This young volcanic archipelago (0.035–4 Ma [32]) comprises 18 islands larger than 1 km2 and numerous islets. Arid zones dominate the lowland on all islands (around 60% of total land area); they show the highest plant diversity and endemicity, and a relatively low fraction of alien plant species compared with the transition and humid zones [29]. The Galápagos flora consists of 557 native vascular species, of which 32 per cent are endemic, and an additional 825 (approx. 60%) aliens [30].
A recent study has reviewed all known plant–pollinator interactions in the archipelago [33]. Only one of them, performed at Isabela Island, involved a network analysis of pollination interactions [34]. These authors found high connectance, nestedness (‘asymmetrical pattern of number of interactions per species’), higher pollinator than plant linkage level and high dependence of seed production on insect visits. However, the ratio between pollinator and plant species was only 0.5, which is very low, indicating that the study site was very poor in insects, even for an insular environment [14].
We built a lowland pollination network for each of five islands (figure 1), differing in age and degree of disturbance, from youngest/pristine to oldest/disturbed: Fernandina (0.035–0.07 Ma), Pinta (earlier than 0.7 Ma, undetermined maximum), Santiago (0.8–1.4 Ma), Santa Cruz (1.1–2.3 Ma) and San Cristóbal (2.4–4 Ma) [32].
Figure 1.
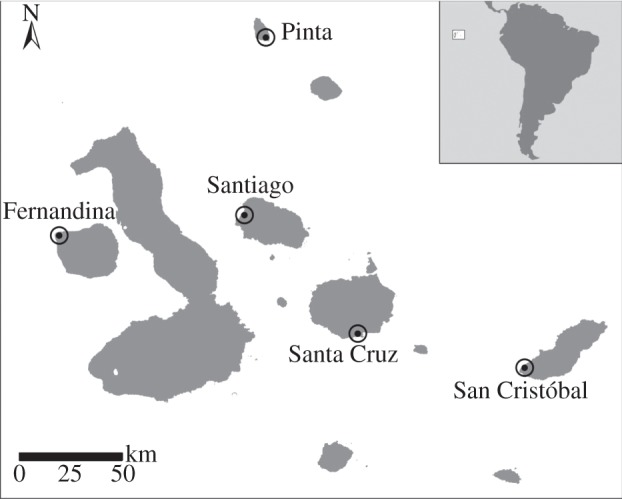
Map of the Galápagos Islands showing the study sites. Inset: location of Galápagos archipelago.
(b). Observation of pollinators
In February 2010 and 2011, during the peak of the flowering season, we collected data on visitation interactions to flowering plants in the arid zone of each island. Upon arrival to each island, we explored an area of about 1 km2 around the disembarkation point (mainly for logistical reasons), and recorded all plants in flower to be subsequently censused for pollinators. During three consecutive days on each island and year, five people made pollinator observations at all those flowering plant species in a random way, always trying to maximize the number of individuals of each species. A total of 518 h were invested in pollinator censuses, comprising 446 h diurnal (08.00–18.00) and 72 h nocturnal (18.30–21.00); we did not have permits to overnight on the islands. On average, each flowering plant species was observed for roughly 8 h, depending on the number of islands on which it occurred and on whether or not it flowered both years. Overall sampling effort was similar in all islands. All flower-visiting animals touching reproductive parts of flowers were recorded and classified as pollinators, irrespective of their effectiveness. Pollinators were collected when field identification was not possible. A total of 4513 flower visits were recorded. Insect specimens (n = 710) were identified and deposited at the Charles Darwin Research Station. If identification to species level could not be achieved, insects were sorted into morphotypes. Finally, flower abundance of all plant species at each study site, using 500 ×6 m transects, was estimated.
(c). Network analysis
We built a quantitative plant–pollinator interaction matrix for each island and a pooled matrix for all five islands (‘archipelago network’, hereafter). As interaction weight we used visitation frequency, expressed as the number of flowers contacted by each pollinator species during a census, standardized by number of flowers observed, number of census per plant species and specific flower abundance [35].
We calculated eight parameters that describe network topology: two at species level (linkage level; and specialization level, d′) and six at network level (connectance; interaction diversity; interaction evenness; network specialization, H2’; weighted nestedness; and modularity; see the electronic supplementary material, appendix S1 for a description of these). All parameters were estimated for each study site/island, except modularity, which was only calculated for the archipelago network. Most metrics were calculated using the R package ‘bipartite’ v. 2.15.1 [36]. Weighted estimates of nestedness were obtained using the weighted nestedness metric (WNODF) program [37], whereas modularity (M) was estimated using NETCARTO [38]. The role of each species as network hub, module hub, connector or peripheral was assigned following Olesen et al. [39] (see the electronic supplementary material, appendix S1 for details). The significance level of WNODF estimates was assessed against 1000 randomizations using a fixed row and column, totals constrained null model, while that of M was assessed against 100 randomizations constrained by the same linkage level ranking as the empirical one. General linear models were used to compare network metrics across islands and across species of different origins, using R v. 2.11. The ‘multcomp’ package (Tukey's test) was used to test for variation between categories.
3. Results
(a). Diversity of interactions within and across islands
The archipelago network consisted of 280 species (60 plants and 220 pollinators; table 1), approximately 35 per cent of which were nocturnal. We observed a total of 758 links, resulting in a connectance of 5.7 per cent. Mean plant linkage level was more than three times that of the pollinators (Lp = 12.6, La = 3.5; t = 10.44, p < 0.001; table 1), reflecting the ratio between species number of pollinators and plants. Visualizations of the network from each island and the combined archipelago network can be found in the electronic supplementary material figure S1.
Table 1.
Topology descriptors of the pollination networks in five Galápagos islands. P and A, number of plant and animal species, respectively; S, network size (P+A); I, number of realized interactions; C, connectance (I/AP); IE, interaction evenness;  , index of network specialization; WNODF, weighted nestedness metric; X ± s.d., mean ± standard deviation. For each plant (p) and animal (a) species, the number of links (L), generality (G), and index of species specialization (d′) are also given. Interaction weight in the quantitative networks is the number of visited flowers by each pollinator species standardized by census time and flower abundance in the community. For each L and d′ column, values sharing the same letter are not significantly different (p < 0.05). All WNODF values are significant (p < 0.001).
| Island | P | A | S | I | C | Lp (X±s.d.) | La (X±s.d.) | Gp | Ga | IE |  |
 (X±s.d.) (X±s.d.) |
 (X±s.d.) (X±s.d.) |
WNODF |
|---|---|---|---|---|---|---|---|---|---|---|---|---|---|---|
| Fernandina | 18 | 60 | 78 | 125 | 0.12 | 6.94±5.43a | 2.08±1.60ac | 1.60 | 8.06 | 0.69 | 0.70 | 0.62±0.18a | 0.44±0.25a | 9.21 |
| Pinta | 21 | 76 | 97 | 133 | 0.08 | 6.33±7.04a | 1.75±1.65a | 1.68 | 12.38 | 0.76 | 0.52 | 0.65±0.21a | 0.44±0.23a | 10.41 |
| Santiago | 24 | 69 | 93 | 168 | 0.10 | 7.00±5.26a | 2.43±3.13ab | 2.20 | 3.84 | 0.51 | 0.49 | 0.52±0.25a | 0.49±0.22a | 13.25 |
| Santa Cruz | 23 | 76 | 99 | 215 | 0.12 | 9.35±6.53b | 2.83±3.40b | 2.13 | 6.36 | 0.60 | 0.60 | 0.49±0.16a | 0.47±0.20a | 16.04 |
| San Cristóbal | 21 | 93 | 114 | 234 | 0.12 | 11.14±8.63b | 2.52±2.68cb | 2.93 | 4.77 | 0.66 | 0.59 | 0.46±0.23a | 0.39±0.18a | 17.84 |
| all islands | 60 | 220 | 280 | 758 | 0.06 | 12.63±3.51 | 3.45±4.61 | 3.28 | 9.69 | 0.67 | 0.57 | 0.52±0.19 | 0.42±0.22 | 11.87 |
Island network size varied from 78 species on the youngest, most pristine Fernandina to 114 on the oldest and most disturbed San Cristóbal. Despite the known effect of network size on connectance, this parameter stayed constant across islands, except for Pinta (table 1). Plants and animals had higher linkage levels on the oldest islands, San Cristóbal and Santa Cruz (table 1).
Twenty per cent of all species in the archipelago network were aliens and most of these were insects, especially dipterans (36%), hymenopterans (30%) and lepidopterans (14%). Alien pollinators visited significantly more plant species than non-endemic native pollinators (natives, hereafter) (z = 5.53, p < 0.001) and marginally more than endemic pollinators (z = 2.21, p = 0.07); endemics also visited more plant species than natives (z = 4.15, p < 0.001; table 2). In total, alien pollinators, constituting 21 per cent of all pollinator species, were involved in a disproportionally large fraction (38%) of all network links. They entered the network most often (80% of cases) by linking to highly generalist plants (i.e. those visited by 10 or more pollinator species). Regarding plants, 48 per cent of the 60 species were endemic to Galápagos, and only three species were aliens: Tamarindus indica and Cleome viscosa on Santiago, and Momordica charantia on Santa Cruz. These alien plants showed lower linkage levels (Lp = 7 for T. indica, 4 for C. viscosa and 3 for M. charantia) than an average plant species (Lp = 12.6). Alien plants were visited by super-generalist bee Xylocopa darwini and by other endemic insects as well, but five cases of alien–alien interactions were also observed, viz. T. indica was visited by Hemiargus ramon (Lepidoptera: Lycaenidae), Polistes versicolor (Hymenoptera: Vespidae) and Monomorium destructor (Hymenoptera: Formicidae), while M. charantia was visited by Monomorium floricola and Tapinoma melanocephalum (Hymenoptera: Formicidae).
Table 2.
Animal species richness, linkage level (La) and specialization index ( ) of pollinators classified according to their distribution status (n = 148). X ± s.e., mean ± standard error. Data were pooled from the five study islands. For each column, values sharing the same letter are not significantly different (p < 0.001). Only species of known origin were used for the analyses.
| pollinator origin | no. of species | La (X±s.e.) |
 (X±s.e.) (X±s.e.) |
|---|---|---|---|
| endemic | 64 | 4.17±0.68a | 0.39±0.03a |
| native (non-endemic) | 26 | 2.38±1.06b | 0.41±0.04a |
| alien | 58 | 4.97±0.70c | 0.40±0.03a |
Four plant species were super-generalists, being involved in 28 per cent of all links in the archipelago network. These were three endemic shrubs—Croton scouleri (73 links), Cordia leucophlyctis s.l. (59) and Lantana peduncularis (45)—and the doubtfully native herb Tribulus cistoides (36). Cordia leucophlyctis s.l. and L. peduncularis are present on all five islands whereas the other two are on at least three. The network had also five super-generalist pollinators with 20 or more links each, representing 16 per cent of all network links. Two were endemic (the bee X. darwini and the lycaenid Leptotes parrhasioides), but the other three were introduced: H. ramon (morphologically similar to L. parrhasioides), P. versicolor (Hymenoptera: Vespidae), and Pseudodoros clavatus (Diptera: Syrphidae). The latter was present on all five islands, X. darwini and P. versicolor on all islands except Pinta, whereas the two butterflies occurred on Santiago, Santa Cruz and San Cristóbal.
Each island network had its own hubs, which most often were not shared with networks of the other islands (table 3). Moreover, some hubs in island networks (e.g. the plants C. scouleri, C. leucophlyctis s.l. and L. peduncularis, and the carpenter bee X. darwini) were also hubs in the archipelago network. In island networks, the main pollinator hubs were hymenopterans, dipterans and lepidopterans, though their relative importance varied across islands (table 3). At least one pollinator hub in each island network was an alien. Santa Cruz and San Cristóbal even had more alien than native pollinator hubs (table 3).
Table 3.
Plant and pollinator hubs in the five Galápagos islands. The taxonomic order of the pollinator species is given abbreviated before its scientific name (Hy, Hymenoptera; Di, Diptera; Le, Lepidoptera). Number of links of each species is given in parentheses. Species alien to Galápagos are indicated by an asterisk.
| Fernandina | Pinta | Santiago | Santa Cruz | San Cristóbal |
|---|---|---|---|---|
| plant hubs (n pollinator species) | ||||
| Bursera graveolens (22) | Croton scouleri (31) | Tribulus cistoides (22) | Cordia leucophlyctis s.l. (25) | C. scouleri (36) |
| T. cistoides (15) | Opuntia galapageia (15) | Lantana peduncularis (19) | Clerodendrum molle (22) | C. leucophlyctis s.l. (29) |
| C. leucophlyctis s.l. (11) | Lantana peduncularis (13) | Blainvillea dichotoma (12) | C. scouleri (21) | Vallesia glabra (21) |
| Pectis tenuifolia (10) | B. graveolens (11) | Heliotropium angiospermum (11) | Tournefortia psilostachya (16) | Cordia lutea (15) |
| Cryptocarpus pyriformis (10) | Commicarpus tuberosus (10) | L. peduncularis (14) | Waltheria ovata (14) | |
| Prosopis juliflora (10) | C. leucophlyctis s.l. (10) | Cordia lutea (13) | ||
| Macraea laricifolia (10) | ||||
| pollinator hubs (n plants visited) | ||||
| Hy-Camponotus planus (10) | Di-Lepidanthrax tinctus (11)* | Hy-Xylocopa darwini (15) | Hy-X. darwini (16) | Le-Hemiargus ramon (15)* |
| Di-Pseudodoros clavatus (6)* | Di-Chrysanthrax primitiva (9) | Le-Agraulis vanillae (14) | Hy-Polistes versicolor (14)* | Hy-Camponotus conspicuus zonatus (11)* |
| Di-C. primitiva (5) | Hy-Oxybelus schusteri (7) | Le-H. ramon (14)* | Le-Leptotes parrhasioides (13) | Hy-X. darwini (11) |
| Di-P. clavatus (9)* | Hy-Tapinoma melanocephalum (12)* | Le-Urbanus dorantes (9) | ||
| Le-L. parrhasioides (9) | Hy-Paratrechina longicornis (11)* | Hy-Anthidium vigintiduopunctatum (8)* | ||
| Le-Urbanus dorantes (8) | Hy-Brachygastra lecheguana (9)* | |||
Regarding quantitative network metrics, we found that mean plant generality (i.e. the effective number of pollinator individuals visiting each plant; see the electronic supplementary material, appendix S1) was three times lower than pollinator generality, despite the number of links being higher for plants than for pollinators (table 1). Comparing across islands, Fernandina and Pinta showed the lowest values of plant generality, but the highest of pollinator generality (plant and pollinator generality were not significantly correlated). Moreover, the archipelago network and all island networks were uneven in their interaction frequencies (table 1).
Fernandina had the highest network specialization ( ) (table 1). However, at the species level, specialization (d′) did not vary significantly among islands either for plants or for pollinators (table 1). Moreover, no significant differences in d′ were detected among alien, native and endemic pollinators (all p ≥ 0.80; table 2).
(b). Nestedness
Both the archipelago network and the five island networks were significantly nested (table 1). Nestedness values ranged from 9.21 for Fernandina to 17.84 for San Cristóbal. Alien plants and pollinators boosted nestedness by linking mostly to generalists. In addition, interactions between specialists were rare (see the electronic supplementary material, figure S1).
(c). Modularity of the archipelago network
The archipelago network was significantly modular, with a modularity level of M = 0.41 (mean ± s.d. of 100 randomizations of this network = 0.37 ± 0.005; p < 0.001). It consisted of seven connected modules (i.e. subgroups of plants and pollinators more strongly linked to each other than to plants and pollinators in other modules), plus a single pair of species disconnected from the main network (table 4 and figure 2). More than half (59%) of all links in the network were within modules (table 4).
Table 4.
Number of species and links of the modules of the pooled pollination network. Module connectance is the proportion of realized links in the module. Modules are named according to their species composition and to the geographical origin of most of their species. Species identities in each module are given in the electronic supplementary material, appendix S3.
| module | no. plant spp. | no. pollinator spp. | no. within-module links | no. between-module links | module connectance |
|---|---|---|---|---|---|
| 1. Pinta | 1 | 1 | 1 | 0 | 1.00 |
| 2. San Cristóbal (alien ants and wasps) | 11 | 29 | 80 | 124 | 0.25 |
| 3. Santiago (bees) | 13 | 22 | 67 | 105 | 0.23 |
| 4. Pinta (vertebrates and nocturnal lepidopterans) | 6 | 31 | 40 | 52 | 0.22 |
| 5. all islands (dipterans) | 13 | 25 | 64 | 102 | 0.20 |
| 6. Pinta, Fernandina, San Cristóbal (lepidopterans) | 7 | 59 | 111 | 125 | 0.27 |
| 7. Fernandina, Santiago | 3 | 21 | 28 | 54 | 0.44 |
| 8. Santa Cruz (nocturnal lepidopterans) | 6 | 32 | 47 | 78 | 0.24 |
| total | 60 | 220 | 448 | 620a |
aThe number of between-module links corresponds to twice the number of actual links, as links are counted in both of the modules they connect.
Figure 2.
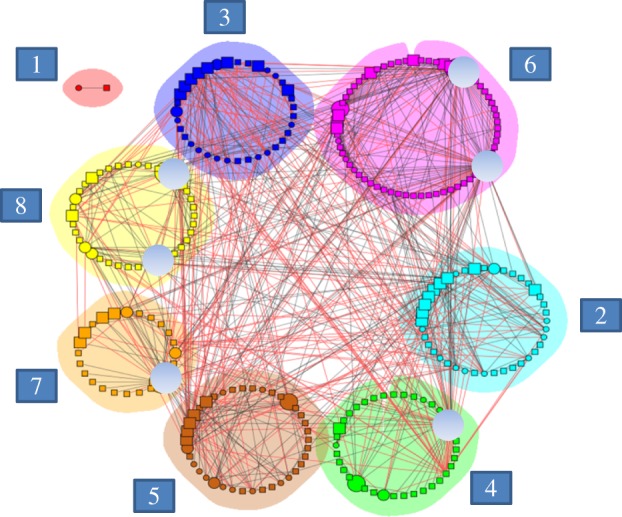
Modules (in different colours) in the network of 60 plants and their 220 pollinators. Size of a node (species) depicts the different network roles, from peripherals (smallest) to network hubs (largest, indicated in grey circles). Plant species are represented by circles and animals by squares (species identities given in the electronic supplementary material, appendix S3). Links of alien species are indicated in red, whereas those of the remaining species are in black (native, endemic or of unknown origin). Alien links represent 34 per cent of all links among modules. Numbers in squares refer to the module number given in the text.
We identified six network hubs (i.e. species with many links both within their own module and also to other modules, and consequently important to overall network coherence; figure 2). These were all plants: the endemics C. scouleri, C. leucophlyctis s.l. and L. peduncularis, the natives Tournefortia psilostachya and Clerodendrum molle, and the doubtfully native T. cistoides. All these species were present on more than three islands except C. molle, which was found only on Santa Cruz. Three other plant species were classified as module hubs: the natives Bursera graveolens and Heliotropium angiospermum, and the endemic Opuntia galapageia; these plants were mainly visited by many pollinators from their own modules.
A total of 48 species (17%) were network connectors, which included native and endemic plants, but mainly (77%) insects, specifically hymenopterans, lepidopterans and dipterans. Of all insect connectors (37 spp.), at least 18 species were aliens. Most network connectors were found on a minimum of three islands, although a few occurred on a single island. Insect connectors pollinated plants belonging to different modules, whereas plant connectors were visited by pollinators belonging to different modules. Connectors bind modules together and are thus important to the coherence of the entire network.
Finally, most nodes were peripheral species, i.e. poorly connected species. Here, 223 species (approx. 80% of all species) played this role, with an average of 2.8 links each.
Modules had a strong geographical component, most being composed of species present from the same island, although they also contained a few species from other islands (see the electronic supplementary material, table S1). A phylogenetic component was also evident, because some modules were dominated by particular taxonomical groups of pollinators. The species composition of each module is listed in the electronic supplementary material (table S1), and summarized below.
Module 1 was an outlier, composed of a single pair of species from Pinta, not linked to any other species in the network. Module 2 had many species from San Cristóbal and the highest fraction of alien species (33%), including several ant species and one wasp. Module 3 also had a high proportion of alien species (29%), which was mostly from Santiago and included the three bees known to the archipelago. Both modules 2 and 3 contained potential invasional complexes (alien plants and pollinators strongly interacting with each other) and the highest number of network connectors. Module 4 was dominated by vertebrate pollinators and nocturnal moths, most of which were recorded on Pinta. Module 5 consisted mainly of dipterans and their plants, and almost half of the species were found on Pinta, Fernandina or both. Module 6 was the largest module; it was dominated by lepidopterans, and most interactions were observed on San Cristóbal, Pinta and Fernandina. Module 7 was the second smallest, with species from Fernandina and Santiago. Finally, module 8 was dominated by nocturnal lepidopterans from Santa Cruz.
4. Discussion
(a). Emerging pollination patterns in the Galápagos Islands
In qualitative networks, connectance (C) is a measure, albeit crude, of network generalization level. A previous study [40] analysed 29 pollination networks originating from both mainland and islands, finding that C = 13.83 exp(−0.003(A+P)), where A and P are number of pollinator and plant species, respectively. C did not differ between mainland and islands. In Galápagos, island network C had a mean of 10.8 per cent and did not vary among islands. This figure was quite similar to the expected mean C = 10.4 per cent for the island networks using the model by Olesen & Jordano [40]. The C-values found in [33] for the Galápagos island of Isabela was much higher (27% for the observation matrix and 33% for the matrix combining observation and pollen load on insect bodies). This is attributable to its much smaller network (A + P = 16 species). Thus, C-values of the Galápagos island networks were in accordance with global patterns and did not seem to depend upon the level of invasion. Nonetheless, with the continuing invasion by particular species in this archipelago, the number of species interactions among natives might well decline, as reported in some communities [16,23], although in some cases aliens increase connectance [22].
Despite being one of the best preserved archipelagos in the world, as much as roughly 40 per cent of pollination interactions on Galápagos already involve aliens. These are mainly human-mediated insect introductions, and we found that at least in the arid zone they are mostly dipterans, ants and lepidopterans. A total of 58 alien species were detected, although the final number will probably be higher once all cryptogenic species are identified.
As often reported for pollination networks [16,40], plants were more generalized than pollinators. This is partly attributable to the phytocentric approach of the study (censusing pollinators that arrive to plants rather than following the pollinator's movements among plants), although other studies on pollen transport (zoocentric) matrices also find higher plant than animal linkage levels [41,42] (but see [33]). Alien plants in our networks were not highly generalized, and thus did not support previous findings [16,23]. However, they linked to generalized pollinators, as found in these studies, which increased nestedness (see below). These pollinators were either endemic or alien. In the first case, those novel interactions might pose a threat to native plants if these compete with alien plants for pollinators. Such competition may reduce pollinator visitation rate and/or reproductive success of natives in different systems [43] (but see [18]). For instance, the abundant and nectar-rich flowers of the alien T. indica attract many endemic carpenter bees, which, as a consequence, may visit fewer co-occurring native flowers. In the second case, the novel interactions might result in invasional meltdowns, as the invasion of plants may enhance that of alien pollinators and vice versa. In our study sites, we did indeed detect five potential cases of ‘invader complexes’, which need further study to assess their importance at the population and community levels.
The generalized alien pollinators increased nestedness, which may improve network stability [26,27]. Nestedness tended to be higher in the older, more invaded islands of San Cristóbal and Santa Cruz, suggesting they contain more stable communities. This raises the question of the relationship between network stability and network degradation. A greater stability can be a signature of pristine communities, but also of already eroded communities [44].
The three most generalized plant species are widespread endemic shrubs with a large floral display. Regarding pollinators, all hubs were insects, and X. darwini was the most generalized pollinator when pooling data from the five islands, supporting findings from a recent review [33]. Apart from another endemic hub, the lycaenid L. parrhasioides, the most generalized pollinators were three alien insects: another lycaenid, a wasp and a hoverfly. These are likely to have the strongest impact on network structure and reproductive success of native/endemic plants, although a more detailed study should confirm so. The wasp (P. versicolor), in particular, was present and abundant on all islands but Pinta; however, its effectiveness as pollinator is still doubtful, and it is also unknown if it has any negative effects on native pollinators owing to competition for floral rewards. The hoverfly, P. clavatus, was also present on all five islands and, given the importance of Syrphidae as legitimate pollinators, it might well enhance pollination of native plants while being detrimental to native insects, if they compete for resources. On San Cristóbal and Pinta, the most important pollinators—regarding linkage level—were actually alien species, perhaps after having displaced some native ones, as has happened elsewhere [23].
The higher generality of pollinators compared with plants resulted from the greater diversity in interaction frequency of the former. This has also been found in other mutualistic networks [18] (but see [35]) and might be due to the phytocentric methodology as well as the higher frequency of pollinator singletons. Mutualistic networks are always uneven in their distribution of interaction frequencies and our networks are no exception. On a gradient of invasion intensity, a decrease in interaction evenness was observed, being attributed to shifts in the proportion of strong and weak interactions in the networks [18]. The comparison of invaded versus uninvaded areas will allow assessment of a change in this parameter with invasion level. Regarding network specialization ( ), Fernandina showed the highest value, reflecting that species tend to interact with partners that are not necessarily abundant. As with connectance,
  values fell within the range found for dispersal networks in these islands [19] and also for other island networks [35]. For both plant and pollinator species, a wide variation in specialization was found within each island, and that might blur any differences across islands. Although alien pollinators on average visited more plant species than native and endemic pollinators, they were similarly specialized. As far as we know, no data are available from other studies comparing this property between alien and native insects.
(b). The role of aliens in the structure of novel communities
Aliens entered the pollination network by interacting with generalized natives, as reported previously [16,23]. This usually results in increased complexity in network structure, especially in nestedness, a property that buffers secondary extinctions [26,27]. In addition, aliens integrated into all connected modules, representing as much as roughly 30 per cent of the species in two modules, one composed mostly of species from San Cristóbal and the other of species from Santiago. The potential invader complexes were also located in these two modules in which mostly alien ants, bees and wasps were involved. These hymenopterans might thus constitute the highest risk to plant reproduction, if they are less effective than native pollinators [7]. Alien dipterans were also common in the archipelago network, but their interactions were spread across different modules, and thus their effect on plant reproduction might be less important.
So far, none of the aliens are network or module hubs, but as invasion progresses such species might well take over these roles from natives, as described in other systems [23,25], with potential cascading effects on the overall network structure (but see [18]). Alien insects, however, played an important role as network connectors, representing 38 per cent of all connector species and taking part in 34 per cent of all inter-module links. The proportion of network connectors was slightly higher than in other pollination networks [9,39]. Alien connectors may enhance module fusion (i.e. their higher generalization levels lead to stronger connections among modules). This may be detrimental to overall network stability as cascading processes after a disturbance (e.g. the spread of a disease) are more likely to ripple through the entire network [20]. However, a more cohesive network may also be more robust to cumulative extinctions of species, as lost interactions can be more easily backed up (but see [25]). On the other hand, alien connectors might be replacing native network connectors, and then it might be difficult to predict the consequences for stability without knowing how redundant they are with respect to their pollination function. If alien insects acted as legitimate pollinators, they could actually enhance plant reproductive success and replace, to some extent, lost native pollinator species [7]. If, however, most alien insects are ineffective pollinators, the network might seem cohesive from a topological viewpoint, but in fact might be weak from an ecosystem service's perspective (see also [25]).
Modularity is a topological metric that may also be informative from an evolutionary viewpoint [39]. We might predict that species belonging to the same module—in our case, also being found in the same island—are more likely to be coadapted to each other than are species from other modules [45]. The discovery of such modules can indeed be the platform for more detailed studies on the evolutionary interactions between pollinators and their nectar plants. We further predict that the alien intruders into these modules will probably affect such coadaptations, with unknown consequences for the success of native species.
5. Conclusions
We identified a surprisingly high proportion of alien insects visiting the flowers of plants in the dry zone of five Galápagos islands. Overall, alien species took part in around 40 per cent of the 758 interactions recorded. The flowers of alien plants were visited by endemic and alien pollinators, and we detected five cases of potential invasional meltdown. The most generalized plants and pollinators were endemic but, on average, alien pollinators visited more plants than native and endemic counterparts. Moreover, alien species tended to interact with the most generalized counterparts; by doing so, they increase network nestedness and, hence, stability against perturbations involving species losses. Alien insects have infiltrated seven of the eight modules identified, representing up to 30 per cent of the species in two of them and undertaking structurally important roles as module connectors. Specifically, a high fraction of them connected the different modules, contributing to network cohesiveness. This might decrease network robustness if the probability of cascade losses after a perturbation (e.g. entrance of a parasite) is lower in highly modular networks. On the contrary, alien connectors might enhance network robustness against specific perturbations affecting particular modules (e.g. a vertebrate pollination module), if they counteract the wipeout of such a module and/or contribute to maintain its functioning. A recent study stresses the importance of improving biological forecasting by detecting early ‘warning signals’ of critical transitions, at both global and local scales [46]. We believe that a critical threshold to maintain community functioning may already have been reached in Galápagos, one of the best-preserved archipelagos in the world.
Acknowledgements
We thank the staff at the Galápagos National Park, particularly Washington Tapia for logistical support and facilitating our trips between islands, and the Charles Darwin Foundation for allowing us to use their laboratories, the herbarium and the insect collections. We are especially grateful to the taxonomists who identified the insects, especially Ana Maria Ortega and Alejandro Mieles. We also thank Novarino Castillo for being our ‘guardian angel’ during the field trips, and Eduardo Rosero ‘Vikos’ (captain of Queen Mabel) and his crew for making boat trips a very interesting experience and for taking minimum risks during the often difficult disembarkations. We are grateful to two anonymous reviewers for their valuable comments. We also thank Charles Novaes de Santana for his help when making figure 2. The research was financed by BBVA Foundation. This publication is contribution no. 2060 of the Charles Darwin Foundation.
References
- 1.Sax DF, Gaines SD. 2008. Species invasions and extinction: the future of native biodiversity on islands. Proc. Natl Acad. Sci. USA 105, 11 490–11 497 10.1073/pnas.0710824105 (doi:10.1073/pnas.0710824105) [DOI] [PMC free article] [PubMed] [Google Scholar]
- 2.Berglund H, Järemo J, Bengtsson G. 2009. Endemism predicts intrinsic vulnerability to nonindigenous species on islands. Am. Nat. 174, 94–101 10.1086/598501 (doi:10.1086/598501) [DOI] [PubMed] [Google Scholar]
- 3.Fordham DA, Brook BW. 2010. Why tropical island endemics are acutely susceptible to global change. Biodivers. Conserv. 19, 329–342 10.1007/s10531-008-9529-7 (doi:10.1007/s10531-008-9529-7) [DOI] [Google Scholar]
- 4.Walsh JC, Venter O, Watson JEM, Fuller RA, Blackburn TM, Possingham HP. 2012. Exotic species richness and native species endemism increase the impact of exotic species on islands. Glob. Ecol. Biogeogr. 21, 841–850 10.1111/j.1466-8238.2011.00724.x (doi:10.1111/j.1466-8238.2011.00724.x) [DOI] [Google Scholar]
- 5.Bond WJ. 1994. Do mutualisms matter? Assessing the impact of pollinator and disperser disruption on plant extinction. Phil. Trans. R. Soc. Lond. B 344, 83–90 10.1098/rstb.1994.0055 (doi:10.1098/rstb.1994.0055) [DOI] [Google Scholar]
- 6.Kearns CA, Inouye DW, Waser NM. 1998. Endangered mutualisms: the conservation of plant–pollinator interactions. Annu. Rev. Ecol. Syst. 29, 83–112 10.1146/annurev.ecolsys.29.1.83 (doi:10.1146/annurev.ecolsys.29.1.83) [DOI] [Google Scholar]
- 7.Traveset A, Richardson DM. 2006. Biological invasions as disruptors of plant reproductive mutualisms. Trends Ecol. Evol. 21, 208–216 10.1016/j.tree.2006.01.006 (doi:10.1016/j.tree.2006.01.006) [DOI] [PubMed] [Google Scholar]
- 8.Dixon KW. 2009. Pollination and restoration. Science 325, 571–573 10.1126/science.1176295 (doi:10.1126/science.1176295) [DOI] [PubMed] [Google Scholar]
- 9.Memmott J. 2009. Foodwebs: a ladder for picking strawberries or a practical tool for practical problems. Phil. Trans. R. Soc. B 364, 1693–1699 10.1098/rstb.2008.0255 (doi:10.1098/rstb.2008.0255) [DOI] [PMC free article] [PubMed] [Google Scholar]
- 10.Kaiser-Bunbury CN, Traveset A, Hansen DM. 2010. Conservation and restoration of plant–animal mutualisms on oceanic islands. Persp. Plant Ecol. Evol. Syst. 12, 131–143 10.1016/j.ppees.2009.10.002 (doi:10.1016/j.ppees.2009.10.002) [DOI] [Google Scholar]
- 11.Hoover SER, Ladley JJ, Shchepetkina AA, Tisch M, Gieseg SP, Tylianakis JM. 2012. Warming, CO2, and nitrogen deposition interactively affect a plant–pollinator mutualism. Ecol. Lett. 15, 227–234 10.1111/j.1461-0248.2011.01729.x (doi:10.1111/j.1461-0248.2011.01729.x) [DOI] [PubMed] [Google Scholar]
- 12.Olesen JM, Eskildsen LI, Venkatasamy S. 2002. Invasion of pollination networks on oceanic islands: importance of invader complexes and endemic super generalists. Divers. Distrib. 8, 181–192 10.1046/j.1472-4642.2002.00148.x (doi:10.1046/j.1472-4642.2002.00148.x) [DOI] [Google Scholar]
- 13.Kaiser-Bunbury CN, Memmott J, Müller CB. 2009. Community structure of pollination webs of Mauritian heathland habitats. Persp. Plant Ecol. Evol. Syst. 11, 241–254 10.1016/j.ppees.2009.04.001 (doi:10.1016/j.ppees.2009.04.001) [DOI] [Google Scholar]
- 14.Trøjelsgaard K, Olesen JM. 2013. Macroecology of pollination networks. Glob. Ecol. Biogeogr. 22, 149–162 10.1111/j.1466-8238.2012.00777.x (doi:10.1111/j.1466-8238.2012.00777.x) [DOI] [Google Scholar]
- 15.Lopezaraiza-Mikel ME, Hayes RB, Whalley MR, Memmott J. 2007. The impact of an alien plant on a native plant–pollinator network: an experimental approach. Ecol. Lett. 10, 539–550 10.1111/j.1461-0248.2007.01055.x (doi:10.1111/j.1461-0248.2007.01055.x) [DOI] [PubMed] [Google Scholar]
- 16.Padrón B, Traveset A, Biedenweg T, Díaz D, Nogales M, Olesen JM. 2009. Impact of alien plant invaders on pollination networks in two archipelagos. PLoS ONE 4, e6275. 10.1371/journal.pone.0006275 (doi:10.1371/journal.pone.0006275) [DOI] [PMC free article] [PubMed] [Google Scholar]
- 17.Tylianakis JM, Didham RK, Bascompte J, Wardle DA. 2008. Global change and species interactions in terrestrial ecosystems. Ecol. Lett. 11, 1351–1363 10.1111/j.1461-0248.2008.01250.x (doi:10.1111/j.1461-0248.2008.01250.x) [DOI] [PubMed] [Google Scholar]
- 18.Kaiser-Bunbury CN, Valentin T, Mougal J, Matatiken D, Ghazoul J. 2011. The tolerance of island plant–pollinator networks to alien plants. J. Ecol. 99, 202–213 10.1111/j.1365-2745.2010.01732.x (doi:10.1111/j.1365-2745.2010.01732.x) [DOI] [Google Scholar]
- 19.Heleno RH, Olesen JM, Nogales M, Vargas P, Traveset A. 2012. Seed dispersal networks in the Galápagos and the consequences of alien plant invasions. Proc. R. Soc. B 280, 20122112. 10.1098/rspb.2012.2112 (doi:10.1098/rspb.2012.2112) [DOI] [PMC free article] [PubMed] [Google Scholar]
- 20.Tylianakis JM, Laliberté E, Nielsen A, Bascompte J. 2010. Conservation of species interaction networks. Biol. Conserv. 143, 2270–2279 10.1016/j.biocon.2009.12.004 (doi:10.1016/j.biocon.2009.12.004) [DOI] [Google Scholar]
- 21.Hoehn P, Tscharntke T, Tylianakis JM, Steffan-Dewenter I. 2008. Functional group diversity of bee pollinators increases crop yield. Proc. R. Soc. B 275, 2283–2291 10.1098/rspb.2008.0405 (doi:10.1098/rspb.2008.0405) [DOI] [PMC free article] [PubMed] [Google Scholar]
- 22.Valdovinos FS, Ramos-Jiliberto R, Flores JD, Espinoza C, López G. 2009. Structure and dynamics of pollination networks: the role of alien plants. Oikos 118, 1190–1200 10.1111/j.1600-0706.2009.17364.x (doi:10.1111/j.1600-0706.2009.17364.x) [DOI] [Google Scholar]
- 23.Aizen MA, Morales CL, Morales JM. 2008. Invasive mutualists erode native pollination webs. PLoS Biol. 6, 396–403 10.1371/journal.pbio.0060031 (doi:10.1371/journal.pbio.0060031) [DOI] [PMC free article] [PubMed] [Google Scholar]
- 24.Rooney N, McCann KS. 2012. Integrating food web diversity, structure and stability. Trends Ecol. Evol. 27, 40–46 10.1016/j.tree.2011.09.001 (doi:10.1016/j.tree.2011.09.001) [DOI] [PubMed] [Google Scholar]
- 25.Santos GM, Aguiar CML, Genini J, Martins CF, Zanella FCV, Mello MAR. 2012. Invasive Africanized honeybees change the structure of native pollination networks in Brazil. Biol. Inv. 14, 2369–2378 10.1007/s10530-012-0235-8 (doi:10.1007/s10530-012-0235-8) [DOI] [Google Scholar]
- 26.Bascompte J, Jordano P, Olesen JM. 2006. Asymmetric coevolutionary networks facilitate biodiversity maintenance. Science 312, 431–433 10.1126/science.1123412 (doi:10.1126/science.1123412) [DOI] [PubMed] [Google Scholar]
- 27.Bastolla U, Fortuna MA, Pascual-García A, Ferrera A, Luque B, Bascompte J. 2009. The architecture of mutualistic networks minimizes competition and increases biodiversity. Nature 458, 1018–1021 10.1038/nature07950 (doi:10.1038/nature07950) [DOI] [PubMed] [Google Scholar]
- 28.Tylianakis JM. 2008. Understanding the web of life: The birds, the bees, and sex with aliens. PloS Biol. 6, e47. 10.1371/journal.pbio.0060047 (doi:10.1371/journal.pbio.0060047) [DOI] [PMC free article] [PubMed] [Google Scholar]
- 29.Guézou A, et al. 2010. An extensive alien plant inventory from the inhabited areas of Galapagos. PLoS ONE 5, e10276. 10.1371/journal.pone.0010276 (doi:10.1371/journal.pone.0010276) [DOI] [PMC free article] [PubMed] [Google Scholar]
- 30.Jaramillo P, Guézou A, Mauchamp A, Tye A. 2012. CDF checklist of Galapagos flowering plants. In Charles Darwin Foundation Galapagos Species Checklist (eds Bungartz F, Herrera H, Jaramillo P, Tirado N, Jímenez-Uzcategui G, Ruiz D, Guézou A, Ziemmeck F.). Puerto Ayora, Galapagos: Charles Darwin Foundation; See http://checklists.datazone.darwinfoundation.org/ [Google Scholar]
- 31.Herrera HW, Roque-Albelo L. 2012. CDF Checklist of Galapagos terrestrial invertebrates—FCD Lista de especies de invertebrados terrestres de Galápagos. In Charles Darwin Foundation Galapagos Species Checklist—Lista de Especies de Galápagos de la Fundación Charles Darwin (eds Bungartz F, Herrera H, Jaramillo P, Tirado N, Jiménez-Uzcátegui G, Ruiz D, Guézou A, Ziemmeck F.). Puerto Ayora, Galapagos: Charles Darwin Foundation/Fundación Charles Darwin; See http://checklists.datazone.darwinfoundation.org/terrestrial-invertebrates/ (accessed 29 May 2012) [Google Scholar]
- 32.Poulakakis N, Russello M, Geist D, Caccone A. 2012. Unravelling the peculiarities of island life: vicariance, dispersal and the diversification of the extinct and extant giant Galápagos tortoises. Mol. Ecol. 21, 160–173 10.1111/j.1365-294X.2011.05370.x (doi:10.1111/j.1365-294X.2011.05370.x) [DOI] [PubMed] [Google Scholar]
- 33.Chamorro S, Heleno R, Olesen JM, McMullen CK, Traveset A. 2012. Pollination patterns and plant breeding systems in the Galápagos: a review. Ann. Bot. 110, 1489–1501 10.1093/aob/mcs132 (doi:10.1093/aob/mcs132) [DOI] [PMC free article] [PubMed] [Google Scholar]
- 34.Philipp M, Böcher J, Siegismund HR, Nielsen LR. 2006. Structure of a plant-pollinator network on a pahoehoe lava desert of the Galápagos Islands. Ecography 29, 531–540 10.1111/j.0906-7590.2006.04546.x (doi:10.1111/j.0906-7590.2006.04546.x) [DOI] [Google Scholar]
- 35.Castro-Urgal R, Tur C, Albrecht M, Traveset A. 2012. How different link weights affect the structure of quantitative flower–visitation networks. Basic Appl. Ecol. 13, 500–508 10.1016/j.baae.2012.08.002 (doi:10.1016/j.baae.2012.08.002) [DOI] [Google Scholar]
- 36.Dormann CF, Fründ J, Blüthgen N, Gruber B. 2009. Indices, graphs and null models: analyzing bipartite ecological networks. Open J. Ecol. 2, 7–24 10.2174/1874213000902010007 (doi:10.2174/1874213000902010007) [DOI] [Google Scholar]
- 37.Ulrich W, Almeida-Neto M, Gotelli NJ. 2009. A consumer's guide to nestedness analysis. Oikos 118, 3–17 10.1111/j.1600-0706.2008.17053.x (doi:10.1111/j.1600-0706.2008.17053.x) [DOI] [Google Scholar]
- 38.Guimerà R, Amaral LA. 2005. Functional cartography of complex metabolic networks. Nature 433, 890–900 [DOI] [PMC free article] [PubMed] [Google Scholar]
- 39.Olesen JM, Bascompte J, Dupont YL, Jordano P. 2007. The modularity of pollination networks. Proc. Natl Acad. Sci. USA 104, 19 891–19 896 10.1073/pnas.0706375104 (doi:10.1073/pnas.0706375104) [DOI] [PMC free article] [PubMed] [Google Scholar]
- 40.Olesen JM, Jordano P. 2002. Geographic patterns in plant-pollinator mutualistic network. Ecology 83, 2416–2424 [Google Scholar]
- 41.Bosch J, Martín-González AM, Rodrigo A, Navarro D. 2009. Plant–pollinator networks: adding the pollinator's perspective. Ecol. Lett. 12, 409–419 10.1111/j.1461-0248.2009.01296.x (doi:10.1111/j.1461-0248.2009.01296.x) [DOI] [PubMed] [Google Scholar]
- 42.Alarcón R. 2010. Congruence between visitation and pollen-transport networks in a California plant pollinator community. Oikos 119, 35–44 10.1111/j.1600-0706.2009.17694.x (doi:10.1111/j.1600-0706.2009.17694.x) [DOI] [Google Scholar]
- 43.Morales C, Traveset A. 2009. A meta-analysis of impacts of alien versus native plants on pollinator visitation and reproductive success of co-flowering native plants. Ecol. Lett. 12, 716–728 10.1111/j.1461-0248.2009.01319.x (doi:10.1111/j.1461-0248.2009.01319.x) [DOI] [PubMed] [Google Scholar]
- 44.Heleno R, Devoto M, Pocock M. 2012. Connectance of species interaction networks and conservation value: is it any good to be well connected? Ecol. Ind. 14, 7–10 (doi:10.1016/j.ecolind.2011.06.032) [Google Scholar]
- 45.Guimaraes PR, Jr, Jordano P, Thompson JN. 2011. Evolution and coevolution in mutualistic networks. Ecol. Lett. 14, 877–885 10.1111/j.1461-0248.2011.01649.x (doi:10.1111/j.1461-0248.2011.01649.x) [DOI] [PubMed] [Google Scholar]
- 46.Barnosky AD, et al. 2012. Approaching a state shift in Earth's biosphere. Nature 486, 52–58 10.1038/nature11018 (doi:10.1038/nature11018) [DOI] [PubMed] [Google Scholar]