

Abstract
Previous research has identified morphological differences between the brains of Neanderthals and anatomically modern humans (AMHs). However, studies using endocasts or the cranium itself are limited to investigating external surface features and the overall size and shape of the brain. A complementary approach uses comparative primate data to estimate the size of internal brain areas. Previous attempts to do this have generally assumed that identical total brain volumes imply identical internal organization. Here, we argue that, in the case of Neanderthals and AMHs, differences in the size of the body and visual system imply differences in organization between the same-sized brains of these two taxa. We show that Neanderthals had significantly larger visual systems than contemporary AMHs (indexed by orbital volume) and that when this, along with their greater body mass, is taken into account, Neanderthals have significantly smaller adjusted endocranial capacities than contemporary AMHs. We discuss possible implications of differing brain organization in terms of social cognition, and consider these in the context of differing abilities to cope with fluctuating resources and cultural maintenance.
Keywords: Neanderthals, brain's orbits, body mass, social cognition
1. Introduction
Comparisons of the morphology of Neanderthal and anatomically modern human (AMH) brains have previously identified a number of similarities, for example, in the degree of asymmetry and gyrification [1], as well as non-allometric widening of the frontal lobes [2]. However, differences in brain morphology have also been noted. For instance, in addition to their uniquely globular brain shape [3], it has recently been reported that the temporal pole is relatively larger and more forward-projecting, the orbitofrontal cortex being relatively wider and the olfactory bulbs being larger in AMHs compared with other hominins, including Neanderthals [4]. In addition, Neanderthals show lateral widening but overall flattening of their parietal lobes, whereas AMHs have uniform parietal surface enlargement [5]. These differences have led to the suggestion that Neanderthals and AMHs reached similarly enlarged brains along divergent developmental [3] and evolutionary [6] pathways.
Most of the work on Neanderthal and fossil AMH brains has relied on endocasts and the internal morphology of the cranium. However, this approach is limited to investigating external surface features and the overall shape and size of the brain, and provides no information about internal brain organization. For instance, identification of the lunate sulcus on endocast surfaces is highly ambiguous, making the size of the primary visual area (V1) difficult to measure from endocasts. An alternative approach has been to use known relationships between overall brain volume and the volume of specific brain areas in extant primates to estimate the respective brain region volumes in fossil crania [7]. While this approach is broadly reliable, it does assume that identical overall brain volumes imply identical brain organization. Although there are conserved patterns of scaling in brain organization across mammals [7,8], this is not always the case: the size of the visual system, for example, varies independently of the size of other sensory systems [9,10]. More importantly, there are well-known examples among primates where mosaic brain evolution has resulted in brain regions that are significantly smaller or larger than would be predicted by overall brain size alone. Among the great apes, for instance, gorillas and orang-utans have unusually large cerebella and relatively small neocortices [11]. Assuming that similar endocranial volumes equate with identical organization within the brain may be seriously misleading.
We hypothesize that the similarly sized brains of Neanderthals and AMHs were organized differently for at least two reasons. First, Neanderthals had larger bodies than AMHs and, hence, they would have required proportionately more neural matter for somatic maintenance and control [1,12]. Second, Neanderthals lived at high latitudes, where they would have experienced lower light levels than tropical hominins. Since even recent humans living at high latitudes require larger eyeballs to attain the same level of visual acuity and/or sensitivity as individuals living at lower latitudes [13], Neanderthals would probably have had larger eyes than contemporary AMHs, who had only recently emerged from low-latitude Africa. Components of the visual system scale with each other, from orbits and eyes [14,15] (contra [16]) through to the cortical primary (V1) and downstream visual areas (V2, V3 and V5/MT) in the brain [9,15,17–22]. This means that if Neanderthals had larger eyes than AMHs, they would also have had larger visual cortices. For a meaningful comparison of brain volume, fossil brains need to be adjusted for at least these two effects.
Here, we first show, using orbit size as a proxy [13,15], that Neanderthals had larger visual systems than contemporary AMHs. We then examine the implications of this and the difference in body size for the brains of these taxa.
2. Material and methods
We used endocast volumes for 21 Neanderthals and 38 AMHs dated 27–200 ka [23] (see the electronic supplementary material, table S1). We excluded AMHs younger than 27 ka so that the AMH specimens were as close in time to the Neanderthal specimens as possible. We excluded from the analyses specimens dated earlier than 200 ka as being taxonomically arguable, but include them for reference in figure 1. Using alternative cranial volume databases [24,25] produces essentially the same results, indicating that our findings are robust to discrepancies in volume determinations. However, we present only the analyses using the endocast dataset here.
Figure 1.

(a) Absolute and (b) standardized endocranial volumes for different hominin taxa, split into date groups (given in thousands of years ago: ka). The three boxes represent (i) Homo heidelbergensis (Hh) and possible Denisovans (?D), (ii) the Neanderthal lineage, from archaics (AHn) to Neanderthals (Hn) dated 76–200 ka and 27–75 ka, and (iii) the Homo sapiens lineage, from archaics (AHs) to AMHs (Hs) dated 76–200 ka and 27–75 ka. Circles indicate the value for each individual fossil specimen. The horizontal bars show group means ± the s.e.m. (cumulative for b). The light grey shading illustrates that Neanderthals dated 27–75 ka have the same sized brains as Homo sapiens in terms of absolute endocranial volumes, but that once body and visual system sizes are taken into account, the Neanderthal means lie outside the standard errors of the AMH means. The dashed lines in (b) illustrate the AMH means for both date groups, to ease comparison with the Neanderthal means.
In order to standardize the AMH and Neanderthal endocranial volumes in terms of body mass, we calculated the ratio between living human and fossil mean body masses for each of the fossil date groups in a study by Ruff et al. [26] and use this ratio to scale for body size. We multiplied the absolute brain volume of each fossil in our endocast dataset [23] by this date-group-specific body mass correction factor to give the equivalent endocranial volume expected for a living human. Since the relationship between brain and body size is not isometric, we used body mass raised to the 0.646 power in this calculation, which Isler et al. [27] report as the common slope for ln-transformed endocranial volume regressed on body mass across primates once grades are taken into account.
Orbital areas were from Kappelman [28], orbital height (OBH) and breadth (OBB) measurements were supplied by C.S., and orbital volumes were measured by E.P. (see [13] for more details of the volume method). Volumes did not include brow-ridges, since the orbits were filled with beads up to a line continuous with the lateral and medial rims, following Schultz [14]. In any case, brow-ridge size is not related to orbital volume across primates [29].
We calculated visual cortex corrections using a number of computational steps, which we summarize before giving details below. Insufficient volumetric data are available for primate visual areas beyond V1 to produce an equation relating orbital size directly to total visual cortex volume. Instead, we (i) estimated fossil visual cortical surface areas from OBH (the measurement for which we had most fossil data) using a primate-derived equation, and (ii) converted these into volumes by multiplying by cortex depth. We calculated this depth by (iii) assuming a 2 mm thickness for grey matter (i.e. multiplying the surface area in mm2 by 2 mm to give volume in mm3; details below) and (iv) using a primate equation to estimate white matter volume from grey matter volume. We then (v) totalled grey and white matter volumes to give ‘total’ visual cortex volume.
In order to estimate total visual surface area from orbit diameter in the fossils, we conducted a cross-primate comparison by fitting a phylogenetically controlled generalized linear model (PGLM) using the pgls function of the caper package [30] in R to log10 visual cortex surface area (V1 and V2 from [31]) plotted against log10 orbital diameter [32,33] for five diurnal anthropoid primate species for which overlapping data were available: Homo sapiens, Macaca mulatta, Saguinus fuscicollis, Saimiri sciureus and Callithrix jacchus. We used the consensus chronogram tree from the 10k Trees Project website [34]. The PGLM analysis yielded a significant positive linear relationship between log10 orbital diameter (mm) and log10 ‘total’ visual cortex (represented by V1 and V2) surface area (mm2) independently of phylogeny: t3 = 10.137, p = 0.002, adjusted R2 = 0.962, log10 total visual SA =−1.89 (95% CIs: −3.506 to −0.28) + 4.25 (95% CIs: −2.914 to 5.58) × log10 orbit diameter.
Since total visual cortical surface area data were only available for five genera, we also present the results of a PGLM fitted to log10 primary (as opposed to total) visual cortex (V1) volume [35] plotted against log10 orbit diameter [32,33] for 15 diurnal anthropoids, to confirm that orbital dimensions provide a good proxy for visual cortical size in larger samples as well. The PGLM fitted to log10 V1 volume plotted against log10 orbital diameter revealed a significant relationship independently of phylogeny: t13 = 8.412, p = 1.286e−05, adjusted R2 = 0.833, log10 V1 = 0.54 (95% CIs: −0.25 to 1.34) + 2.38 (95% CIs: 1.77 to 2.99) × log10 orbit diameter.
We used OBH to estimate the total visual surface area for each individual fossil in the endocast volume dataset for which C.S. provided data, and converted these surfaces into total combined grey and white matter volumes. First, we calculated total grey matter volume by multiplying the surface area estimates by 2 mm, which is a reasonable estimate of cortical grey matter thickness in both humans [36–38] and macaques [38]. We then estimated white matter volume (cm3) from grey matter volume (cm3) using a reduced major axis (RMA) regression equation, using anthropoid primate neocortical data from [39]: t19 = 56.28, p < 0.001, r2 = 0.994 log10 white =−0.81 (95% CI: −0.72 to −0.93) + 1.32 (95% CI: 1.24 to 1.43) × log10 grey. These parameters do not fall outside the 95% confidence intervals of those associated with a PGLM regression model using a tree from the 10k Trees Project. However, we chose to use the RMA model because this is more appropriate when there is measurement error on both axes and the relationship between variables is symmetrical [40]. Finally, we summed the estimated white matter volumes with the grey matter volume estimates to get total visual cortex volume.
Once we had total visual cortex volume estimates for each fossil, we calculated the residual to the AMH mean for each date group for each Neanderthal fossil. We also calculated the difference between the species’ means in each date group (27–75 ka, 118 cm3; 76–200 ka, 59 cm3).
After correcting for body mass differences as outlined above, we standardized the Neanderthal endocranial volumes by subtracting the difference in visual cortex volume between AMHs and Neanderthals (individual residuals or differences between date-specific means where OBH was unavailable) from the respective Neanderthal values. In other words, all Neanderthal endocranial volumes were recalibrated as if they were organized in the same way as the average AMH brain (i.e. without enlarged visual cortices), while also taking individual differences within the Neanderthal species into account as far as possible.
The computation of these standardized brain volumes requires a series of steps, which each introduce error into the subsequent estimates. In this study, we are interested in comparisons between taxon means: rather than being interested in the error accrued for the standardized brain estimate for each individual specimen, what is crucial is the compounded error attached to the calculated mean per taxon group. In other words, the central issue is the parameter (taxon variance) error rather than the population error. We therefore calculated the cumulative standard error of the mean standardized endocranial volume for each taxon/date group by taking, at each computational step, not only the mean estimate but also the mean estimate plus or minus the standard error (s.e.; for means) or standard error of the estimate (s.e.e. for regressions, following Ruff et al. [41]). We then took these three values—(i) mean estimate, (ii) mean estimate plus s.e./s.e.e. (iii) mean estimate minus s.e./s.e.e.—into the next step of the estimation process. Once we had calculated the standardized endocranial volumes, we then calculated the sample mean for the mean, upper (cumulative ‘mean plus s.e./s.e.e.’ estimates) and lower (cumulative ‘mean minus s.e./s.e.e.’ estimates) estimates for each of the taxon and date group subgroups of specimens. The means of the upper and lower estimates for the sample were taken as values representing the mean ± the cumulative s.e. We plot these cumulative standard error bars in figure 1b.
One-sample Kolmogorov–Smirnov tests with Lilliefors corrections found no deviations from normality for any variables. Effect sizes are reported as R2.
3. Results
Independent-sample t-tests applied to three different datasets confirmed that Neanderthals had significantly larger orbits than contemporary AMHs (table 1). This implies that Neanderthals also had significantly larger eyeballs and visual cortices.
Table 1.
Orbital dimensions compared between anatomically modern humans (AMHs) and Neanderthals from all date groups.
| Neanderthals |
AMHs |
independent t-test (two-tailed) |
|||||||
|---|---|---|---|---|---|---|---|---|---|
| mean | s.d. | n | mean | s.d. | n | t | p-value | R2 | |
| orbital area (mm2) | 1403.98 | 94.24 | 6 | 1223.39 | 130.00 | 10 | 2.952 | 0.011 | 0.38 |
| orbital height (mm) | 36.41 | 1.11 | 12 | 30.63 | 2.59 | 15 | 7.777a | <0.0001 | 0.71 |
| orbital breadth (mm) | 44.07 | 2.19 | 11 | 41.80 | 2.78 | 15 | 2.245 | 0.034 | 0.17 |
| orbital volume (cm3) | 34.15 | 3.39 | 5 | 29.51 | 2.07 | 4 | 2.387 | 0.048 | 0.45 |
aCorrected for unequal variances.
Independent-sample t-tests found no significant difference in raw/absolute endocranial volume between AMHs and Neanderthals dated 27–75 ka (figure 1a and table 2). However, older AMHs dated 76–200 ka had significantly larger endocranial volumes than Neanderthals of a similar date (table 2). Neanderthals dated to 27–75 ka had significantly larger endocranial volumes than those dated 76–200 ka (two-tailed independent-sample t-test, corrected for unequal variances: t17.687 = 3.513, p = 0.003, R2 = 0.411).
Table 2.
Independent-sample t-test statistics for comparisons between AMHs and Neanderthals for raw and standardized endocranial volume, split by date group.
| date groups (ka) | endocranial volume variables (cm3) |
taxon |
t-test (two-tailed) |
||||
|---|---|---|---|---|---|---|---|
| AMHs | Neanderthals | t | p-value | R2 | |||
| 27–75 | absolute endocranial volume | n | 32 | 13 | 0.008 | 0.994 | n.a. |
| mean | 1473.84 | 1473.46 | |||||
| s.d. | 135.96 | 180.61 | |||||
| corrected endocranial volume | n | 32 | 13 | 4.439 | <0.0001 | 0.31 | |
| mean | 1332.41 | 1133.98 | |||||
| s.d. | 126.45 | 157.76 | |||||
| 76–200 | absolute endocranial volume | n | 6 | 8 | 7.169 | <0.0001 | 0.81 |
| mean | 1535.50 | 1272.00 | |||||
| s.d. | 48.87 | 78.96 | |||||
| corrected endocranial volume | n | 6 | 8 | 8.451 | <0.0001 | 0.86 | |
| mean | 1405.11 | 1097.47 | |||||
| s.d. | 48.39 | 78.207 | |||||
Comparison of ‘corrected’ or ‘standardized’ endocranial volumes shows that adjusting for differences in body and visual system size results in the disparity between the two Neanderthal date groups disappearing (figure 1b). In effect, the younger Neanderthals (27–75 ka) show no increase in non-somatic/non-visual brain size compared with the older Neanderthals (76–200 ka) and archaic humans. These younger ‘standardized’ Neanderthal endocranial volumes are significantly smaller than those of contemporary AMHs within the 27–75 ka date group (table 2). This suggests that later Neanderthal brains comprised a significantly larger proportion of neural tissue associated with somatic and visual function compared with the brains of contemporary AMHs.
In the 27–75 ka date group, the mean standardized Neanderthal endocranial volume (mean = 1134, 95% CIs = 1037–1231, n = 13) lies outside the 95% CIs of the mean endocranial volume of recently living humans (mean = 1373, 95% CIs = 1335–1410, n = 55 living in the last approx. 200 years; data from [13]). By contrast, the 95% CI of the fossil AMH mean (mean = 1332, 95% CIs = 1287–1377, n = 32) overlaps that of recently living humans.
4. Discussion
We have demonstrated that Neanderthals had significantly larger orbits than contemporary AMHs, which, owing to scaling between the components of the visual system, suggests that Neanderthal brains contained significantly larger visual cortices. This is corroborated by recent endocast work, which found that Neanderthal occipital lobes are relatively larger than those of AMHs [42]. In addition, previous suggestions that large Neanderthal brains were associated with their high lean body mass [1,43,44] imply that Neanderthal also invested more neural tissue in somatic areas involved in body maintenance and control compared with those of contemporary AMHs.
In recent humans (dated to the last approx. 200 years), larger visual systems translate into larger brains [13]. We might therefore expect that larger Neanderthal visual cortices (and somatic areas) would similarly drive overall brain enlargement in this taxon compared with AMHs. However, we have shown that this is not the case for specimens dated 27–75 ka; Neanderthals in this date group do not show significantly larger brains than contemporary AMHs. This suggests that (i) Neanderthal and AMH brains were organized differently, and, (ii) by implication, because a greater proportion of the overall brain tissue in Neanderthals was invested in visual and somatic systems, proportionally less neural tissue was left over for other brain areas in Neanderthals compared with AMHs. Note that our analysis considered only the principal visual areas in the occipital lobe: given that the visual system projects through the parietal and temporal to the frontal lobes, our case could only be strengthened if comparative data on these projection areas were available and could be included in the analysis.
Overall, our findings tie in with the suggestion that the Neanderthal and AMH lineages underwent separate evolutionary trajectories [6]. Starting from the brain size of their common ancestor Homo heidelbergensis, we suggest that Neanderthals enlarged their visual and somatic regions, whereas AMHs achieved similarly large brains by increasing other brain areas (including, for example, their parietal lobes) [5]. Furthermore, it seems that the Neanderthal route followed a more strictly allometric trajectory [6]. Human primary visual areas are smaller than expected for a primate of our brain size [45]; larger Neanderthal V1s may thus be more in line with the expectations for a generic large-brained primate, adding support to this argument.
Macroscopic measures such as regional volume index neural network characteristics such as the number of neurons and synapses [17,46,47]. Consequently, the differences in the partitioning of brain tissue might have substantial implications for cognitive processing in Neanderthals compared with contemporary AMHs. For instance, there is a well-established relationship between brain and bonded group size across anthropoid primates [48–57], as well as between specific areas of the frontal lobe and active social network (total number of personal contacts) size at the within-species individual level in both macaques [58] and, more importantly, humans [59–61]. In addition, neuroimaging studies have shown that this relationship between key brain region volumes and group size is mediated by mentalizing (theory of mind) competences [42]. In humans, the total network/group size comprises a number of nested layers [62] and the greatest number of minds an individual can keep track of at any one time constrains the size of their most intimate support clique [63], which in turn sets a limit on the overall group size that they can maintain [62,64–66]. The mean size of the active network for living humans predicted by cross-primate neocortex ratio comparisons has been corroborated across not only historical and modern traditional subsistence societies, but also in online social environments [54,67,68]. This suggests that throughout human evolution, brain structure and cognitive function have placed a constraint on bonded group size and social complexity.
While we cannot partition fossil brains down to the refinement of specific frontal regions, there is at least sufficient evidence from comparative studies of primates [69–71] to justify using whole brain volumes to estimate cognitive capacities as a first step. To do so, we followed Dunbar [54] in using an ape PGLM equation to predict group size from the standardized endocranial volumes. Note that this equation predicts a group size of approximately 144 for living humans rather than the 150 predicted by neocortex ratio, because using cranial volumes results in additional estimation error by including brain regions, such as the visual system, that are not part of the social or mentalizing network [11], and this results in a shallower slope. However, we use cranial volume here because it reduces the number of interpolation steps, and so reduces the cumulative error variance on the fossil estimates.
Neanderthals dated 27–75 ka were predicted to have had smaller cognitive group sizes (M = 115, s.d. = 19, n = 13) than contemporary fossil AMHs, whereas fossil AMHs (M = 139, s.d. = 15, n = 32) seem to have had group sizes more in line with those demonstrated for the mean personal network sizes of living humans (figure 2). What little archaeological evidence there is offers support for this: compared with Neanderthals, contemporary Eurasian AMHs had larger [72], more geographically extensive social networks [73,74]. Group size is a convenient index of the cognitive ability to deal with increasing social complexity and may thus evidence more general differences in sociocognitive abilities between these taxa.
Figure 2.
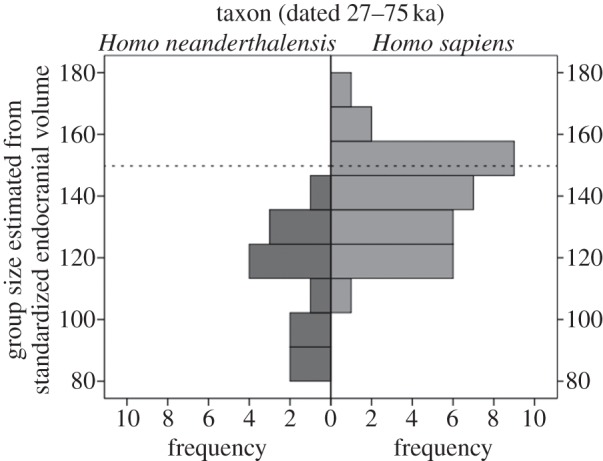
Group sizes estimated from standardized endocranial volumes for Neanderthals and AMHs in the 27–75 ka date group. The dashed line indicates the mean group size expected for living humans based on the size of their neocortex (150 individuals).
Such differences may have had profound implications for Neanderthals. First, assuming similar densities, the area covered by the Neanderthals' extended communities would have been smaller than those of AMHs. Consequently, the Neanderthals' ability to trade for exotic resources and artefacts would have been reduced [75], as would their capacity to gain access to foraging areas sufficiently distant to be unaffected by local scarcity [76]. Furthermore, their ability to acquire and conserve innovations may have been limited as a result [77], and they may have been more vulnerable to demographic fluctuations, causing local population extinctions.
Whereas AMHs appear to have concentrated neural investment in social adaptations to solve ecological problems, Neanderthals seem to have adopted an alternative strategy that involved enhanced vision coupled with retention of the physical robusticity of H. heidelbergensis, but not superior social cognition. For instance, only in Neanderthals, not AMHs, does body mass [26], and hence brain volume [78], increase over time. While the physical response to high latitude conditions adopted by Neanderthals may have been very effective at first, the social response developed by AMHs seems to have eventually won out in the face of the climatic instability that characterized high-latitude Eurasia at this time.
Acknowledgements
We would like to thank Kit Opie and Susanne Shultz for useful comments throughout this work, Tim Holden for mathematical advice, Anna Frangou and Thomas Woolley for coding advice, and the Oxford Museum of Natural History, Duckworth Collection (University of Cambridge) and London Museum of Natural History for allowing access to their collections. The research was funded by the Boise Fund, University of Oxford and the British Academy Lucy to Language Project. C.S. is a member of the Ancient Human Occupation of Britain Project, funded by the Leverhulme Trust, and his research is supported by the Human Origins Research Fund and the Calleva Foundation. R.I.M.D. and E.P. are funded by a European Research Council Advanced grant.
References
- 1.Holloway RL. 1981. Volumetric and asymmetry determinations on recent hominid endocasts: Spy I and II, Djebel Ihroud I, and the Sale Homo erectus specimens, with some notes on Neanderthal brain size. Am. J. Phys. Anthropol. 55, 385–393 10.1002/ajpa.1330550312 (doi:10.1002/ajpa.1330550312) [DOI] [PubMed] [Google Scholar]
- 2.Bruner E, Holloway RL. 2010. A bivariate approach to the widening of the frontal lobes in the genus Homo. J. Hum. Evol. 58, 138–146 10.1016/j.jhevol.2009.10.005 (doi:10.1016/j.jhevol.2009.10.005) [DOI] [PubMed] [Google Scholar]
- 3.Gunz P, Neubauer S, Golovanova L, Doronichev V, Maureille B, Hublin J-J. 2012. A uniquely modern human pattern of endocranial development. Insights from a new cranial reconstruction of the Neandertal newborn from Mezmaiskaya. J. Hum. Evol. 62, 300–313 10.1016/j.jhevol.2011.11.013 (doi:10.1016/j.jhevol.2011.11.013) [DOI] [PubMed] [Google Scholar]
- 4.Bastir M, Rosas A, Gunz P, Pena-Melian A, Manzi G, Harvati K, Kruszynski R, Stringer C, Hublin J-J. 2011. Evolution of the base of the brain in highly encephalized human species. Nat. Commun. 2, 588. 10.1038/ncomms1593 (doi:10.1038/ncomms1593) [DOI] [PubMed] [Google Scholar]
- 5.Bruner E. 2010. Morphological differences in the parietal lobes within the human genus: a neurofunctional perspective. Curr. Anthropol. 51, S77–S88 10.1086/650729 (doi:10.1086/650729) [DOI] [Google Scholar]
- 6.Bruner E, Manzi G, Arsuaga JL. 2003. Encephalization and allometric trajectories in the genus Homo: evidence from the Neandertal and modern lineages. Proc. Natl Acad. Sci. USA 100, 15 335–15 340 10.1073/pnas.2536671100 (doi:10.1073/pnas.2536671100) [DOI] [PMC free article] [PubMed] [Google Scholar]
- 7.Finlay B, Darlington R. 1995. Linked regularities in the development and evolution of mammalian brains. Science 268, 1578–1584 10.1126/science.7777856 (doi:10.1126/science.7777856) [DOI] [PubMed] [Google Scholar]
- 8.Finlay BL, Darlington RB, Nicastro N. 2001. Developmental structure in brain evolution. Behav. Brain Sci. 24, 263–308 10.1017/S0140525X01003958 (doi:10.1017/S0140525X01003958) [DOI] [PubMed] [Google Scholar]
- 9.Barton RA. 2007. Evolutionary specialization in mammalian cortical structure. J. Evol. Biol. 20, 1504–1511 10.1111/j.1420-9101.2007.01330.x (doi:10.1111/j.1420-9101.2007.01330.x) [DOI] [PubMed] [Google Scholar]
- 10.Barton RA. 2001. The coordinated structure of mosaic brain evolution. Behav. Brain Sci. 24, 281–282 10.1017/S0140525X01253953 (doi:10.1017/S0140525X01253953) [DOI] [Google Scholar]
- 11.Dunbar RIM. 2011. Evolutionary basis of the social brain. In Oxford handbook of social neuroscience (eds Decety J, Cacioppo JT.), pp. 28–38 Oxford, UK: Oxford University Press [Google Scholar]
- 12.Jerison HJ. 1973. Evolution of the brain and intelligence. London, UK: Academic Press [Google Scholar]
- 13.Pearce E, Dunbar R. 2012. Latitudinal variation in light levels drives human visual system size. Biol. Lett. 8, 90–93 10.1098/rsbl.2011.0570 (doi:10.1098/rsbl.2011.0570) [DOI] [PMC free article] [PubMed] [Google Scholar]
- 14.Schultz A. 1940. The size of the orbit and of the eye in primates. Am. J. Phys. Anthropol. 26, 389–408 10.1002/ajpa.1330260138 (doi:10.1002/ajpa.1330260138) [DOI] [Google Scholar]
- 15.Pearce E, Bridge H. Does orbital volume index eyeball and visual cortical volumes within humans? Submitted. [Google Scholar]
- 16.Chau A, Fung K, Pak K, Yap M. 2004. Is eye size related to orbit size in human subjects? Ophthal. Physiol. Opt. 24, 35–40 (doi:10.1046/j.1475-1313.2003.00159.x) [DOI] [PubMed] [Google Scholar]
- 17.Andrews TJ, Halpern SD, Purves D. 1997. Correlated size variations in human visual cortex, lateral geniculate nucleus, and optic tract. J. Neurosci. 17, 2859–2868 [DOI] [PMC free article] [PubMed] [Google Scholar]
- 18.Dougherty RF, Koch VM, Brewer AA, Fischer B, Modersitzki J, Wandell BA. 2003. Visual field representations and locations of visual areas V1/2/3 in human visual cortex. J. Vis. 3, 586–598 10.1167/3.10.1 (doi:10.1167/3.10.1) [DOI] [PubMed] [Google Scholar]
- 19.Zhong N, Li K, Lu S, Chen L, Yan T, Jin F, Wu J. 2009. Correlated size variations measured in human visual cortex V1/V2/V3 with functional MRI. Brain Inform. 5819, 36–44 10.1007/978-3-642-04954-5_14 (doi:10.1007/978-3-642-04954-5_14) [DOI] [Google Scholar]
- 20.Barton RA, Harvey PH. 2000. Mosaic evolution of brain structure in mammals. Nature 405, 1055–1058 10.1038/35016580 (doi:10.1038/35016580) [DOI] [PubMed] [Google Scholar]
- 21.Barton RA. 1998. Visual specialization and brain evolution in primates. Proc. R. Soc. Lond. B 265, 1933–1937 10.1098/rspb.1998.0523 (doi:10.1098/rspb.1998.0523) [DOI] [PMC free article] [PubMed] [Google Scholar]
- 22.Stevens CF. 2001. An evolutionary scaling law for the primate visual system and its basis in cortical function. Nature 411, 193–195 10.1038/35075572 (doi:10.1038/35075572) [DOI] [PubMed] [Google Scholar]
- 23.Holloway RL, Broadfield DC, Yuan MS. 2004. The human fossil record: brain endocasts: the paleoneurological evidence. New York, NY: Wiley [Google Scholar]
- 24.De Miguel C, Henneberg M. 2001. Variation in hominid brain size: how much is due to method? HOMO J. Comp. Hum. Biol. 52, 3–58 10.1078/0018-442X-00019 (doi:10.1078/0018-442X-00019) [DOI] [PubMed] [Google Scholar]
- 25.Bailey D, Geary D. 2009. Hominid brain evolution. Hum. Nat. 20, 67–79 10.1007/s12110-008-9054-0 (doi:10.1007/s12110-008-9054-0) [DOI] [Google Scholar]
- 26.Ruff CB, Trinkaus E, Holliday TW. 1997. Body mass and encephalization in Pleistocene Homo. Nature 387, 173–176 10.1038/387173a0 (doi:10.1038/387173a0) [DOI] [PubMed] [Google Scholar]
- 27.Isler K, Kirk EC, Miller JMA, Albrecht GA, Gelvin BR, Martin RD. 2008. Endocranial volumes of primate species: scaling analyses using a comprehensive and reliable data set. J. Hum. Evol. 55, 967–978 10.1016/j.jhevol.2008.08.004 (doi:10.1016/j.jhevol.2008.08.004) [DOI] [PubMed] [Google Scholar]
- 28.Kappelman J. 1996. The evolution of body mass and relative brain size in fossil hominids. J. Hum. Evol. 30, 243–276 10.1006/jhev.1996.0021 (doi:10.1006/jhev.1996.0021) [DOI] [Google Scholar]
- 29.Ravosa MJ. 1991. Interspecific perspective on mechanical and nonmechanical models of primate circumorbital morphology. Am. J. Phys. Anthropol. 86, 369–396 10.1002/ajpa.1330860305 (doi:10.1002/ajpa.1330860305) [DOI] [PubMed] [Google Scholar]
- 30.Orme D. c. 2011 R-Forge: omparative analyses of phylogenetics and evolution in R. See http://cran.r-project.org/web/packages/caper/index.html . [Google Scholar]
- 31.Kaskan PM, Franco ECS, Yamada ES, de Lima Silveira LC, Darlington RB, Finlay BL. 2005. Peripheral variability and central constancy in mammalian visual system evolution. Proc. R. Soc. B 272, 91–100 10.1098/rspb.2004.2925 (doi:10.1098/rspb.2004.2925) [DOI] [PMC free article] [PubMed] [Google Scholar]
- 32.Kay RF, Kirk EC. 2000. Osteological evidence for the evolution of activity pattern and visual acuity in primates. Am. J. Phys. Anthropol. 113, 235–262 (doi:10.1002/1096-8644(200010)113:2<235::aid-ajpa7>3.0.co;2-9) [DOI] [PubMed] [Google Scholar]
- 33.Kirk EC. 2006. Effects of activity pattern on eye size and orbital aperture size in primates. J. Hum. Evol. 51, 159–170 10.1016/j.jhevol.2006.02.004 (doi:10.1016/j.jhevol.2006.02.004) [DOI] [PubMed] [Google Scholar]
- 34.Arnold CL, Matthews LJ, Nunn CL. 2010. The 10k Trees website: a new online resource for primate phylogeny. Evol. Anthropol. 19, 114–118 10.1002/evan.20251 (doi:10.1002/evan.20251) [DOI] [Google Scholar]
- 35.Stephan H, Frahm H, Baron G. 1981. New and revised data on volumes of brain structures in insectivores and primates. Folia Primatol. 35, 1–29 10.1159/000155963 (doi:10.1159/000155963) [DOI] [PubMed] [Google Scholar]
- 36.Lukatela K, Swadlow HA. 2004. Neocortex. In The corsini encyclopedia of psychology (eds Weiner IB, Craighead WE.), pp. 1070–1072, 3rd edn New York, NY: Wiley [Google Scholar]
- 37.Pakkenberg B, Gundersen HJG. 1997. Neocortical neuron number in humans: effect of sex and age. J. Comp. Neurol. 384, 312–320 (doi:10.1002/(sici)1096-9861(19970728)384:2<312::aid-cne10>3.0.co;2-k) [DOI] [PubMed] [Google Scholar]
- 38.Rockel AJ, Hiorns RW, Powell TPS. 1980. The basic uniformity of the neocortex. Brain 103, 221–244 10.1093/brain/103.2.221 (doi:10.1093/brain/103.2.221) [DOI] [PubMed] [Google Scholar]
- 39.Bush EC, Allman JM. 2003. Scaling of white matter to gray matter in cerebellum and neocortex. Brain Behav. Evol. 61, 1–5 10.1159/000068880 (doi:10.1159/000068880) [DOI] [PubMed] [Google Scholar]
- 40.Smith RJ. 2009. Use and misuse of the reduced major axis for line-fitting. Am. J. Phys. Anthropol. 140, 476–486 10.1002/ajpa.21090 (doi:10.1002/ajpa.21090) [DOI] [PubMed] [Google Scholar]
- 41.Ruff CB, Scott WW, Liu AYC. 1991. Articular and diaphyseal remodeling of the proximal femur with changes in body mass in adults. Am. J. Phys. Anthropol. 86, 397–413 10.1002/ajpa.1330860306 (doi:10.1002/ajpa.1330860306) [DOI] [PubMed] [Google Scholar]
- 42.Balzeau A, Holloway RL, Grimaud-Hervé D. 2012. Variations and asymmetries in regional brain surface in the genus Homo. J. Hum. Evol. 62, 696–706 10.1016/j.jhevol.2012.03.007 (doi:10.1016/j.jhevol.2012.03.007) [DOI] [PubMed] [Google Scholar]
- 43.Holloway RL. 1985. The poor brain of Homo sapiens neanderthalensis: see what you please. In Ancestors: The Hard Evidence (ed. Delson E.), pp. 319–324 New York, NY: Alan R Liss [Google Scholar]
- 44.Dubois EUG. 1933. The seeming and the real cephalization of the Australian aborigine. K. Akad. Wetensch. Amsterdam Proc. Sect. Sci. 36, 2–240 [Google Scholar]
- 45.de Sousa AA, Sherwood CC, Mohlberg H, Amunts K, Schleicher A, MacLeod CE, Hof PR, Frahm H, Zilles K. 2010. Hominoid visual brain structure volumes and the position of the lunate sulcus. J. Hum. Evol. 58, 281–292 10.1016/j.jhevol.2009.11.011 (doi:10.1016/j.jhevol.2009.11.011) [DOI] [PubMed] [Google Scholar]
- 46.Gabi M, Collins CE, Wong P, Torres LB, Kaas JH, Herculano-Houzel S. 2010. Cellular scaling rules for the brains of an extended number of primate species. Brain Behav. Evol. 76, 32–44 10.1159/000319872 (doi:10.1159/000319872) [DOI] [PMC free article] [PubMed] [Google Scholar]
- 47.Herculano-Houzel S, Collins C, Wong P, Kaas J. 2007. Cellular scaling rules for primate brains. Proc. Natl Acad. Sci. USA 204, 3562–3567 10.1073/pnas.0611396104 (doi:10.1073/pnas.0611396104) [DOI] [PMC free article] [PubMed] [Google Scholar]
- 48.Dunbar RIM. 2011. The social brain meets neuroimaging. Trends Cogn. Sci. 16, 101–102 10.1016/j.tics.2011.11.013 (doi:10.1016/j.tics.2011.11.013) [DOI] [PubMed] [Google Scholar]
- 49.Shultz S, Dunbar R. 2010. Encephalization is not a universal macroevolutionary phenomenon in mammals but is associated with sociality. Proc. Natl Acad. Sci. USA 107, 21 582–21 586 10.1073/pnas.1005246107 (doi:10.1073/pnas.1005246107) [DOI] [PMC free article] [PubMed] [Google Scholar]
- 50.Perez-Barberia F, Shultz S, Dunbar R. 2007. Evidence for coevolution of sociality and relative brain size in three orders of mammals. Evolution 61, 2811–2821 10.1111/j.1558-5646.2007.00229.x (doi:10.1111/j.1558-5646.2007.00229.x) [DOI] [PubMed] [Google Scholar]
- 51.Dunbar RIM, Shultz S. 2007. Evolution in the social brain. Science 317, 1344–1347 10.1126/science.1145463 (doi:10.1126/science.1145463) [DOI] [PubMed] [Google Scholar]
- 52.Dunbar RIM, Shultz S. 2007. Understanding primate brain evolution. Phil. Trans. R. Soc. B 362, 649–658 10.1098/rstb.2006.2001 (doi:10.1098/rstb.2006.2001) [DOI] [PMC free article] [PubMed] [Google Scholar]
- 53.Dunbar RIM. 2003. The social brain: mind, language, and society in evolutionary perspective. Annu. Rev. Anthropol. 32, 163–181 10.1146/annurev.anthro.32.061002.093158 (doi:10.1146/annurev.anthro.32.061002.093158) [DOI] [Google Scholar]
- 54.Dunbar R. 1998. The social brain hypothesis. Evol. Anthropol. 6, 178–190 (doi:10.1002/(SICI)1520-6505(1998)6:5<178::AID-EVAN5>3.0.CO;2-8) [DOI] [Google Scholar]
- 55.Joffe TH, Dunbar RIM. 1997. Visual and socio-cognitive information processing in primate brain evolution. Proc. R. Soc. Lond. B 264, 1303–1307 10.1098/rspb.1997.0180 (doi:10.1098/rspb.1997.0180) [DOI] [PMC free article] [PubMed] [Google Scholar]
- 56.Aiello LC, Dunbar RIM. 1993. Neocortex size, group size, and the evolution of language. Curr. Anthropol. 34, 184–1983 10.1086/204160 (doi:10.1086/204160) [DOI] [Google Scholar]
- 57.Dunbar RIM. 1992. Neocortex size as a constraint on group size in primates. J. Hum. Evol. 20, 469–493 10.1016/0047-2484(92)90081-J (doi:10.1016/0047-2484(92)90081-J) [DOI] [Google Scholar]
- 58.Sallet J, et al. 2011. Social network size affects neural circuits in macaques. Science 334, 697–700 10.1126/science.1210027 (doi:10.1126/science.1210027) [DOI] [PubMed] [Google Scholar]
- 59.Lewis PA, Rezaie R, Brown R, Roberts N, Dunbar RIM. 2011. Ventromedial prefrontal volume predicts understanding of others and social network size. NeuroImage 57, 1624–1629 10.1016/j.neuroimage.2011.05.030 (doi:10.1016/j.neuroimage.2011.05.030) [DOI] [PMC free article] [PubMed] [Google Scholar]
- 60.Powell J, Lewis PA, Roberts N, García-Fiñana M, Dunbar RIM. 2012. Orbitofrontal prefrontal cortex volume predicts social network size: an imaging study of individual differences in humans. Proc. R. Soc. B 279, 2157–2162 10.1098/rspb.2011.2574 (doi:10.1098/rspb.2011.2574) [DOI] [PMC free article] [PubMed] [Google Scholar]
- 61.Kanai R, Bahrami B, Roylance R, Rees G. 2011. Online social network size is reflected in human brain structure. Proc. R. Soc. B 279, 1327–1334 10.1098/rspb.2011.1959 (doi:10.1098/rspb.2011.1959) [DOI] [PMC free article] [PubMed] [Google Scholar]
- 62.Zhou WX, Sornette D, Hill RA, Dunbar RIM. 2005. Discrete hierarchical organization of social group sizes. Proc. R. Soc. B 272, 439–444 10.1098/rspb.2004.2970 (doi:10.1098/rspb.2004.2970) [DOI] [PMC free article] [PubMed] [Google Scholar]
- 63.Stiller J, Dunbar RIM. 2007. Perspective-taking and memory capacity predict social network size. Soc. Netw. 29, 93–104 10.1016/j.socnet.2006.04.001 (doi:10.1016/j.socnet.2006.04.001) [DOI] [Google Scholar]
- 64.Kudo H, Dunbar RIM. 2001. Neocortex size and social network size in primates. Anim. Behav. 62, 711–722 10.1006/anbe.2001.1808 (doi:10.1006/anbe.2001.1808) [DOI] [Google Scholar]
- 65.Hill R, Bentley A, Dunbar RIM. 2008. Network scaling reveals consistent fractal pattern in hierarchical mammalian societies. Biol. Lett. 4, 748–751 10.1098/rsbl.2008.0393 (doi:10.1098/rsbl.2008.0393) [DOI] [PMC free article] [PubMed] [Google Scholar]
- 66.Hamilton MJ, Milne BT, Walker RS, Burger O, Brown JH. 2007. The complex structure of hunter–gatherer social networks. Proc. R. Soc. B 274, 2195–2203 10.1098/rspb.2007.0564 (doi:10.1098/rspb.2007.0564) [DOI] [PMC free article] [PubMed] [Google Scholar]
- 67.Goncalves B, Perra N, Vespignani A. 2011. Validation of Dunbar's number in Twitter conversations. PLoS ONE6, e22656 [DOI] [PMC free article] [PubMed] [Google Scholar]
- 68.Dunbar RIM. 2012. Social cognition on the internet: testing constraints on social network size. Phil. Trans. R. Soc. B 367, 2192–2201 10.1098/rstb.2012.0121 (doi:10.1098/rstb.2012.0121) [DOI] [PMC free article] [PubMed] [Google Scholar]
- 69.Shultz S, Dunbar RIM. 2010. Species differences in executive function correlate with brain size across non-human primates. J. Comp. Psychol. 124, 252–260 10.1037/a0018894 (doi:10.1037/a0018894) [DOI] [PubMed] [Google Scholar]
- 70.Deaner R, Isler K, Burkart J, van Schaik C. 2007. Overall brain size, and not encephalization quotient, best predicts cognitive ability across non-human primates. Brain Behav. Evol. 70, 115–124 10.1159/000102973 (doi:10.1159/000102973) [DOI] [PubMed] [Google Scholar]
- 71.McDaniel MA. 2005. Big-brained people are smarter: a meta-analysis of the relationship between in vivo brain volume and intelligence. Intelligence 33, 337–346 10.1016/j.intell.2004.11.005 (doi:10.1016/j.intell.2004.11.005) [DOI] [Google Scholar]
- 72.Mellars P, French JC. 2011. Tenfold population increase in western Europe at the Neandertal to modern human transition. Science 333, 623–627 10.1126/science.1206930 (doi:10.1126/science.1206930) [DOI] [PubMed] [Google Scholar]
- 73.Gamble C. 1999. The palaeolithic societies of Europe. Cambridge, UK: Cambridge University Press [Google Scholar]
- 74.Mellars P. 1996. Symbolism, language and the Neanderthal mind. In Modelling the early human mind (eds Mellars P, Gibson KR.). Cambridge, UK: Cambridge University Press [Google Scholar]
- 75.Horan RD, Bulte E, Shogren JF. 2005. How trade saved humanity from biological exclusion: an economic theory of Neanderthal extinction. J. Econ. Behav. Organ. 58, 1–29 10.1016/j.jebo.2004.03.009 (doi:10.1016/j.jebo.2004.03.009) [DOI] [Google Scholar]
- 76.Whallon R. 2006. Social networks and information: non-‘utilitarian’ mobility among hunter-gatherers. J. Anthropol. Archaeol. 25, 259–270 10.1016/j.jaa.2005.11.004 (doi:10.1016/j.jaa.2005.11.004) [DOI] [Google Scholar]
- 77.Powell A, Shennan S, Thomas MG. 2009. Late Pleistocene demography and the appearance of modern human behavior. Science 324, 1298–1301 10.1126/science.1170165 (doi:10.1126/science.1170165) [DOI] [PubMed] [Google Scholar]
- 78.Shultz S, Nelson E, Dunbar RIM. 2012. Hominin cognitive evolution: identifying patterns and processes in the fossil and archaeological record. Phil. Trans. R. Soc. B 367, 2130–2140 10.1098/rstb.2012.0115 (doi:10.1098/rstb.2012.0115) [DOI] [PMC free article] [PubMed] [Google Scholar]