

Abstract
The incredible diversity of colour patterns in coral reef fishes has intrigued biologists for centuries. Yet, despite the many proposed explanations for this diversity in coloration, definitive tests of the role of ecological factors in shaping the evolution of particular colour pattern traits are absent. Patterns such as spots and eyespots (spots surrounded by concentric rings of contrasting colour) have often been assumed to function for predator defence by mimicking predators' enemies' eyes, deflecting attacks or intimidating predators, but the evolutionary processes underlying these functions have never been addressed. Striped body patterns have been suggested to serve for both social communication and predator defence, but the impact of ecological constraints remains unclear. We conducted the first comparative analysis of colour pattern diversity in butterflyfishes (Family: Chaetodontidae), fishes with conspicuous spots, eyespots and wide variation in coloration. Using a dated molecular phylogeny of 95 species (approx. 75% of the family), we tested whether spots and eyespots have evolved characteristics that are consistent with their proposed defensive function and whether the presence of spots and body stripes is linked with species' body length, dietary complexity, habitat diversity or social behaviour. Contrary to our expectations, spots and eyespots appeared relatively recently in butterflyfish evolution and are highly evolutionarily labile, suggesting that they are unlikely to have played an important part in the evolutionary history of the group. Striped body patterns showed correlated evolution with a number of ecological factors including habitat type, sociality and dietary complexity. Our findings question the prevailing view that eyespots are an evolutionary response to predation pressure, providing a valuable counter example to the role of these markings as revealed in other taxa.
Keywords: adaptive coloration, background matching, camouflage, conspicuousness, visual signals, predation pressure
1. Introduction
For over a century, biologists have sought evolutionary explanations for the immense complexity of colours and body patterns displayed by coral reef fishes [1]. Lorenz [2] famously proposed that the advertisement or ‘poster coloration’ of tropical fishes might be used to signal aggression in intraspecific territorial disputes, while Fricke [3], suggested that the same coloration might serve for species recognition. However, the majority of proposed functions relate to predator defence and include camouflage [4,5], mimicry [6] and warning coloration [7]. Despite this continued fascination with the diversity of colour patterns exhibited by coral reef fishes [8], the link between ecology, behaviour and colour pattern evolution still remains unresolved.
Butterflyfishes are iconic inhabitants of coral reefs and particularly well known for their conspicuous eyespots and huge diversity in coloration [9]. Eyespots are patterns consisting of concentric rings of contrasting colours and are also commonly found in butterflies and moths, birds, frogs, other fishes and molluscs [10]. In his classic work on adaptive coloration, Cott [5] suggested that the posterior location of eyespots in butterflyfishes serves to deflect attacks from predators by producing ‘the impression of a head at the wrong end’. This would provide false information about the expected escape trajectory, hence increasing the survival chances of prey. Other suggested functions of eyespots in this family include predator intimidation through mimicry of the eye of the predator's enemy [11], territorial signalling [2], species recognition [12] and aposematism [13]. Finally, it has also been argued that eyespots that are larger than the real eye should deceive predators into launching an attack when they are further away from the fish than when usually targeting prey (‘reaction–distance hypothesis’) [14]. Butterflyfishes also commonly possess spots that contrast with the colour of the background skin but do not have an outer ring and therefore do not fit the conventional definition of eyespots. Like eyespots, such simple spots may serve for predator defence, or they may facilitate other behaviours such as intraspecific signalling. Both spots and eyespots may have similar developmental pathways (irrespective of their function) or spots may be evolutionary precursors to eyespots, later evolving a contrasting outer ring to enhance their conspicuousness or promote predator eye mimicry.
Besides spots and eyespots, other colour patterns of butterflyfishes have been proposed to provide protection from visual predators. Stripes across the eyes may obscure the shape of the eye and have been suggested to confuse potential predators [5,15,16]. Striped patterns that extend along the length of the body are also common in the family and may play a role in facilitating camouflage to avoid detection by predators. Camouflage may be achieved if the patterns resemble those in the background environment (background matching) and serve to break up the outline of the body (disruptive coloration) [17]. Because disruptive coloration should also allow prey to blend into the background to decrease their detectability [17], we expect camouflaging patterns in general to vary with the visual properties of the habitats of species. We would expect that body stripes might therefore aid camouflage in the more complex visual background provided by coral reefs, but in homogeneous visual environments (e.g. open water), plain coloration (less patterning) may be more effective in facilitating concealment. However, stripes may also have other functions; in cichlid fishes, for example, horizontal stripes are associated with social behaviour and foraging mode while vertical stripes are linked with habitat type [18].
In this study, we adopt the first comparative approach to examining the ecological and behavioural factors that have underpinned the evolution of colour patterns in butterflyfishes. It has long been proposed that eyespots in prey species function primarily for predator defence [10]; we therefore focus on the putative antipredator role of these markings and determine whether spots might serve a similar function. Specifically, we focus our predictions on the two major hypotheses proposed for the evolution of eyespots in Lepidoptera (reviewed by Stevens [19] and Kodandaramaiah [20]): attack deflection and intimidation of predators. As it is important that the spot or eyespot (and not the real eye) draws the visual attention of the predator, (i) the real eye should be concealed to facilitate the diversion (ii) and/or the spot or eyespot (or its ‘pupil’) should be larger than the actual eye (or real pupil) of the prey. If spots or eyespots function to misdirect attacks and facilitate prey escape, (iii) they should be located in the posterior region of the body. Spots or eyespots that serve to intimidate should also be larger than the real eye because the predator's enemies would have relatively larger eyes. However, we did not expect intimidating spots to be in any particular body location or for the real eye to be concealed. We also investigated whether (iv) the evolution of spots preceded eyespots and (v) the ‘pupil’ of eyespots was darker than the ‘background’ skin colour, as this would indicate intimidation or deflection functions based on eye mimicry.
If body stripes are particularly effective at promoting concealment in complex visual environments, then we expected (vi) that these patterns would be associated with complex reef habitats such as live corals and sponges, while species with little or no patterning would inhabit open water above the reef, or muddy/sandy substrates where the lack of patterning would provide a higher degree of background matching when viewed against these visually homogeneous backgrounds. As many of the above predictions (i–v) would also hold for functions other than predator defence (e.g. large spots or eyespots could promote intraspecific signalling), we also conducted more general analyses to determine whether (vii) the evolution of spots, eyespots or body stripes is linked with other factors including species' body length, dietary complexity, habitat diversity and social behaviour. As the orientation of stripes can relate to their function [18], we further classified these markings as horizontal, vertical or diagonal. This general approach allowed us to consider alternative hypotheses for the patterns observed and any indirect relationships between colour patterns, body size, predation risk and species' ecology.
2. Material and methods
(a). Evaluating coloration
Butterflyfish colour patterns were assessed using photographs of live adult individuals in their natural habitat. Sexual dimorphism is not pronounced in this family and both sexes exhibit bright coloration [21]. Reef fish identification books were our primary source of information [9,22], but we also examined the photographs in Fish Base [23]. J.K. and S.M. both scored colour patterns independently, using a minimum of three individual photographs each to assess the coloration of each species. There was good concordance between the observers for both binary (Kuder–Richardson formula [24] for reliability: eye stripe = 0.90, spot = 0.99, eyespot = 0.97) and continuous data (repeatability for total number of stripes: r = 0.96 ± 0.01, n = 90, p < 0.001). As most photographs were taken side-on to the fish, we only included colour patterns that were present on the lateral flanks. Colour patterns (spot, eyespot, eye stripe, adjacent eye stripe, body stripes and plain) were defined according to the annotations in figure 1 (full definitions are provided in the electronic supplementary material, S1). Stripes always had the ‘background’ skin colour on either side of the bar (at least half the width of the bar), to exclude coloured stripes that were present on the trailing edge of fins. Fish that had a uniform patch of colour (without markings) extending over 50 per cent of the side of the body were classed as ‘plain’.
Figure 1.
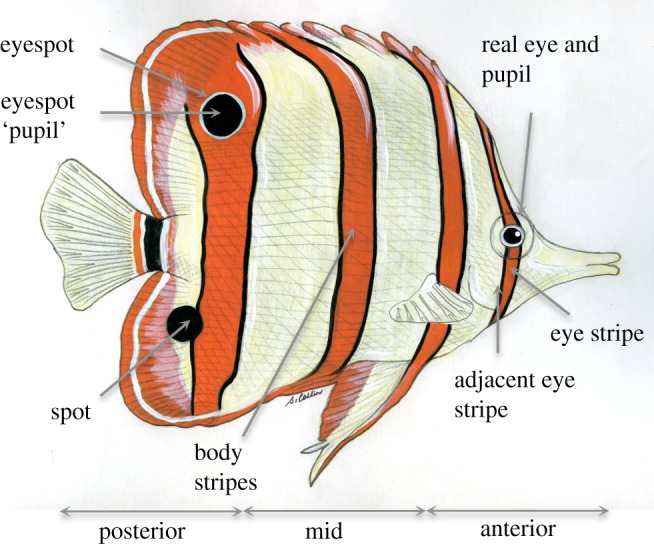
Hypothetical butterflyfish illustrating the key colour pattern traits and their definitions. Spot and eyespot size was determined relative to the size of the real eye while eyespot pupil size was judged relative to the size of the real fish's pupil (equal in size or larger than the real eye or pupil for both). Spot and eyespot pupil colour were assessed relative to the background skin (darker or lighter) and spots or eyespots could be located posteriorly or at an anterior/mid position on the body. Eye stripes and adjacent eye stripes were also binary (present or absent) while body stripes were both binary and continuous (total number of stripes) and scored according to direction (vertical, horizontal or diagonal). Figure from an original painting by S. Collin.
(b). Ecological information
Dietary information and habitat data were obtained from the primary literature, reef fish identification books and online resources (raw data presented in electronic supplementary material, S2, full categorizations of the ecological variables considered are listed in electronic supplementary material, S1, but described in brief below). Food items classed as present or absent in the diet included: algae, eggs (e.g. molluscan and fish), hard coral (Scleractinians), soft coral (Alcyonarians), mucous, zooplankton, sponges, echinoderms, small benthic invertebrates (e.g. polychaetes and hydroids) and parasites. These data were used to calculate a measure of dietary complexity, which was the total number of foot items present in the diet of each species (range: 1–10). The categorization obligate corallivory [25] was used to determine whether there was a link between the evolution of corallivory and butterflyfish coloration. Information on the habitats of each species was used to rank substrates according to their visual complexity; 0 = oceanic background (for species occuring in the water column), 1 = sand, mud or silt substrates (e.g. estuarine inhabitants), 2 = algae, 3 = seagrass and seaweed, 4 = rock and dead coral, and 5 = live corals and sponges. These data were used to calculate measures of habitat diversity (total number of habitats occupied; range 1–6) and visual habitat complexity (total visual complexity score divided by number of habitats occupied; range 0–5). Reef habitats were noted for each species as either shallow coastal (0) or outer offshore (1); those that could not be assigned to either of these categories or were data deficient were not included. We dealt with conflicting information by consulting as many information sources as possible to find a consensus. If this was not possible, the species concerned was omitted from the analysis (samples sizes are stated if the full phylogeny was not used).
Butterflyfish social systems were categorized according to grouping tendency where species were considered to be either solitary/paired (0) or typically found in groups of three or more individuals (1). We also estimated sociability by assigning species a social score between 0 and 3; 0 = usually solitary, 1 = usually in pairs, 2 = forms small groups (3–15 individuals), 3 = forms large (more than 15 individuals) groups. A sociability index was calculated by summing the scores for each species and dividing by the number of social categories each species was found in (range: 0–3). To determine the relationship between body coloration, body length and habitat depth, we used the maximum total body length and habitat depth reported for each species, as listed in Fish Base [23].
(i). Phylogenetic comparative analysis
We used the molecular phylogeny of Chaetodontidae produced by Bellwood et al. [25] and extended by Cowman & Bellwood [26] to control for non-independence of data owing to shared ancestry among butterflyfishes. This phylogeny comprises 102 species, including seven outgroup taxa (Pomacanthidae: angelfishes; Scatophagidae: scats) and has branch length data.
(ii). Estimating phylogenetic signal
We began by estimating lambda (λ), a measure of phylogenetic signal [27] which ranges from 0 (no phylogenetic signal) to 1 (strong phylogenetic signal), for all butterflyfish colour patterns and ecological traits using the ‘geiger’ package [28] in the statistical program R [29]. Estimating λ facilitates an assessment of whether traits evolved following Brownian motion (BM: λ = 1), where changes accumulate gradually over time, or whether traits are influenced by other evolutionary processes (λ = 0). The observed λ value for each trait was compared with modified trees in which branch lengths were set to λ = 0 (no phylogenetic signal) or λ = 1 (BM), then the fit of each of these models was compared with the observed λ using likelihood ratio (LR) tests in which the test statistic LR is compared with a χ2 distribution.
(iii). Ancestral state reconstructions
We reconstructed character histories for discrete characters including spots, eyespots, eye stripes and body stripes and determined the likelihood of the alternative ancestral states for each of these traits. We performed ancestral state reconstructions using the likelihood method that maximizes the probability that the observed character states (0 or 1) would evolve under a stochastic model of evolution [30]. Using Mesquite software [31], we implemented the Markov k-state-one-parameter model in which the single parameter is the rate of change and transitions from one state to another are equally likely.
(iv). Testing for correlated evolution of binary traits
We tested for correlated evolution among pairs of discrete binary traits [32] using the maximum-likelihood method in BayesDiscrete (available at www.evolution.rdg.ac.uk). The program estimates rates of change between binary character states and compares a model that assumes character states evolve independently with a model where the evolution of one character depends on the state of the other [32]. We ran 1000 optimization attempts to estimate the log likelihood for both dependent and independent models and tested their fit using log-likelihood ratio tests. We corrected for the large number of correlations performed on the discrete character traits using the Benjamini & Hochberg method [33,34] to control the false discovery rate (FDR). We investigated the direction of significant evolutionary transitions by sequentially restricting all eight possible changes in character state (see figure 2 legend) of the (dependent) model to zero and comparing these to the original model.
Figure 2.

Evolutionary transitions for the presence of an eyespot and an adjacent eye stripe (left to right: Chaetodon auriga, Chaetodon pelewensis and Chaetodon bennetti). There are four possible character states with eight potential transitions among them (gains and losses for each): arrows illustrate significant evolutionary gains (filled arrows) and losses (open arrows) of these traits while dashed arrows show the less likely evolutionary pathway. Note that ‘eyespot loss’ refers to the transition from eyespot to spot. Results of likelihood ratio tests are given along with their associated p-values. Photographs by D. Cook (C. auriga, C. bennetti) and J. Randall (C. pelewensis) from Fish Base [35].
We first used the full phylogeny to test for a relationship between the presence of an eye stripe and a spot or eyespot. As adjacent or concentric markings of a different colour may enhance the overall visual effect, we also considered the relationship between adjacent eye stripes and eyespots. Further investigation of the relationship between the presence of an eye stripe and spot/eyespot characteristics (total size, position, eyespot pupil size and colour) required reducing the phylogeny (n = 17 species with spots; 11 with eyespots) as not all butterflyfishes have spots or eyespots. We tested whether spots or eyespots tend to evolve in an anterior to posterior direction on the body using a discrete model of character evolution (using the Geiger package in R, which was used to estimate λ) specifying an equal rate of transitions between these characters or a model in which all rates of transition are different. The tree was corrected for λ and the fit of the two models was compared using log-likelihood ratio tests.
We also tested for evolutionary correlations between our main traits of interest (spot or eyespot, body stripes and plain) and the ecological variables (obligate corallivory, grouping, reef habitat and zooplankton feeding). As this was a general exploratory analysis, we considered species that had either spots or eyespots. We also specifically considered whether eye concealment was likely to evolve in species lacking other types of patterning (i.e. plain). Obligate corallivory was of particular interest because it is uncommon in reef fishes other than chaetodontids [36] and could be associated with particular patterning. As planktivorous butterflyfishes are often found in shoals above the reef [37], we determined whether their colour patterns were more likely to be plain to provide concealment when viewed against an open water background.
(v). Phylogenetic linear and logistic models
Evolutionary relationships among continuous traits were tested using phylogenetic generalized least-squares (PGLS) regression [38] on log transformed (x + 1) character traits using the Analyses of Phylogenetics and Evolution (APE) package [39] in R [29]. We evaluated the influence of ecological traits on the total number of body stripes displayed by initially entering all ecological predictors (habitat diversity, visual habitat complexity, dietary complexity and sociability) into a multivariate PGLS regression model and refining the model by examining the corresponding Akaike information criterion (AIC) values. We confirmed that the assumptions of the model were met by inspecting the distribution of the residual values. To examine the effect of body length and habitat depth on the evolution of eyespots, we performed a phylogenetic logistic regression (also in APE) with the discrete variable as a response and the continuous variables (body length and depth) as predictors.
3. Results
(a). Estimating phylogenetic signal
Spot, eyespot and the character ‘plain’ had no detectable phylogenetic component (λ did not significantly differ from zero; table 1), indicating that these traits are evolutionarily labile and evolve rapidly. In contrast, eye stripe and obligate corallivory did not deviate from a BM (i.e. stochastic) model of evolution (λ was not significantly different from one; table 1), indicating that in these traits divergence accumulates gradually over time. All other morphological and ecological traits lay somewhere between these extremes (table 1).
Table 1.
Estimates of phylogenetic signal (λ) for discrete (D) and continuous (C) morphological and ecological traits. LL is the log likelihood of the estimated lambda value, the log likelihood that equals 0, the log likelihood that equals 1 and the p-values associated with these models.
| trait | D/C | λ | LL λ | LL λ = 0 | p-value | LL λ = 1 | p-value |
|---|---|---|---|---|---|---|---|
| morphological traits | |||||||
| eye stripea | D | 0.959 | −31.42 | −40.41 | <0.0001 | −31.54 | 0.619 |
| spotb | D | 0.744 | −56.56 | −57.40 | 0.196 | −61.78 | 0.001 |
| eyespotb | D | 0.805 | −34.26 | −34.75 | 0.323 | −36.68 | 0.028 |
| adjacent eye stripe | D | 0.713 | −51.15 | −53.28 | 0.039 | −55.42 | 0.004 |
| plainb | D | 0.518 | −43.41 | −43.764 | 0.407 | −54.898 | <0.0001 |
| body stripes | D | 0.796 | −56.58 | −59.143 | 0.0235 | −62.43 | 0.0006 |
| body length | C | 0.799 | 19.30 | 3.706 | 0.0001 | 8.206 | <0.0001 |
| ecological traits | |||||||
| reef habitat | D | 0.642 | −7.557 | −16.701 | <0.0001 | −37.895 | <0.0001 |
| habitat depth | C | 0.363 | −97.821 | −102.549 | 0.002 | −137.064 | <0.0001 |
| habitat diversityb | C | <0.001 | −5.154 | −5.154 | 1 | −57.54 | <0.0001 |
| visual habitat complexity | C | 0.723 | −37.357 | −50.858 | <0.0001 | −92.001 | <0.0001 |
| dietary complexityb | C | 0.169 | −62.072 | −62.291 | 0.508 | −97.969 | <0.0001 |
| obligate corallivorya | D | 0.987 | −51.354 | −65.891 | <0.0001 | −51.561 | 0.52 |
| grouping | D | 0.599 | −60.004 | −65.537 | 0.0009 | −66.058 | 0.0005 |
aTraits that fit a stochastic (BM) model of character evolution (λ is not significantly different from 1).
bTraits with no detectable phylogenetic signal (i.e. λ is not significantly different from 0).
(b). Ancestral state reconstructions
The ancestral trait reconstruction shows that simple spots have evolved independently 12 times and have evolved relatively recently in evolutionary history, around 7–8 Ma (figure 3). Indeed, the reconstructions indicated that the most likely ancestral state of this character in the butterflyfishes is spot absence (proportional likelihood = 0.90) rather than presence. Similarly, eyespots evolved relatively recently in butterflyfish evolutionary history, having evolved independently six times in the last 8 Ma (figure 3) with the most likely ancestral state also being eyespot absence (proportional likelihood = 0.90). The reconstruction for body stripes revealed a 50 : 50 probability that stripe presence is ancestral, while eye stripes appeared early on the evolutionary history of the Chaetodontidae and likely represent the ancestral state (proportional likelihood for eye stripe presence = 0.98) for all Chaetodon clades, following their split from the bannerfish clade (e.g. Heniochus spp.) around 32.8 Ma (24.9–40.9, 95% highest posterior density intervals) [25]. Proportional likelihoods for all of the ancestral state reconstructions are given in the electronic supplementary material, S3.
Figure 3.

Ancestral state reconstruction for the evolution of spots (orange branches) or eyespots (blue branches). None of the immediate ancestors of extant species displaying spots or eyespots had these characters (black branches), thus the proportional likelihood for each character state at each node in the tree is equivocal. Photographs from Fish Base [35] taken by J. Greenfield (Coradion melanopus and Chaetodon ulietensis), R. Kretzburg (Forcipiger flavissimus), J. Randall (Chaetodon multicinctus, Chaetodon miliaris, Chaetodon speculum and Parachaetodon ocellatus) and M. Steele (Chaetodon capistratus).
(c). Correlated evolution of colour pattern traits
We found no evidence for correlated evolution between eye stripes and spots (LR = 4.36, d.f. = 4, p = 0.36) or between eye stripes and eyespots (LR = 3.88, d.f. = 4, p = 0.42) (n = 95 taxa for each. However, 14 of the 17 species with spots had eye stripes and all species with eyespots (n = 11) also had eye stripes, suggesting an evolutionary correlation between these traits (i.e. for eyespots, both traits were present in all taxa). Furthermore, there was an evolutionary correlation between the presence of an adjacent eye stripe and an eyespot on the body (LR = 17.62, d.f. = 4, p = 0.002; Padjusted = 0.021). Fish with spots were equally likely to show an evolutionary loss or gain of an adjacent eye stripe while fish with adjacent eye stripes were equally likely to gain or lose an eyespot (figure 2). Possession of an adjacent eye stripe may therefore be a precursor to the evolution of an eyespot from a spot; this is supported by ancestral state reconstructions for these traits, which reveal that adjacent eye stripes are likely to have arisen (approx. 10 Ma) before spot ocelli (at around 7–8 Ma).
For species with spots, there was no relationship between the presence of an eye stripe and the total size of the spot (LR = 4.36, d.f. = 4, p = 0.36, n = 17 species) or eyespot (LR < 0.01, d.f. = 4, p = 0.99, n = 11 species). However, all species with eyespots and eye stripes had eyespot pupils that were larger than the pupil of the fish's real eye and darker than the ‘background’ skin colour. There was no relationship between the presence of an eye stripe and the position of the spot (LR = 2.91, d.f. = 4, p = 0.57) or eyespot (LR = 4.05, d.f. = 4, p = 0.40). Altering the character model for spot or eyespot position from one in which all rates of transition are equal to one in which rates of transition were different improved the fit of the model, but not significantly (spots: LR = 1.27, d.f. = 1, p = 0.26; eyespots: LR = 1.76, d.f. = 1, p = 0.18). A χ2 test (λ was not significantly different from 0 and we did not account for phylogeny) revealed that spots (χ2 = 1.47, d.f. = 1, p = 0.23) and eyespots (χ2 = 0.81, d.f. = 1, p = 0.37) were no more likely to be located in a posterior position than an anterior position.
We found evidence for an evolutionary correlation between the presence of an eye stripe and fish with plain coloration (LR = 9.85, d.f. = 4, p = 0.04); however, this was non-significant following adjustment for multiple comparisons (Padjusted = 0.28). There was no relationship between the presence of a spot or eyespot and either obligate corallivory or grouping (table 2). There was also no relationship between the presence of body stripes and corallivory, but there was a marginally non-significant trend for the presence of stripes to be associated with grouping behaviour (table 2, and below also). There was also a significant correlation between the presence of body stripes and a preference for offshore habitats (table 2); if stripes were present, species were equally likely to occur onshore or offshore and species living offshore may either gain or lose striped body patterns (see the electronic supplementary material, S4). Plain patterning was not associated with feeding on zooplankton or grouping behaviour (table 2).
Table 2.
Evolutionary correlations between discrete colour pattern traits and ecological variables. The likelihood ratio statistic is given along with the p-value (in brackets) obtained from a χ2 distribution for four d.f. Value in italic remained significant after controlling for the FDR (Padjusted = 0.021).
| traits | obligate corallivory | grouping | reef habitata | zooplankton feeding |
|---|---|---|---|---|
| spot or eyespot | 3.89 (0.42) | 3.79 (0.44) | 2.36 (0.67) | 1.96 (0.74) |
| body stripes | 4.51 (0.34) | 9.20 (0.056) | 17.0 (0.002) | 7.69 (0.10) |
| plain | 2.68 (0.61) | 4.12 (0.39) | 1.20 (0.88) | 3.70 (0.44) |
aN = 61 species owing to the lack of habitat information for some species. All other tests were performed on the full phylogeny (95 species).
(d). Phylogenetic linear and logistic models: linking colour patterns with ecology
We found no effect of visual habitat complexity (β = −0.03, t = −0.13, p = 0.90) or habitat diversity (β = −0.05, t = −0.16, p = 0.870) on the total number of body stripes displayed (full five-parameter model, n = 91, λ = 0.62, AIC = 72.4, adjusted r2 = 0.05). Removal of these terms from the model, improved the fit (three-parameter model, n = 91, λ = 0.61, AIC = 66.4, adjusted r2 = 0.07) and revealed a significant effect of sociability (β =−0.82, t =−2.38, p = 0.019) and a marginally non-significant effect of dietary complexity (β = 0.31, t = 1.69, p = 0.09). However, both sociability and dietary complexity were related to the number of diagonal stripes displayed; more social species had fewer diagonal stripes (β =−1.5, t =−3.34, r2 = 0.10, p = 0.001), while species with greater dietary diversity had more of these markings (β = 0.68, t = 2.78, r2 = 0.07, p = 0.007). These values remained significant after controlling for the FDR (Padjusted = 0.007 and 0.025, respectively; ntests = 7). There was no effect of these factors on vertical or horizontal stripes (vertical: sociability, β = 0.21, t = 0.78, r2 ≤−0.01, p = 0.44; dietary diversity, β =−0.14, t = −0.99, r2 ≤−0.01, p = 0.32; horizontal: sociability, β = 0.01, t = 0.22, r2 = −0.01, p = 0.82; dietary diversity, β =−0.01, t = −0.18, r2 ≤ 0.01, p = 0.86) and there was no relationship between sociability and dietary complexity alone (β = −0.04, t = −0.67, r2 ≤ 0.01, p = 0.51).
We found no effect of body length (PGLS regression: β =−0.46, t =−1.10, p = 0.23, n = 95, r2 =−0.002, λ = 0.59) or maximum habitat depth occupied (β = 0.38, t = 1.09, p = 0.28, r2 = 0.001, λ = 0.40) on the total number of body stripes. However, the logistic regressions testing for an association between spots and body length revealed an inverse relationship between body length and spot presence (β =−10.4; t =−4.77, p < 0.001, d.f. = 16.9, estimated λ = 1.303). There was no relationship between spot presence and maximum habitat depth (β = 1.36; t = 1.89, p = 0.08, d.f. = 16.9, estimated λ = 1.06). We were not able to test for a relationship between eyespot presence and body length or habitat depth, or between spots/eyespots and the other ecological variables (e.g. habitat diversity and sociability) owing to the lack of convergence in the models.
4. Discussion
If spots and eyespots in butterflyfishes have evolved in response to consistent natural selection by visual predators then we expected these markings to have played an important part in the evolutionary history of the family. However, we found that spots and eyespots have evolved relatively recently (approx. 7–8 Ma) and independently at least 12 times. Furthermore, our expectation that particular features of spots and eyespots (e.g. total size, position, eyespot pupil size and colour) would show correlated evolution in accordance with their proposed defensive mechanisms was generally not met. We did, however, find that eye stripes appeared very early in the evolutionary history of butterflyfishes, suggesting that eye concealment is important and may prevent detection or recognition by predators. Adjacent eye stripes showed correlated evolution with eyespots, possibly acting to accentuate existing patterning. We also found evidence that the evolution of body stripes is associated with diet and social behaviour; while diagonal stripes were negatively associated with species' sociality these patterns were also positively related to dietary complexity. While ecological variables are correlated with the evolution of striped patterns in butterflyfishes, the factors that are responsible for the evolution of spots and eyespots remain elusive.
The evolution of coral reef fishes and their predators dates back to the Early Eocene (50 Ma) [40], thus we expected that the presence of spots or eyespots in butterflyfishes could be traced to a distant ancestor. Instead, the sporadic and recent evolutionary history of spots and eyespots suggests that they are unlikely to have been subject to consistent selection by predators over the course of their evolution. Phylogenetic studies with other taxa such as junoniine butterflies have also revealed that eyespots have evolved independently and multiple times, with the total number of eyespots present on the wings both increasing and decreasing during their evolutionary history [36]. In addition, subsequent work with species from three families of butterflies has revealed that species with similar patterning are not necessarily using the same genetic pathways to express these traits, illustrating that eyespot evolution is highly flexible [41]. Indeed, an extensive body of literature on the wing patterns of Lepidoptera has revealed that they respond rapidly to selection and show high levels of phenotypic plasticity, such as seasonal polyphenisms [42]. The eyespots of butterflyfishes also appear to be evolutionarily (this study) and developmentally [43] labile; perhaps, they serve to facilitate escape in some situations, while increasing the prey's risk of detection in other contexts.
Although a number of studies have reported that eyespots function for predator defence [35,44–47], others have found no clear evidence that eyespot presence or position increases the prey's chances of survival [48–50]. If spots or eyespots function to deflect or misdirect predator attacks to increase the prey's chance of escape, then we might have expected that they would primarily be located at the posterior part of the body, which was not the case. However, the position of the spot or eyespot may determine its conspicuousness and in butterflies, for example, larger eyespots tend to be centrally located while smaller ones tend to be positioned at the margins [20]. Nonetheless in the current study, we found no relationship between spot/eyespot size and location on the body. The finding that eyespots were also always associated with eye stripes suggests that eyespots alone are not effective in their function, or that similar developmental pathways are involved. Our observation that eyespot pupils were always larger that the fish's real pupil and were darker than the surrounding background skin provides some support for the notion that these markings have evolved for conspicuousness or mimicry (e.g. to startle predators or some other signalling function). Perhaps, butterflyfishes initially evolved eye stripes to aid concealment or confuse predators about their probable escape trajectory and subsequently developed spots or eyespots to make the diversion more effective. It is important to acknowledge the limitations of comparative methods [51]; our findings are based on correlations among traits and do not imply causation. Furthermore, the ancestral trait reconstructions are estimates based on extant species and, in the case of colour pattern traits, cannot take into account extinct species or their lineages.
Only one empirical study with fishes has investigated the relationship between eyespots and the probability of survival in the wild. Juvenile ambon damselfish (Pomacentrus amboinensis) displayed eyespots that were always larger than the real eye, but mark-recapture data found no relationship between eyespot size and the probability of post-settlement survival (when predation risk is particularly high) [43]. In addition, juveniles reared in the absence of predators had larger eyespots than their wild counterparts, leading to the suggestion that eyespots may function as a signal of social subordinance to reduce aggression from adults [43]. The fact that many juvenile Chaetodontids are thought to have eyespots (59% of species in Chaetodon [16]) that fade or disappear with age (which is also the case for P. amboinensis) is consistent with this idea. Our investigations identified 10 species that have spots only as juveniles (not included in our analyses) and a further four where the eyespot becomes a spot with increasing age. However, a reduction in intraspecific aggression does not explain the negative correlation between body size and spot presence observed in this study; in fact, this observation is more consistent with a predator defensive function if smaller species are subjected to higher predation pressure.
While natural selection is expected to maintain traits that are effective in counteracting predation, the patterns of spot/eyespot evolution observed here are more consistent with sexually selected characters that are often highly evolutionarily labile [52]. Nonetheless, there is currently limited evidence that spots/eyespots in butterflyfishes might function for sexual selection as sexual dimorphism is limited with both sexes exhibiting similar coloration [53], and we found no relationship between spots/eyespots and species' social system. However, spots and eyespots play a part in sexual selection in other taxa; for example, female choice in some butterflies is based on the size and brightness of the eyespot ‘pupils’ [54], while in peacocks, the number of spots on the train is related to the male's health status and his ability to cope with an immune challenge [37]. In some species, the spatial arrangement of visual signals can facilitate multiple functions; for example, the dorsal wing patterns of butterflies promote sexual signalling while ventral characters serve for predator avoidance [55]. The notion that spots and eyespots in butterflyfishes may similarly serve multiple functions warrants further investigation.
Our finding that fish with an adjacent eye stripe were equally likely to evolve or lose an outer ring to their spot (but not vice versa) further suggests that markings that obscure the eye are important precursors to other patterns. Another possibility for this correlated evolution is that these outer regions of contrasting pigmentation are developmentally linked. In butterflies, eyespot development follows a reaction–diffusion model [56] in which the location of a morphogen (signalling substance) determines the position of the focal point of the spot and the differentiation of dark pigment around this point [57]. A second morphogen interacts with the background (wing) pigment to generate the surrounding ring of lighter coloration. Altering the position and width of the focal point can lead to very different patterns [57], including elongations that resemble the eye stripes with contrasting adjacent stripes observed here. Reaction–diffusion models also explain skin coloration in fishes [58] thus similar patterns of pigment deposition (i.e. interacting morphogens) acting at separate focal points could explain the appearence of eyespots and adjacent eye stripes during an individual's development. Thus, parallel mechanisms operating in butterflies and fishes may underlie the development of skin pigment patterns [59], but not necessarily their functional significance.
The positive relationship between the number of diagonal body stripes and dietary complexity and the negative relationship between sociality and these patterns suggest that opposing selective pressures may act on these traits. In addition, social behaviour and dietary complexity themselves may be related (although we did not find that this was the case in the present study). Previous research has identified a relationship between planktivory and grouping behaviour and between corallivory and pair bonding [60], but this did not take into account phylogenetic relationships among taxa. In accordance with our results, comparative work with cichlid fishes revealed that vertical body stripes were associated with structured (rocky) environments (that promote site fidelity and territorial defence), while horizontal stripes were related to poor social status, increased shoaling tendency (facilitated by reduced aggression) and a piscivorous feeding habit [18].
In summary, butterflyfishes display a diversity of colour pattern traits ranging from markings that are highly phylogenetically conserved, such as eye stripes, to those that are evolutionarily labile, such as spots and eyespots. We conclude that multiple constraints dictate the direction of evolution of particular colour pattern traits and that these processes may not always operate in concordance. The availability of dated phylogenetic trees provides an ideal opportunity to investigate the evolution of animal colour patterns and re-visit classic hypotheses of adaptive coloration.
Acknowledgements
We thank Leigh Simmons for hosting the wine tasting (varietal reds) that stimulated the ideas for this study. We are especially grateful to Shaun Collin for painting the beautiful illustration of the hypothetical butterflyfish in figure 1. Will Allen, Innes Cuthill, Monica Gagliano, Ullasa Kodandaramaiah and an anonymous referee provided insightful comments that greatly improved the manuscript. Liam Revell kindly provided advice on measuring evolutionary transitions. We also thank the Swedish Research Council, the Academy of Finland and The University of Western Australia for funding. J.L.F. is supported by an Australian Postdoctoral Fellowship from the Australian Research Council.
References
- 1.Thayer GH. 1909. Concealing-coloration in the animal kingdom. An exposition of the laws of disguise through colour and pattern: being a summary of Abbott H. Thayer‘s discoveries New York, NY: The Macmillan Co [Google Scholar]
- 2.Lorenz K. 1962. The function of colour in coral reef fishes. Proc. R. Instn Gt. Br. 39, 282–296 [Google Scholar]
- 3.Fricke H. 1973. Behaviour as part of ecological adaptation—in situ studies in the coral reef. Helgoland Wiss. Meer. 24, 120–144 10.1007/BF01609505 (doi:10.1007/BF01609505) [DOI] [Google Scholar]
- 4.Longley WH. 1916. Observations upon tropical fishes and inferences from their adaptive coloration. Proc. Natl Acad. Sci. USA 2, 733–737 10.1073/pnas.2.12.733 (doi:10.1073/pnas.2.12.733) [DOI] [PMC free article] [PubMed] [Google Scholar]
- 5.Cott HB. 1940. Adaptive coloration in animals. London: Methuen [Google Scholar]
- 6.Randall RE, Randall HA. 1960. Examples of mimicry and protective resemblance in tropical marine fishes. Bull. Mar. Sci. 10, 444–480 [Google Scholar]
- 7.Ehrlich PR. 1975. The population biology of coral reef fishes. Annu. Rev. Ecol. Syst. 6, 211–247 10.1146/annurev.es.06.110175.001235 (doi:10.1146/annurev.es.06.110175.001235) [DOI] [Google Scholar]
- 8.Marshall NJ. 2000. Communication and camouflage with the same ‘bright’ colours in reef fishes. Phil. Trans. R. Soc. Lond. B 355, 1243–1249 10.1098/rstb.2000.0676 (doi:10.1098/rstb.2000.0676) [DOI] [PMC free article] [PubMed] [Google Scholar]
- 9.Steene RC. 1978. Butterfly and angelfishes of the world: a complete survey of the species of Australia and New Guinea. Sydney, Australia: Reed [Google Scholar]
- 10.Poulton EB. 1890. The colours of animals. London, UK: Kegan Paul, Trench, Trubner & Co. Ltd [Google Scholar]
- 11.Karplus I, Algom D. 1981. Visual cues for predator face recognition by reef fishes. Z. Tierpsychol. 55, 343–364 10.1111/j.1439-0310.1981.tb01277.x (doi:10.1111/j.1439-0310.1981.tb01277.x) [DOI] [Google Scholar]
- 12.Zumpe D. 1965. Laboratory observations on the aggressive behavior of some butterfly fishes Chaetodontidae. Z. Tierpsychol. 22, 226–236 10.1111/j.1439-0310.1965.tb01432.x (doi:10.1111/j.1439-0310.1965.tb01432.x) [DOI] [PubMed] [Google Scholar]
- 13.Gosline WA. 1965. Thoughts on systematic work in outlaying areas. Syst. Zool. 14, 59–61 10.2307/2411905 (doi:10.2307/2411905) [DOI] [Google Scholar]
- 14.Meadows DW. 1993. Morphological variation in eyespots of the foureye butterflyfish (Chaetodon capistratus)—implications for eyespot function. Copeia 235–240 10.2307/1446319 (doi:10.2307/1446319) [DOI] [Google Scholar]
- 15.Barlow GW. 1972. The attitude of fish eye-lines in relation to body shape and to stripes and bars. Copeia 1, 4–12 10.2307/1442777 (doi:10.2307/1442777) [DOI] [Google Scholar]
- 16.Neudecker S. 1989. Eye camouflage and false eyespots—chaetodontid responses to predators. Environ. Biol. Fishes 25, 142–157 [Google Scholar]
- 17.Stevens M, Merilaita S. 2009. Defining disruptive coloration and distinguishing its functions. Phil. Trans. R. Soc. B 364, 481–488 10.1098/rstb.2008.0216 (doi:10.1098/rstb.2008.0216) [DOI] [PMC free article] [PubMed] [Google Scholar]
- 18.Seehausen O, Mayhew PJ, Van Alphen JJM. 1999. Evolution of colour patterns in East African cichlid fish. J. Evol. Biol. 12, 514–534 10.1046/j.1420-9101.1999.00055.x (doi:10.1046/j.1420-9101.1999.00055.x) [DOI] [Google Scholar]
- 19.Stevens M. 2005. The role of eyespots as anti-predator mechanisms, principally demonstrated in the Lepidoptera. Biol. Rev. 80, 573–588 10.1017/S1464793105006810 (doi:10.1017/S1464793105006810) [DOI] [PubMed] [Google Scholar]
- 20.Kodandaramaiah U. 2011. The evolutionary significance of butterfly eyespots. Behav. Ecol. 22, 1264–1271 10.1093/beheco/arr123 (doi:10.1093/beheco/arr123) [DOI] [Google Scholar]
- 21.Lorenz K. 1966. On aggression. New York, NY: Harcourt, Brace and World [Google Scholar]
- 22.Allen GR, Steene R, Humann P, Deloach N. 2003. Reef fish identification. Tropical pacific. Jacksonville, FL: New World Publications [Google Scholar]
- 23.Froese R, Pauly D. 2000. FishBase 2000: concepts, design and data sources. Los Banos, Laguna, Phillipines: ICLARM [Google Scholar]
- 24.Kuder GF, Richardson MW. 1937. The theory of the estimation of test reliability. Psychometrika 2, 151–160 10.1007/BF02288391 (doi:10.1007/BF02288391) [DOI] [PubMed] [Google Scholar]
- 25.Bellwood DR, Klanten S, Cowman PF, Pratchett MS, Konow N, van Herwerden L. 2010. Evolutionary history of the butterflyfishes (f: Chaetodontidae) and the rise of coral feeding fishes. J. Evol. Biol. 23, 335–349 10.1111/j.1420-9101.2009.01904.x (doi:10.1111/j.1420-9101.2009.01904.x) [DOI] [PubMed] [Google Scholar]
- 26.Cowman PF, Bellwood DR. 2011. Coral reefs as drivers of cladogenesis: expanding coral reefs, cryptic extinction events, and the development of biodiversity hotspots. J. Evol. Biol. 24, 2543–2562 10.1111/j.1420-9101.2011.02391.x (doi:10.1111/j.1420-9101.2011.02391.x) [DOI] [PubMed] [Google Scholar]
- 27.Pagel M. 1999. Inferring the historical patterns of biological evolution. Nature 401, 877–884 10.1038/44766 (doi:10.1038/44766) [DOI] [PubMed] [Google Scholar]
- 28.Harmon L, Weir J, Brock C, Glor R, Challenger W, Hunt G. 2009. Geiger: analysis of evolutionary diversification. R package version 1.3–1. http://www.webpages.uidaho.edu/~lukeh/index.html [Google Scholar]
- 29.RDC Team 2011. A language and environment for statistical computing. Vienna, Austria: R Foundation for Statistical Computing, 2.14.1 [Google Scholar]
- 30.Pagel M. 1999. The maximum likelihood approach to reconstructing ancestral character states of discrete characters on phylogenies. 48, 612–622 [Google Scholar]
- 31.Maddison WP, Maddison DR. 2011. Mesquite: a modular system for evolutionary analysis. 2.75. http://mesquiteproject.org [Google Scholar]
- 32.Pagel M. 1994. Detecting correlated evolution on phylogenies: a general method for the comparative analysis of discrete characters. Proc. R. Soc. Lond. B 255, 37–45 10.1098/rspb.1994.0006 (doi:10.1098/rspb.1994.0006) [DOI] [Google Scholar]
- 33.Benjamini Y, Hochberg Y. 1995. Controlling the false discovery rate: a practical and powerful approach to multiple testing. J. R. Stat. Soc. B 57, 289–300 [Google Scholar]
- 34.Benjamini Y, Krieger AM, Yekutieli D. 2006. Adaptive linear step-up procedures that control the false discovery rate. Biometrika 93, 491–507 10.1093/biomet/93.3.491 (doi:10.1093/biomet/93.3.491) [DOI] [Google Scholar]
- 35.Vallin A, Jakobsson S, Lind J, Wiklund C. 2005. Prey survival by predator intimidation: an experimental study of peacock butterfly defence against blue tits. Proc. R. Soc. B 272, 1203–1207 10.1098/rspb.2004.3034 (doi:10.1098/rspb.2004.3034) [DOI] [PMC free article] [PubMed] [Google Scholar]
- 36.Kodandaramaiah U. 2009. Eyespot evolution: phylogenetic insights from Junonia and related butterfly genera (Nymphalidae: Junoniini). Evol. Dev. 11, 489–497 10.1111/j.1525-142X.2009.00357.x (doi:10.1111/j.1525-142X.2009.00357.x) [DOI] [PubMed] [Google Scholar]
- 37.Loyau A, Saint Jalme M, Cagniant C, Sorci G. 2005. Multiple sexual advertisements honestly reflect health status in peacocks (Pavo cristatus). Behav. Ecol. Sociobiol. 58, 552–557 10.1007/s00265-005-0958-y (doi:10.1007/s00265-005-0958-y) [DOI] [Google Scholar]
- 38.Freckleton RP, Harvey PH, Pagel M. 2002. Phylogenetic analysis and comparative data: a test and review of evidence. Am. Nat. 160, 712–726 10.1086/343873 (doi:10.1086/343873) [DOI] [PubMed] [Google Scholar]
- 39.Paradis E, Claude J, Strimmer K. 2004. APE: analyses of phylogenetics and evolution in R language. Bioinformatics 20, 289–290 10.1093/bioinformatics/btg412 (doi:10.1093/bioinformatics/btg412) [DOI] [PubMed] [Google Scholar]
- 40.Wood R. 1998. The ecological evolution of reefs. Annu. Rev. Ecol. Syst. 29, 179–206 10.1146/annurev.ecolsys.29.1.179 (doi:10.1146/annurev.ecolsys.29.1.179) [DOI] [Google Scholar]
- 41.Shirai LT, Saenko SV, Keller RA, Jeronimo MA, Brakefield PM, Descimon H, Wahlberg N, Beldade P. 2012. Evolutionary history of the recruitment of conserved developmental genes in association to the formation and diversification of a novel trait. BMC Evol. Biol. 12, 21. 10.1186/1471-2148-12-21 (doi:10.1186/1471-2148-12-21) [DOI] [PMC free article] [PubMed] [Google Scholar]
- 42.Brakefield PM, Gates J, Keys D, Kesbeke F, Wijngaarden PJ, Montelro A, French V, Carroll SB. 1996. Development, plasticity and evolution of butterfly eyespot patterns. Nature 384, 236–242 10.1038/384236a0 (doi:10.1038/384236a0) [DOI] [PubMed] [Google Scholar]
- 43.Gagliano M. 2008. On the spot: the absence of predators reveals eyespot plasticity in a marine fish. Behav. Ecol. 19, 733–739 10.1093/beheco/arn013 (doi:10.1093/beheco/arn013) [DOI] [Google Scholar]
- 44.Lyytinen A, Brakefield PM, Lindstrom L, Mappes J. 2004. Does predation maintain eyespot plasticity in Bicyclus anyana? Proc. R. Soc. Lond. B 271, 279–283 10.1098/rspb.2003.2571 (doi:10.1098/rspb.2003.2571) [DOI] [PMC free article] [PubMed] [Google Scholar]
- 45.Stevens M, Hardman CJ, Stubbins CL. 2008. Conspicuousness, not eye mimicry, makes ‘eyespots’ effective antipredator signals. Behav. Ecol. 19, 525–531 10.1093/beheco/arm162 (doi:10.1093/beheco/arm162) [DOI] [Google Scholar]
- 46.Stevens M, Hopkins E, Hinde W, Adcock A, Connolly Y, Troscianko T, Cuthill IC. 2007. Field experiments on the effectiveness of ‘eyespots’ as predator deterrents. Anim. Behav. 74, 1215–1227 10.1016/j.anbehav.2007.01.031 (doi:10.1016/j.anbehav.2007.01.031) [DOI] [Google Scholar]
- 47.Vallin A, Dimitrova M, Kodandaramaiah U, Merilaita S. 2011. Deflective effect and the effect of prey detectability on anti-predator function of eyespots. Behav. Ecol. Sociobiol. 65, 1629–1636 10.1007/s00265-011-1173-7 (doi:10.1007/s00265-011-1173-7) [DOI] [Google Scholar]
- 48.Lyytinen A, Brakefield PM, Mappes J. 2003. Significance of butterfly eyespots as an anti-predator device in ground-based and aerial attacks. Oikos 100, 373–379 10.1034/j.1600-0706.2003.11935.x (doi:10.1034/j.1600-0706.2003.11935.x) [DOI] [Google Scholar]
- 49.Vallin A, Jakobsson S, Wiklund C. 2007. An eye for an eye?—on the generality of the intimidating quality of eyespots in a butterfly and a hawkmoth. Behav. Ecol. Sociobiol. 61, 1419–1424 10.1007/s00265-007-0374-6 (doi:10.1007/s00265-007-0374-6) [DOI] [Google Scholar]
- 50.Vlieger L, Brakefield PM. 2007. The deflection hypothesis: eyespots on the margins of butterfly wings do not influence predation by lizards. Biol. J. Linn. Soc. 92, 661–667 10.1111/j.1095-8312.2007.00863.x (doi:10.1111/j.1095-8312.2007.00863.x) [DOI] [Google Scholar]
- 51.Freckleton RP. 2009. The seven deadly sins of comparative analysis. J. Evol. Biol. 22, 1367–1375 10.1111/j.1420-9101.2009.01757.x (doi:10.1111/j.1420-9101.2009.01757.x) [DOI] [PubMed] [Google Scholar]
- 52.West-Eberhard MJ. 1989. Phenotypic plasticity and the origins of diversity. Annu. Rev. Ecol. Syst. 20, 249–278 10.1146/annurev.es.20.110189.001341 (doi:10.1146/annurev.es.20.110189.001341) [DOI] [Google Scholar]
- 53.Hourigan TF. 1989. Environmental determinants of butterflyfish social systems. Environ. Biol. Fishes 25, 61–78 10.1007/BF00002201 (doi:10.1007/BF00002201) [DOI] [Google Scholar]
- 54.Robertson KA, Monteiro A. 2005. Female Bicyclus anynana butterflies choose males on the basis of their dorsal UV-reflective eyespot pupils. Proc. R. Soc. B 272, 1541–1546 10.1098/rspb.2005.3142 (doi:10.1098/rspb.2005.3142) [DOI] [PMC free article] [PubMed] [Google Scholar]
- 55.Oliver JC, Robertson KA, Monteiro A. 2009. Accommodating natural and sexual selection in butterfly wing pattern evolution. Proc. R. Soc. B 276, 2369–2375 10.1098/rspb.2009.0182 (doi:10.1098/rspb.2009.0182) [DOI] [PMC free article] [PubMed] [Google Scholar]
- 56.Turing AM. 1952. The chemical basis of morphogenesis. Phil. Trans. R. Soc. Lond. B 237, 37–72 10.1098/rstb.1952.0012 (doi:10.1098/rstb.1952.0012) [DOI] [PMC free article] [PubMed] [Google Scholar]
- 57.Dilao R, Sainhas J. 2004. Modelling butterfly wing eyespot patterns. Proc. R. Soc. Lond. B 271, 1565–1569 10.1098/rspb.2004.2761 (doi:10.1098/rspb.2004.2761) [DOI] [PMC free article] [PubMed] [Google Scholar]
- 58.Kondo S, Asai R. 1995. A reaction–diffusion wave on the skin of the marine angelfish Pomacanthus. Nature 376, 765–768 10.1038/376765a0 (doi:10.1038/376765a0) [DOI] [PubMed] [Google Scholar]
- 59.Ohno Y, Otaki JM. 2012. Eyespot colour pattern determination by serial induction in fish: mechanistic convergence with butterfly eyespots. Sci. Rep. 2, 290. [DOI] [PMC free article] [PubMed] [Google Scholar]
- 60.Reese ES. 1975. A comparative field study of the social behavior and related ecology of reef fishes of the family Chaetodontidae. Z. Tierpsychol. 37, 37–61 10.1111/j.1439-0310.1975.tb01126.x (doi:10.1111/j.1439-0310.1975.tb01126.x) [DOI] [PubMed] [Google Scholar]