

Abstract
Memory CD4+ T cells are central regulators of both humoral and cellular immune responses. T cell differentiation results in specific changes in chromatin structure and DNA methylation of cytokine genes. Although the methylation status of a limited number of gene loci in T cells has been examined, the genome-wide DNA methylation status of memory CD4+ T cells remains unexplored. To further elucidate the molecular signature of memory T cells, we conducted methylome and transcriptome analyses of memory CD4+ T cells generated using T cells from TCR-transgenic mice. The resulting genome-wide DNA methylation profile revealed 1144 differentially methylated regions (DMRs) across the murine genome during the process of T cell differentiation, 552 of which were associated with gene loci. Interestingly, the majority of these DMRs were located in introns. These DMRs included genes such as CXCR6, Tbox21, Chsy1, and Cish, which are associated with cytokine production, homing to bone marrow, and immune responses. Methylation changes in memory T cells exposed to specific Ag appeared to regulate enhancer activity rather than promoter activity of immunologically relevant genes. In addition, methylation profiles differed between memory T cell subsets, demonstrating a link between T cell methylation status and T cell differentiation. By comparing DMRs between naive and Ag-specific memory T cells, this study provides new insights into the functional status of memory T cells.
Introduction
CD4+ T cells are central regulators of both humoral and cellular immune responses. Activation of naive CD4+ T cells by Ag induces cell proliferation, resulting in the formation of a large number of effector cells and, subsequently, a limited number of memory cells. Memory CD4+ T cell populations are maintained by cytokine survival signals and homeostatic proliferation, such that they are able to respond rapidly to subsequent exposure to the same Ag (1, 2). Recently, it was reported that the first exposure of a naive T cell to Ag and cytokine signals results in specific changes in the cell’s chromatin structure and in DNA methylation of the cell’s cytokine genes (3–5).
Chromatin modifications are known to impose epigenetic controls on gene expression without changing DNA sequence (6). These modifications determine the level of cell type–specific gene transcription by modulating the accessibility of genes to transcription factors and the basal transcription apparatus. It is well known that epigenetic regulation is linked to gene repression of oncogenes and development-related genes (6, 7). Genes that are active (open) in a particular tissue or cell type have increased acetylation and methylation of their histones (e.g., H3K4 methylation), whereas genes that are inactive (closed) are characterized by highly condensed chromatin and decreased acetylation and methylation of their histones (e.g., H3K9 and H3K27 methylation). In addition, DNA methyltransferases establish and maintain the pattern of genomic DNA methylation of cytosines in CpG dinucleotides. DNA methylation status is generally considered to correlate inversely with transcriptional activity, with transcriptionally silent genes being highly methylated and transcriptionally active regions being relatively unmethylated (8, 9). DNA methylation is also associated with epigenetic gene regulation during embryogenesis, genomic imprinting, and X-chromosome inactivation (10, 11).
In the immune system, a lack of methylation at the appropriate loci in T and B lymphocytes is associated with transcription and rearrangement of Ig and TCR genes, as well as with cell lineage–specific expression of CD4, CD8, and CD21 (12–15). When naive T cells differentiate to Th1 cells, but not to Th2 cells, DNase hypersensitive sites appear in the IFN-γ gene (16). Furthermore, the IFN-γ gene is methylated to a lesser extent in human and murine Th1 and CD8 effector cells than in naive and Th2 cells. In contrast, the IL-4 and IL-5 genes are less methylated in Th2 cells than in Th1 cells. Treatment of T cells in vitro with drugs that inhibit histone deacetylases or DNA methylation increases IL-4 and IFN-γ expression. Moreover, naive T cells from conditional Dnmt1-knockout mice, which lack DNA (cytosine-5-)-methyltransferase 1, express substantially more IFN-γ and IL-4 after Ag activation, an effect that appears to be mediated, at least in part, by demethylation of the cis-regulatory element (17). Recently, it was demonstrated that demethylation of the FOXP3 locus is pivotal for differentiation of CD4+CD25+ regulatory T cells (18) and that the CpG regions of cell type–specific genes (e.g., IL2RA, CTLA4, and CD40LG) in conventional human CD4+ T cells and regulatory T cells are differentially methylated (19). A limiting DNA methylation affects the proliferative potential of Ag-specific CD8+ T cells with moderate effects on their differentiation to effector and memory CD8+ T cells (20). Additionally, methyl-CpG–binding domain protein 2–deficient mice display reduced memory CD8+ T cell differentiation following acute viral infection (21).
These findings indicate that DNA methylation is crucial for memory T cell development and cytokine production. However, in T cells, the DNA methylation status of only a limited number of genes has been examined. The genome-wide DNA methylation status of memory CD4+ T cells derived from Ag-stimulated naive cells remains unexplored. In this study, we investigated the gene-expression profiles and genome-wide DNA methylation status of naive and Ag-specific memory CD4+ murine T lymphocytes.
Materials and Methods
Mice
BALB/c mice were purchased from Clea (Tokyo, Japan). OVA-specific TCR-transgenic (Tg) mice (DO.11.10; OVA-specific TCR Tg × RAG2−/− mice) were maintained under specific pathogen–free conditions.
Reagents
The anti–CD4-Pacific Blue (RM4-5), anti-CD62L mAb (MEL-14), anti–CD25-PE (7D4), PE-conjugated anti-CD4 mAb (GK1.5-PE), anti–CD44-bio (IM7), anti–CD69-bio (H1.2F3), anti–CD127-bio (A7R34), IFN-γ–FITC (XMG1.2), anti–IL-4–Alexa Fluor 647 (11B11), anti–TNF-α–PE/Cy7 (MP6-XT22), anti-mouse TCR DO11.10-PerCP/Cy5.5 (KJ1-26), and streptavidin-allophycocyanin were purchased from BD Pharmingen and eBioscience.
Generation of effector and memory CD4+ T cells
OVA-specific naive CD4+ T cells were isolated from the spleens of DO11.10-Tg mice. To generate effector cells, naive CD4+ T cells were stimulated with 1 μg/ml an OVA peptide (residues 323–339; ISQAVHAAHAEINEAGRD; synthesized by Sigma Genosys, Hokkaido, Japan) plus allophycocyanin for 5 d in vitro (22). Five million of these cells were transferred i.v. into normal syngeneic BALB/c recipient mice. In most experiments, 4 wk after effector cell transfer, KJ1+ cells from the spleens of recipient mice were sorted by FACSVantage (BD Pharmingen) and used as memory CD4+ T cells.
Assays for cytokine production
Naive effector and memory KJ-1+CD4+ T cells were restimulated with PMA (20 ng/ml)/ionomycin (1 μg/ml) (P/I) and brefeldin A (10 μg/ml) for 5 h. Cells were then fixed (Cytofix buffer; BD Pharmingen), permeabilized, stained intracellularly with anti–IFN-γ Ab, anti–IL-4 Ab, or anti–TNF-α Ab or its isotype control, and analyzed using a Gallios Flow Cytometer (Beckman Coulter).
Methyl-sensitive cut counting library construction
The integrity of cDNA was confirmed using an Agilent 2100 Bioanalyzer prior to construction of the methyl-sensitive cut counting (MSCC) libraries. The protocol for MSCC library construction was modified slightly from that described previously (23).
Adapters A1 (5′-TTTCCACTACGCCTCCGCTTTCCTCTCTATGGGCAGTCGGTGATCCGAC-3′) and A2 (5′-CGGTCGGATCACCGACTGCCCATAGAGAGGAAAGCGGAGGCGTAGTGG-3′) contain a 5′ MmeI recognition site and a 5′-CG overhang; adapters B1 (5′-CGCCTTGGCCGTACAGCAGAGCTTACCGCAGAGAATGAGGAACCCGGGGCAG-3′) and B2 (5′-TTTCTGCCCCGGGTTCCTCATTCTCTGCGGTAAGCTCTGCTGTACGGCCAAGGCGNN-3′) contain a 3′-NN overhang and barcode (more information in Supplemental Table I), as described in the Applied Biosystems protocol. To construct the MSCC HpaII library, 1 μg genomic DNA isolated from CD4+ T cells was mixed with 8 U HpaII (New England BioLabs) in 1× NEBuffer 1 in a 50-μl reaction volume and incubated at 37°C for 12 h. Another 8 U HpaII was added, and the mixture was incubated at 37°C for an additional 3 h. DNA was purified by phenol-chloroform extraction and ethanol precipitation and resuspended in 12.5 μl dH2O. This 12.5-μl DNA solution was mixed with 1.5 μl a mixture containing 5 μM adaptor A1, 5 μM adaptor A2, and 10 U T4 DNA ligase (Invitrogen) before incubation at 16°C for 12 h. DNA was again purified by phenol-chloroform extraction and ethanol precipitation and resuspended in 8 μl dH2O. This DNA was run on a 10% nondenaturing Tris–acetate–EDTA (TAE) polyacrylamide gel, and the 60–80-bp band was purified. After ethanol precipitation, the DNA pellet was resuspended in 70 μl a reaction mixture containing 14 U MmeI (New England BioLabs), 50 μM S-adenosyl methionine, and 1× NEBuffer 4. This mixture was incubated at 37°C for 12 h, after which DNA was again purified by phenol-chloroform extraction and ethanol precipitation and resuspended in 13 μl dH2O. This DNA solution was mixed with 1 μl each 5.8 μM adaptor B1 and B2 and 10 U T4 DNA ligase, and the mixture was incubated at 16°C for 12 h. DNA was again purified and resuspended in 20 μl dH2O. This DNA solution was mixed with 10 U DNA polymerase I (New England BioLabs), 33 μM 2′-deoxynucleoside 5′-triphosphate, and 1× NEBuffer and incubated at 16°C for 30 min. DNA was again purified and resuspended in 8 μl dH2O. This DNA was run on a 9% nondenaturing TAE polyacrylamide gel, and the 120–140-bp band was purified. The purified DNA was then amplified by PCR using the primers 5′-CCACTACGCCTCCGCTTTCCTCTCTATGGGCAGTCGGTGAT-3′ and 5′-CTGCCCCGGGTTCCTCATTCTCT-3′. The 20-μl mixture for PCR contained 200 nM of each primer, 200 nM 2′-deoxynucleoside 5′-triphosphate, 1× PS buffer, and 1.25 U PrimeSTAR HS DNA polymerase (TaKaRa) and was run at 98°C for 30 s; 10 cycles at 98°C for 5 s, 62°C for 15 s, 72°C for 1 min; and then 72°C for 10 min. The PCR product was run on a 9% nondenaturing TAE polyacrylamide gel, and the 120–130-bp band was purified. The purified libraries were sequenced with the Applied Biosystems SOLiD4 system, following the manufacturer’s protocol. The integrity of the cDNA was confirmed using an Agilent 2100 Bioanalyzer prior to construction of the MSCC libraries. A 1-ng sample of size-fractionated cDNA was used for sequencing reactions.
Table I. Genome-wide methylation sequencing summary for CD4+ T cell DNA cut with HpaII or MspI restriction nuclease.
| Cell Type | Nuclease | No. of Hits in Genome | Unique Tagsa | % |
|---|---|---|---|---|
| Naive | HpaII | 9,902,632 | 5,074,880 | 51 |
| MspI | 12,994,381 | 5,499,474 | 42 | |
| Effector | HpaII | 9,349,718 | 6,039,406 | 65 |
| MspI | 9,673,142 | 6,140,353 | 63 | |
| Memory | HpaII | 13,582,273 | 7,055,612 | 52 |
| MspI | 9,943,128 | 4,193,004 | 42 | |
| Total | 65,445,274 | 34,002,729 | 52 |
Twenty-base pair MSCC tags were mapped in the genome.
Number of tags in restriction sites for analysis of DNA methylation.
An MspI control library was constructed in the same manner as the HpaII library, with the following exceptions: in the first step, 100 U MspI (New England BioLabs) was used instead of HpaII, and NEBuffer 2 was used instead of NEBuffer 1, and no amplification was performed following gel purification. All HpaII libraries were normalized to 5 million.
SOLiD BioScope software (version 1.3) was used to determine methyl-sensitive restriction enzyme scores and map MSCC sequence reads (20 bp from the MmeI restriction site) to the mouse genome assembly (NCBI37/mm9). A DNA-methylation score was defined as the sum of tag sequence hits (a plus-strand tag and a minus-strand tag) for each restriction enzyme site, in the absence of repetitive sites, and normalized to 106 reads by the specific enzyme. To avoid inaccurate identification of methylation sites, differentially methylated regions (DMRs) were defined as those with a change from 0 tags (high-methylation group) to >10 tags (low-methylation group).
Generation and sequencing of the 5′-serial analysis of gene expression library
A newly developed 5′-end mRNA collection method (24) has extended the range of the original 5′-end serial analysis of gene expression (SAGE) technique. This method initially profiles 25-nucleotide 5′-SAGE tags using a novel strategy that incorporates the oligo-capping method. The 5′-SAGE tags are then ligated directly to a linker for sequencing. The purified libraries were sequenced with a Solexa system, according to the manufacturer’s protocol (Illumina). The integrity of the cDNA was confirmed using an Agilent 2100 Bioanalyzer prior to construction of 5′-SAGE libraries. A 1-ng sample of size-fractionated cDNA was used for sequencing reactions with the Illumina GA, performed according to the manufacturer’s instructions. We assigned unique tags to RefSeq genes (University of California, Santa Cruz, http/hgdownload.cse.ucsc.edu/goldenPath/mm9/database/) when the start position of the tag was within 500 bp upstream of the transcription start site (TSS), based on RefSeq annotation.
Real-time PCR
cDNA was prepared from total RNA samples using an Applied Biosystems (Foster City, CA) cDNA Archive Kit and random primers. The assay was run in triplicate for each RNA sample, in accordance with the manufacturer’s recommendations, with each reaction containing 50 ng total cDNA (as total input RNA) per 20-μl reaction volume. The cycling conditions for SYBR Green dye I quantitative real-time PCR with 2× Applied Biosystems Universal Master Mix were 2 min at 50°C, 10 min at 95°C, followed by 40 rounds of 15 s at 95°C and 1 min at 60°C, with analysis by an Applied Biosystems 7500 PCR system. β-actin was used as the reference gene. Primer sequences are listed in Supplemental Table I. Data acquisition and analysis were performed using SDS 2.1 software in relative quantity mode, with each sample analyzed three times. After PCR, CT values were determined and used to calculate normalized 2−ΔΔCT values.
Luciferase reporter assay
Fragments of DMRs of the mouse Nr1D1, Ptgir, Tnfsf4, Tbx21, Cish, Chsy1, Sdf4, Hps4, Sema4d, Mtss1, Klf7, Wdfy2, Nr5a1, and MapK1lip1 loci were amplified by PCR using genomic DNA as a template and the primers shown in Supplemental Table I. To generate a luciferase reporter vector on a CpG-free background, the 500–800-bp PCR product was inserted into the pCpGL-CMV/EF1 vector (a gift from Dr. M. Rehli and Dr. M. Klug) using the In-Fusion cloning system (Clontech), replacing the CMV enhancer with the DMR regions (19).
The luciferase reporter vector pCpGL-Cish-DMR/EF1 was methylated in vitro using methylase SssI (New England BioLabs), according to the manufacturer’s instructions, followed by purification using a QIAquick PCR clean-up kit. In control samples using pCpGL-EF1 and pCpGL-Cish-DMR/EF1, the methyl-group donor S-adenosylmethionine was omitted. Successful methylation of the reporter plasmid containing the DMR was verified by reaction with the methylation-sensitive and methylation-resistant enzymes HpaII and MspI, respectively.
EL-4 T cells (5 × 10⁶ cells) were transfected with 2.5 μg either methylated or unmethylated pCpGL-DMR/EF1 vector or using a control plasmid with no insert, in triplicate. Synthetic Renilla luciferase reporter vector (pRL-TK; Promega) was cotransfected (1.5 μg) and served as an internal control for efficiency. EL-4 cells were electroporated with a Bio-Rad Gene Pulser at 270 V and a capacitance of 975 μF. Twelve hours later, transfected cells were stimulated with PMA (50 ng/ml) and ionomycin (0.5 μg/ml) for 16 h. The cells were harvested, and luciferase activity was measured by the Dual Luciferase Assay system using an Orion L luminometer. Firefly raw light unit data were normalized to Renilla luciferase activity and expressed relative to the control vector with no insert.
Gene ontology
Gene ontology was estimated using GOstat software (25).
Bisulfite sequencing
Bisulfite sequencing was performed to verify SOLiD data. Bisulfite modification of genomic DNA was performed using the EpiTect Bisulfite Kit (QIAGEN). We used Methyl Primer Express software (Applied Biosystems) to design primers. Bisulfite-treated DNA was amplified by PCR. The PCR products were cloned into the pCR2.1-TOPO vector and transformed into One Shot TOP10 Competent Cells (Invitrogen). At least 24 clones were sequenced using an ABI3730 Sequencer. The data were analyzed using QUMA, a quantification tool for methylation analysis (Riken Institute of Physical and Chemical Research, Yokohama, Japan).
Statistical analysis
Comparisons of each 5′-end tag were performed using Z-test statistics (24).
Accession number
5′-end and MSCC tags have been deposited in the National Center for Biotechnology Information Sequence Read Archive (http://www.ncbi.nlm.nih.gov/sra) under accession number SRP007816.
Results
Isolation of Ag-specific memory CD4+ T cells
To characterize memory T cells using methylome and transcriptome analysis, we generated memory CD4+ T cells from DO11.10 OVA-specific TCR-Tg mice. Splenic CD4+ T cells from the DO11.10-Tg mice were stimulated with an OVA323–339 peptide plus allophycocyanin for 5 d in vitro and then transferred i.v. into normal syngeneic BALB/c recipient mice. The transferred DO11.10-Tg T cells were monitored by staining with a clonotypic KJ1 mAb. At the time of transfer, cell surface marker expression was CD44high CD127+ CD25+ CD69+ and CD62L+, but by 4 wk after cell transfer the activation markers CD25 and CD69 were no longer expressed (Fig. 1A). These observations support the development of effector and memory T cell phenotypes, respectively. To confirm the functional status of these cells, cytokine-production profiles of naive and Ag-stimulated effector and memory cell populations were investigated. Within effector and memory T cell populations, 24 and 43%, respectively, expressed IFN-γ but not IL-4, within which 28 and 50% of cells coexpressed TNF-α (Fig. 1B).
FIGURE 1.

Surface marker and cytokine expression in naive and Ag-specific effector and memory CD4+ T cells. Splenic CD4+ T cells from DO11.10-Tg mice were stimulated with an OVA323–339 peptide plus APC for 5 d in vitro, resulting in Ag-specific effector cells, followed by transfer into normal syngeneic BALB/c recipient mice to generate memory cells. (A) Surface markers on CD4+ T cells (double positive for KJ1 and CD4, upper left panel) were analyzed by flow cytometry. (B) IFN-γ, IL-4, and TNF-α production by naive, effector, and memory CD4 T cells was assessed by intracellular cytokine staining.
DNA-methylation profiling in memory T cells
In this study, we used a recently developed MSCC method (23) that enables high-throughput, genome-wide identification of methylated CpG sites by SOLiD sequencing. Using the HpaII restriction nuclease, which recognizes unmethylated CCGG, most short-sequence tag fragments at HpaII cleavage sites can be uniquely mapped to genome locations. Methylation-sensitive restriction enzymes typically have a recognition site that contains a CpG dinucleotide, and cleavage is blocked if that site is methylated. Sites with many reads are inferred to have low methylation levels, whereas sites with few or no reads are inferred to have high methylation levels. The murine genome contains 1,594,139 CCGG sites, of which 1,130,065 (71%) can be uniquely mapped. Although each restriction enzyme site can generate two library tags, we considered the sum of tag sequences for each restriction enzyme site. A total of 619,060 sites (55%) was located within the promoter and gene body regions of unique genes, and 11% of these were within CpG islands (CGIs). A control library was also constructed by replacing HpaII with MspI, a methylation-insensitive isoschizomer of HpaII. The tags cut with MspI were used for determining zero-tag count or nonhit sites, because no tag from a HpaII library may correspond to a fully methylated site or false negative.
Using the SOLiD platform, ∼65 million reads of methylation tags from naive, effector, and memory CD4+ T cell genomes cut with HpaII or MspI were aligned to the mouse genome, with at most two mismatches, to allow for sequencing errors and single nucleotide polymorphisms. Thirty-four million (52%) of these tags were aligned to unique sites after repetitive sequences were excluded (Table I). These MSCC data were analyzed for the methylation levels of individual sites based on bisulfite sequencing. When MSCC tag counts and DNA methylation for randomly selected HapII sites were compared, the number of MSCC methylation tags correlated with the methylation levels derived from bisulfite data, consistent with results reported previously (23) (Fig. 2). Therefore, we defined three categories of methylation sites: low or hypo (median methylation <20%), intermediate (>20 to <80%), and high or hyper (>80%). A total of 65 and 64% of unique CpG sites in naive and memory CD4+ T cells, respectively, was hypermethylated, whereas 13% in both naive and memory cells had low methylation. Around TSSs, 28 and 31% of sites in naive and memory cells, respectively, were hypermethylated, whereas 45 and 41%, respectively, had low methylation. In addition, only 28 and 30% of CGIs in naive and memory cells, respectively, were methylated.
FIGURE 2.

The relationship between MSCC tag counts and bisulfite sequencing data. To validate the methylation levels determined by MSCC, we designed primers targeting 130 profiled locations in bisulfite-treated DNA and performed PCR amplification and Sanger sequencing of the PCR product. Horizontal lines represent median methylation as determined by bisulfite sequencing, boxes represent the quartiles, and whiskers mark the 5th and 95th percentiles. p < 0.01, Kruskal–Wallis H test.
Comparison of CpG methylation between naive and memory T cells
To observe changes in DNA methylation during T cell differentiation, the methylation status of CpG sites in gene-associated regions (the gene body including 500 bp upstream from the TSS) was compared between naive and memory T cells. When a DMR was defined as a change from 0 to >10 tags at sites cut by MspI, 1144 sites were identified as DMRs during T cell differentiation (Supplemental Table II). Fifty-one percent (552) of these DMRs were in gene-associated regions, and 467 sites associated with 437 genes were unmethylated in memory cells. In contrast, 85 sites associated with 84 genes were methylated in memory cells. The remaining 49% of the DMRs were in intergenic regions. Fig. 3 shows the DMR positions in the genome. The number of DMRs in the 5′-region (500 bp upstream from the TSS and first exon) was significantly lower than in other regions. Many DMRs were located in introns, with a few in CGIs. Our data indicated that DNA methylation in gene-promoter regions did not always correspond to a repressive epigenetic event in CD4+ T cells. It is well known that the region upstream of a gene, including the promoter, is important for gene expression. Thus, we examined the DNA methylation status of gene-upstream regions (promoter and first exon) for DMRs. Others investigators reported a correlation between the methylation status of adjacent CpG sites and a high incidence of short-range comethylation (26, 27). Eighty-eight percent of genes with DMRs showed hypomethylation in their promoter/first exon in naive and memory T cells (Table II). CpG methylation of the first intron and second exon of Cish and of the first intron of Tbx21, but not of the promoter regions, was different between naive and memory T cells (Fig. 4). The results of MSCC analysis of a series of DMRs was consistent with bisulfite sequencing data. These data suggest that DNA methylation in the gene body (introns and after second exons) may be characteristic of the memory cell phenotype. To identify the function of genes differentially methylated between naive and memory T cells, genes with DMRs were classified using the Gene Ontology Consortium database (GO) (Table III). Genes associated with cell communication, signal transduction, and intracellular signaling pathways tended to be hypomethylated in memory T cells. In contrast, genes associated with development processes and biological regulation tended to be hypomethylated in naive T cells.
FIGURE 3.
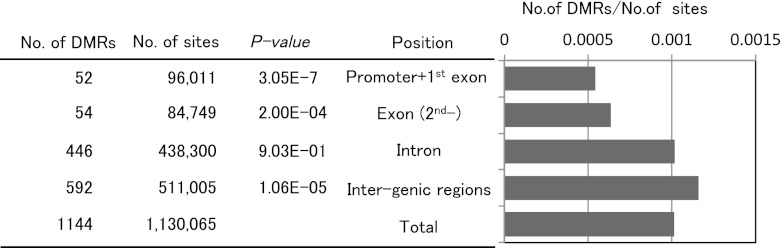
DMRs in DNA from naive and memory CD4+ T cells. DMRs were classified based on their location in promoter (up to 500 bp from a TSS, based on RefSeq annotation), exon, intron, and intergenic regions based on their position relative to known genes. The number of sites represents defined HpaII restriction sites. The p values were calculated using the Fisher exact test.
Table II. Methylation of the 5′-region of naive and memory CD4+ T cell genes with a DMR in an intron.
| No. of Tags |
||
|---|---|---|
| Naive cells | Memory cells | No. of Genes (%) |
| Hypomethylation (≥10) | Hypomethylation (≥10) | 273 (87.5) |
| Hypomethylation (≥10) | Hypermethylation (≤2) | 0 (0) |
| Hypermethylation (≤2) | Hypomethylation (≥10) | 1 (0.3) |
| Hypermethylation (≤2) | Hypermethylation (≤2) | 29 (9.3) |
| Obscure methylation | 9 (2.9) | |
| Total | 312 (100) | |
FIGURE 4.
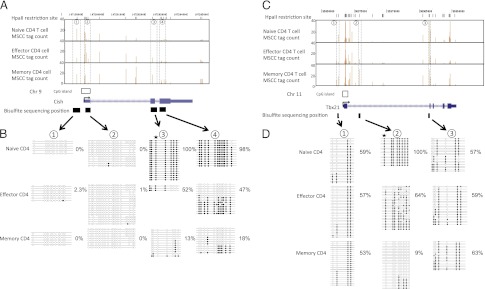
DMRs in the Cish and Tbx21 loci of naive, effector, and memory T cells. Genomic organization of the mouse Cish (A) and Tbx21 (C) loci, showing transcription start sites (arrows), single CGI (boxes), and exons (light blue). MSCC analysis of naive, effector, and memory T cells was across the 5′-end of each loci. Each vertical line (brown) represents a mean normalized tag from the MSCC analysis at the genomic location (listed on the x-axis) within the Cish and Tbx21 loci on chromosomes 9 and 11, respectively (University of California, Santa Cruz genome browser). Results of genomic bisulfite sequencing for Cish (B) and Tbx21 (D). Each row of circles represents an individual clone sequenced in the analysis after bisulfite treatment and PCR. Open circles indicate CpG sites at which no DNA methylation was detected. Filled circles indicate CpG sites that were methylated. Stars indicate the position of restriction sites detected by MSCC. Percentage values indicate the DNA methylation ratio of each region, as measured by bisulfite sequencing.
Table III. Gene ontology of DMR-associated genes.
| Best GO | Category | Count | Total | p Valuea |
|---|---|---|---|---|
| Hypomethylated in memory T cells | ||||
| GO:0007154 | Cell communication | 119 | 5560 | 3.49E−18 |
| GO:0007165 | Signal transduction | 111 | 5142 | 2.65E−17 |
| GO:0007242 | Intracellular signaling pathway | 55 | 1965 | 4.94E−14 |
| GO:0007267 | Cell–cell signaling | 25 | 640 | 5.25E−11 |
| GO:0032502 | Developmental process | 69 | 3347 | 1.20E−08 |
| GO:0007275 | Multicellular organismal development | 53 | 2299 | 1.20E−08 |
| GO:0032501 | Multicellular organismal process | 75 | 3822 | 2.33E−08 |
| GO:0048731 | System development | 39 | 1605 | 5.67E−07 |
| GO:0065007 | Biological regulation | 109 | 6731 | 7.44E−07 |
| GO:0050789 | Regulation of biological process | 101 | 6140 | 1.22E−06 |
| GO:0007215 | Glutamate signaling pathway | 6 | 21 | 3.93E−06 |
| GO:0048519 | Negative regulation of biological process | 30 | 1182 | 7.67E−06 |
| GO:0048856 | Anatomical structure development | 43 | 2005 | 8.94E−06 |
| GO:0009966 | Regulation of signal transduction | 23 | 800 | 8.94E−06 |
| GO:0048523 | Negative regulation of cellular process | 29 | 1137 | 8.96E−06 |
| Hypomethylated in memory T cells | ||||
| GO:0032502 | Developmental process | 19 | 3347 | 4.57E−06 |
| GO:0065007 | Biological regulation | 29 | 6731 | 4.57E−06 |
| GO:0050789 | Regulation of biological process | 27 | 6140 | 6.68E−06 |
| GO:0016070 | RNA metabolic process | 21 | 4155 | 8.43E−06 |
Each category was based on a p value < 1.0E−05.
DNA methylation and gene expression in memory T cells
To investigate the relationship between gene expression and changes in CpG methylation in DMRs, we analyzed the gene expression of naive cells, in vitro–activated effector cells, and memory CD4+ T cells using the Illumina/Solexa sequencing system. More than 12 million 25-base 5′-SAGE tags were obtained from the three libraries and matched to sequences in the murine genome (Table IV). Seventy-four percent of unique mapped tags were associated with RefSeq cDNA sequences, corresponding to ∼12,000–14,000 different protein-coding genes in this cell type (Supplemental Table III). The expression level of 1256 genes was significantly different between naive and effector cells, whereas 259 genes were expressed significantly differently between naive and memory cells (p < 0.001, >10-fold difference). The 30 genes with the largest relative difference between effector and naive cells and between memory and naive cells are listed in Table V.
Table IV. Summary of CD4+ T cell sequencing.
| Cell Type | Sequenced Tags | Unique Tags | Mapped Tags (one locus) | Tags in RefSeq | Gene No. | Gene No. (>1 copy) |
|---|---|---|---|---|---|---|
| CD4+ naive T cells | 12,088,592 | 7,883,186 | 4,122,853 | 3,382,975 | 14,064 | 8,715 |
| CD4+ effector T cells | 8,660,468 | 4,547,959 | 4,449,231 | 2,790,122 | 12,877 | 8,756 |
| CD4+ memory T cells | 11,442,151 | 6,258,543 | 3,916,175 | 3,179,174 | 13,384 | 8,138 |
Unique tags were aligned to a position unambiguously. Unique tags in TSSs were the number of unique tags mapped to regions within 500 bases of the representative TSSs of genes in the RefSeq database. Unique tags were categorized into three groups based on the number of mismatches in individual alignments. Effector T cells were generated from CD4+ T cells from DO11.10-Tg mice stimulated with an OVA peptide plus allophycocyanin conditions for 5 d in vitro. Memory CD4 T cells were isolated from spleen and lymph node at 4 wk after cell transfer. 1 copy = 20 tags/3 million tags, because human cells are predicted to contain 300,000 mRNA molecules.
Table V. Gene-expression profile of effector and memory CD4+ T cells compared with naive CD4+ T cells.
| No. of Tags in |
RefSeq | Description | ||
|---|---|---|---|---|
| Naive T Cells | Effector T Cells | Memory T Cells | ||
| Effector > Naive | ||||
| 0 | 54,848 | 4 | NM_008630 | Metallothionein 2 |
| 2 | 27,314 | 161 | NM_139198 | Placenta-specific 8 |
| 1 | 2,483 | 7 | NM_011340 | Serine or cysteine proteinase inhibitor clade |
| 0 | 1,837 | 66 | NM_001111099 | Cyclin-dependent kinase inhibitor 1A P21 |
| 1 | 1,620 | 19 | NM_145158 | Elastin microfibril interfacer 2 |
| 0 | 1,354 | 5 | NM_013542 | Granzyme B |
| 1 | 1,100 | 185 | NM_008519 | Leukotriene B4 receptor 1 |
| 5 | 6,117 | 7 | NM_009375 | Thyroglobulin |
| 1 | 931 | 5 | NM_133662 | Immediate early response 3 |
| 1 | 904 | 1 | NM_053095 | IL 24 |
| 0 | 895 | 20 | NM_021397 | Repressor of GATA |
| 2 | 1,461 | 17 | NM_007796 | CTL-associated protein 2 |
| 7 | 5,661 | 3819 | NM_026820 | IFN-induced transmembrane protein 1 |
| 11 | 7,979 | 94 | NM_010370 | Granzyme A |
| 0 | 713 | 4 | NM_001080815 | Gastric inhibitory polypeptide receptor |
| 0 | 543 | 21 | NM_008147 | gp49 A |
| 1 | 448 | 9 | NM_133720 | Cysteinyl leukotriene receptor 2 |
| 2 | 879 | 3 | NM_009150 | Selenium binding protein 1 |
| 50 | 22,626 | 82 | NM_011401 | Solute carrier family 2 facilitated glucose |
| 0 | 453 | 2 | NM_147776 | von Willebrand factor A domain–related protein |
| 3 | 1,202 | 81 | NM_011498 | Basic helix-loop-helix domain containing class |
| 2 | 724 | 0 | NM_008156 | GPI specific |
| 0 | 348 | 1 | NM_178241 | IL-8 receptor α |
| 63 | 21,938 | 26 | NM_013602 | Metallothionein 1 |
| 39 | 13,419 | 53 | NM_001077508 | TNF receptor superfamily |
| 1 | 299 | 38 | NM_008337 | IFN γ |
| 0 | 326 | 4 | NM_001004174 | Hypothetical protein LOC433470 |
| 0 | 325 | 0 | NM_207279 | Phosphatidylinositol-specific phospholipase C X |
| 0 | 322 | 21 | NM_013532 | Leukocyte Ig-like receptor |
| 0 | 319 | 0 | NM_009137 | Chemokine C-C motif ligand 22 |
| Effector < Naive | ||||
| 1517 | 0 | 159 | NM_009777 | Complement component 1 q subcomponent, B chain |
| 665 | 0 | 93 | NM_007574 | Complement component 1 q subcomponent, C chain |
| 590 | 0 | 39 | NM_007572 | Complement component 1 q subcomponent, A chain |
| 426 | 0 | 43 | NM_001083955 | Hemoglobin α adult chain 2 |
| 407 | 0 | 384 | NM_011703 | Vasoactive intestinal peptide receptor 1 |
| 3535 | 10 | 1,617 | NM_008052 | Deltex 1 homolog |
| 2037 | 7 | 121 | NM_001042605 | CD74 Ag isoform 1 |
| 306 | 0 | 4 | NM_019577 | Chemokine C-C motif ligand 24 |
| 289 | 0 | 14 | NM_007995 | Ficolin A |
| 313 | 1 | 13 | NM_001080934 | Solute carrier family 16 monocarboxylic acid |
| 219 | 0 | 5 | NM_001037859 | Colony stimulating factor 1 receptor |
| 178 | 0 | 139 | NM_033596 | Cistone cluster 2 H4 |
| 146 | 1 | 14 | NM_011414 | Secretory leukocyte peptidase inhibitor |
| 387 | 3 | 302 | NM_013832 | RAS protein activator like 1 GAP1 like |
| 120 | 0 | 19 | NM_133209 | Paired immunoglobulin-like type 2 receptor β |
| 117 | 0 | 9 | NM_008220 | Hemoglobin β adult major chain |
| 96 | 1 | 33 | NM_025806 | Hypothetical protein LOC66857 |
| 78 | 0 | 102 | NM_145227 | 2′-5′ oligoadenylate synthetase 2 |
| 78 | 0 | 163 | NM_178185 | Histone cluster 1 H2ao |
| 78 | 0 | 283 | NM_001033813 | Hypothetical protein LOC619310 |
| 85 | 1 | 7 | NM_008076 | γ-aminobutyric acid GABA-C receptor |
| 74 | 0 | 3 | NM_177686 | C-type lectin domain family 12 member a |
| 79 | 1 | 3 | NM_016704 | Complement component 6 |
| 71 | 1 | 6 | NM_009913 | Chemokine C-C motif receptor 9 |
| 64 | 0 | 11 | NM_138673 | Stabilin-2 |
| 64 | 0 | 9 | NM_001024932 | Paired immunoglobulin-like type 2 receptor β 2 |
| 69 | 1 | 5 | NM_011518 | Spleen tyrosine kinase |
| 523 | 9 | 28 | NM_009525 | Wingless-related MMTV integration site 5B |
| 59 | 0 | 4 | NM_009721 | Na+/K+ -ATPase β 1 subunit |
| 1615 | 28 | 734 | NM_010494 | ICAM 2 |
| Memory > Naive | ||||
| 7 | 5,661 | 3819 | NM_026820 | IFN-induced transmembrane protein 1 |
| 2 | 13 | 931 | NM_001099217 | Lymphocyte Ag 6 complex locus C2 |
| 15 | 59 | 3884 | NM_010741 | Lymphocyte Ag 6 complex locus C |
| 1 | 1,100 | 185 | NM_008519 | Leukotriene B4 receptor 1 |
| 2 | 122 | 360 | NM_015789 | Dickkopf-like 1 |
| 1 | 5 | 163 | NM_010553 | IL 18 receptor accessory protein |
| 0 | 309 | 179 | NM_031395 | Synaptotagmin-like 3 isoform a |
| 1 | 2 | 146 | NM_009915 | Chemokine C-C motif receptor 2 |
| 12 | 641 | 1,661 | NM_011313 | S100 calcium binding protein A6 calcyclin |
| 0 | 73 | 129 | NM_177716 | Hypothetical protein LOC239650 |
| 23 | 4,403 | 2,963 | NM_030694 | IFN-induced transmembrane protein 2 |
| 209 | 317 | 22,679 | NM_013653 | Chemokine C-C motif ligand 5 |
| 1 | 114 | 88 | NM_146064 | Acyl-CoA:cholesterol acyltransferase 2 |
| 1 | 3 | 84 | NM_133643 | EDAR ectodysplasin-A receptor–associated death |
| 2 | 27,314 | 161 | NM_139198 | Placenta-specific 8 |
| 3 | 16 | 224 | NM_013599 | Matrix metallopeptidase 9 |
| 1 | 53 | 70 | NM_030712 | Chemokine C-X-C motif receptor 6 |
| 4 | 72 | 268 | NM_011311 | S100 calcium binding protein A4 |
| 3 | 140 | 186 | NM_019507 | T-box 21 |
| 4 | 1,051 | 238 | NM_024253 | NK cell group 7 sequence |
| 0 | 1,837 | 66 | NM_001111099 | Cyclin-dependent kinase inhibitor 1A P21 |
| 1 | 4 | 59 | NM_016685 | Cartilage oligomeric matrix protein |
| 12 | 34 | 815 | NM_009910 | Chemokine C-X-C motif receptor 3 |
| 1 | 0 | 50 | NM_016958 | Keratin 14 |
| 1 | 41 | 44 | NM_008967 | PG I receptor IP |
| 132 | 729 | 5,823 | NM_001013384 | Podocan-like 1 |
| 0 | 31 | 43 | NM_010177 | Fas ligand TNF superfamily member 6 |
| 1 | 299 | 38 | NM_008337 | IFN γ |
| 1 | 1 | 37 | NM_010730 | Annexin A1 |
| 1 | 4 | 36 | NM_018734 | Guanylate nucleotide binding protein 4 |
| Naive > Memory | ||||
| 817 | 114 | 8 | NM_207231 | ADP-ribosylation-like factor 12 protein |
| 82 | 37 | 1 | NM_175274 | Tweety 3 |
| 306 | 0 | 4 | NM_019577 | Chemokine C-C motif ligand 24 |
| 75 | 74 | 0 | NM_010358 | Gst μ 1 |
| 61 | 52 | 1 | NM_011129 | Septin 4 |
| 53 | 63 | 1 | NM_027406 | Aldehyde dehydrogenase 1 family member l1 |
| 51 | 1 | 1 | NM_029162 | Zinc finger protein 509 |
| 51 | 0 | 1 | NM_008694 | Neutrophilic granule protein |
| 51 | 1 | 1 | NM_153510 | Paired immunoglobulin-like type 2 receptor α |
| 51 | 24 | 1 | NM_007405 | Adenylate cyclase 6 |
| 48 | 37 | 1 | NM_011984 | Homer homolog 3 |
| 148 | 5 | 3 | NM_009238 | SRY-box containing gene 4 |
| 46 | 12 | 1 | NM_013569 | Voltage-gated potassium channel subfamily H, |
| 44 | 10 | 1 | NM_026629 | Hypothetical protein LOC68235 |
| 43 | 25 | 1 | NM_011692 | Von Hippel-Lindau binding protein 1 |
| 219 | 0 | 5 | NM_001037859 | Colony stimulating factor 1 receptor |
| 115 | 22 | 3 | NM_008538 | Myristoylated alanine rich protein kinase C |
| 36 | 22 | 1 | NM_177758 | Zinc finger and SCAN domains 20 |
| 36 | 0 | 1 | NM_013612 | Solute carrier family 11 proton-coupled |
| 36 | 7 | 1 | NM_009223 | Stannin |
| 72 | 18 | 2 | NM_001033929 | Threonine synthase-like 2 |
| 36 | 53 | 0 | NM_011232 | RAD1 homolog |
| 94 | 18 | 3 | NM_011639 | Thyroid receptor-interacting protein 6 |
| 30 | 4 | 1 | NM_133921 | Ovarian zinc finger protein |
| 30 | 110 | 1 | NM_020006 | CDC42 effector protein Rho GTPase binding 4 |
| 33 | 16 | 0 | NM_009372 | TG-interacting factor |
| 29 | 1 | 1 | NM_013667 | Solute carrier family 22 member 2 |
| 28 | 14 | 1 | NM_030557 | Myoneurin |
| 177 | 25 | 6 | NM_001081127 | A disintegrin-like and metallopeptidase |
| 31 | 103 | 0 | NM_033612 | Elastase 1 pancreatic |
The 30 genes with the largest relative differences between effector and naive cells and between memory and naive cells are listed. The total number of tags from naive (3,382,975), effector (2,790,122), and memory (3,179,174) cells was normalized to 3,000,000.
When gene-expression levels and DMRs were compared between naive and memory CD4 T cells, 24 DMRs were associated with increased expression of genes (e.g., CXCR6, Tbox21, Chsy1, and Cish) in memory cells compared with naive cells (>10 tags and >4-fold difference) (Table VI). In contrast, 27 DMRs were associated with decreased expression of other genes (e.g., Maff, Ephb6, and Trpm2). Classification using GO revealed that these genes are related to signal transduction, cell communication, and immune responses. These findings indicate that key genes relating to the memory phenotype undergo variable changes in DNA methylation during CD4+ T cell differentiation.
Table VI. Correlation between DNA methylation and gene expression in naive, effector, and memory CD4+ T cells.
| Restriction Site | Chr | No. of Nucleotides from Nearest TSS | Symbol | Description | RefSeq | Position | Distance from Nearest CGI (bp) | DNA Methylation Scorea |
Gene Expression |
|||||||||
|---|---|---|---|---|---|---|---|---|---|---|---|---|---|---|---|---|---|---|
| Naive Cell HpaII | Naive Cell MspI | Effector Cell HpaII | Effector Cell MspI | Memory Cell HpaII | Memory Cell MspI | N4/M4 Fold | M4/N4 Fold | Naive CD4 | Effector CD4 | Memory CD4 | ||||||||
| 123716994 | Chr9 | 1,392 | Cxcr6 | Chemokine C-X-C motif receptor 6 | NM_030712 | Intron1 | 43,618 | 0 | 5 | 2 | 7 | 18 | 4 | 0 | 78 | 1 | 53 | 70 |
| 96974152 | Chr11 | 2,440 | Tbx21 | T-box 21 | NM_019507 | Intron1 | −1,727 | 0 | 2 | 8 | 8 | 30 | 5 | 0 | 69 | 3 | 140 | 186 |
| 17493213 | Chr7 | 1,375 | Ptgir | PG I receptor IP | NM_008967 | Intron1 | −876 | 0 | 10 | 5 | 6 | 11 | 6 | 0 | 49 | 1 | 41 | 44 |
| 73291652 | Chr7 | 37,252 | Chsy1 | Carbohydrate chondroitin synthase 1 | NM_001081163 | Intron2 | −37,769 | 0 | 10 | 8 | 9 | 48 | 6 | 0 | 20 | 16 | 127 | 326 |
| 9453075 | Chr15 | 6,536 | Il7r | IL 7 receptor precursor | NM_008372 | Intron2 | 383,054 | 0 | 4 | 6 | 1 | 13 | 5 | 0 | 17 | 29 | 198 | 498 |
| 151561336 | Chr4 | 9,094 | Acot7 | Acyl-CoA thioesterase 7 | NM_133348 | Intron1 | −9,631 | 0 | 5 | 5 | 6 | 12 | 4 | 0 | 14 | 66 | 289 | 949 |
| 107202323 | Chr9 | 3,304 | Cish | Cytokine inducible SH2-containing protein | NM_009895 | Exon_2/3 | −3,446 | 0 | 1 | 8 | 9 | 17 | 5 | 0 | 10 | 53 | 5018 | 528 |
| 107201507 | Chr9 | 2,488 | Cish | Cytokine inducible SH2-containing protein | NM_009895 | Intron1 | −2,630 | 0 | 2 | 0 | 0 | 12 | 1 | 0 | 10 | 53 | 5018 | 528 |
| 112879061 | Chr6 | 17,427 | Srgap3 | SLIT-ROBO Rho GTPase activating protein 3 | NM_080448 | Intron1 | −117,067 | 0 | 16 | 10 | 10 | 20 | 14 | 0 | 9 | 5 | 241 | 46 |
| 41404992 | Chr19 | 54,614 | Pik3ap1 | Phosphoinositide-3-kinase adaptor protein 1 | NM_031376 | Intron3 | −45,447 | 0 | 4 | 4 | 2 | 17 | 4 | 0 | 5 | 5 | 14 | 28 |
| 41404611 | Chr19 | 54,995 | Pik3ap1 | Phosphoinositide-3-kinase adaptor protein 1 | NM_031376 | Intron3 | −45,828 | 0 | 11 | 9 | 15 | 11 | 9 | 0 | 5 | 5 | 14 | 28 |
| 43981837 | Chr4 | 11,264 | Glipr2 | GLI pathogenesis–related 2 | NM_027450 | Intron3 | −11,607 | 0 | 6 | 1 | 2 | 32 | 2 | 0 | 5 | 59 | 795 | 285 |
| 52379040 | Chr2 | 153,059 | Cacnb4 | Calcium channel voltage–dependent, β 4 | NM_001037099 | Intron2 | 99,263 | 0 | 7 | 7 | 10 | 34 | 6 | 0 | 4 | 6 | 3 | 26 |
| 60189952 | Chr2 | 31,367 | Ly75 | Lymphocyte Ag 75 | NM_013825 | Intron11 | −31,177 | 0 | 1 | 4 | 2 | 12 | 5 | 0 | 4 | 12 | 56 | 47 |
| 29371127 | Chr17 | 3,606 | Cpne5 | Copine V | NM_153166 | Intron1 | −3,256 | 0 | 10 | 3 | 11 | 11 | 8 | 0 | 4 | 4 | 37 | 18 |
| 44355013 | Chr17 | 29,493 | Clic5 | Chloride intracellular channel 5 | NM_172621 | Intron1 | −29,555 | 0 | 7 | 10 | 5 | 52 | 9 | 0 | 4 | 4 | 8 | 14 |
| 28393931 | Chr2 | 25,081 | Ralgds | Ral guanine nucleotide dissociation stimulator | NM_009058 | Intron1 | −4,975 | 0 | 8 | 13 | 15 | 10 | 1 | 0 | 4 | 8 | 81 | 32 |
| 155388145 | Chr4 | 342 | Tnfrsf4 | TNF receptor superfamily | NM_011659 | Intron1 | 20,771 | 0 | 5 | 21 | 6 | 22 | 3 | 0 | 4 | 394 | 5522 | 1455 |
| 79745901 | Chr17 | 8,528 | Cdc42ep3 | CDC42 effector protein Rho GTPase binding 3 | NM_026514 | Intron1 | −7,859 | 0 | 9 | 3 | 14 | 15 | 3 | 0 | 4 | 5 | 2 | 19 |
| 27822267 | Chr2 | 80,063 | Col5a1 | Procollagen type V, α 1 | NM_015734 | Intron16 | −80,584 | 0 | 16 | 3 | 9 | 11 | 10 | 0 | 4 | 4 | 1 | 12 |
| 41565822 | Chr6 | 10,256 | Ephb6 | Eph receptor B6 | NM_007680 | Intron6 | −10,660 | 0 | 10 | 7 | 5 | 10 | 11 | 12 | 0 | 207 | 11 | 17 |
| 77375561 | Chr10 | 54,639 | Trpm2 | Transient receptor potential cation channel | NM_138301 | Intron29 | 10,730 | 0 | 5 | 12 | 8 | 10 | 3 | 11 | 0 | 21 | 2 | 2 |
| 58854000 | Chr15 | 59,542 | Mtss1 | Actin monomer-binding protein | NM_144800 | Intron3 | −58,831 | 0 | 4 | 15 | 6 | 21 | 3 | 9 | 0 | 179 | 60 | 19 |
| 79178744 | Chr15 | 637 | Maff | V-maf musculoaponeurotic fibrosarcoma oncogene | NM_010755 | Intron1 | −1,005 | 0 | 2 | 0 | 1 | 16 | 1 | 9 | 0 | 25 | 122 | 3 |
| 38564748 | Chr2 | 5,312 | Nr5a1 | Nuclear receptor subfamily 5 group A, member 1 | NM_139051 | Intron3 | −1,049 | 0 | 9 | 1 | 0 | 10 | 2 | 9 | 0 | 17 | 13 | 2 |
| 75013736 | Chr12 | 4,720 | Hif1a | Hypoxia inducible factor 1 α subunit | NM_010431 | Intron1 | −5,274 | 0 | 10 | 11 | 7 | 21 | 4 | 8 | 0 | 59 | 276 | 8 |
| 49653434 | Chr2 | 10,229 | 2310010M24Rik | Hypothetical protein LOC71897 | NM_027990 | Intron1 | −10,474 | 0 | 7 | 2 | 10 | 13 | 7 | 7 | 0 | 51 | 11 | 8 |
| 124129324 | Chr5 | 4,974 | Clip1 | Restin | NM_019765 | Intron1 | −4,195 | 0 | 1 | 8 | 7 | 10 | 2 | 7 | 0 | 289 | 61 | 44 |
| 124474362 | Chr5 | 7,905 | Vps37b | Vacuolar protein sorting 37B | NM_177876 | Intron1 | −7,571 | 0 | 15 | 0 | 6 | 10 | 10 | 6 | 0 | 2537 | 1085 | 394 |
| 63517774 | Chr14 | 61,260 | Wdfy2 | WD repeat and FYVE domain containing 2 | NM_175546 | Intron2 | −61,692 | 0 | 4 | 35 | 7 | 25 | 2 | 6 | 0 | 30 | 17 | 5 |
| 56872366 | Chr18 | 4,840 | Lmnb1 | Lamin B1 | NM_010721 | Intron1 | −5,420 | 0 | 5 | 1 | 6 | 18 | 2 | 6 | 0 | 73 | 53 | 12 |
| 3378068 | Chr10 | 179,872 | Oprm1 | Opioid receptor μ 1 | NM_001039652 | Intron3 | 243,866 | 0 | 7 | 3 | 14 | 14 | 6 | 5 | 0 | 30 | 3 | 6 |
| 5574804 | Chr10 | 159,689 | Esr1 | Estrogen receptor 1 α | NM_007956 | Intron3 | −58,813 | 0 | 16 | 1 | 9 | 11 | 13 | 5 | 0 | 46 | 7 | 9 |
| 66089658 | Chr17 | 32,361 | Rab31 | Rab31-like | NM_133685 | Intron1 | −31,962 | 0 | 3 | 5 | 4 | 23 | 5 | 5 | 0 | 19 | 27 | 4 |
| 54300515 | Chr13 | 13,018 | Hrh2 | Histamine receptor H 2 isoform 1 | NM_001010973 | Intron1 | −13,119 | 0 | 6 | 1 | 10 | 14 | 0 | 5 | 0 | 32 | 4 | 7 |
| 71926521 | Chr12 | 21 | Frmd6 | FERM domain containing 6 | NM_028127 | Exon_1/14_first exon | 0 | 0 | 4 | 8 | 0 | 14 | 1 | 4 | 0 | 38 | 31 | 9 |
| 58574849 | Chr6 | 28,184 | Abcg2 | ATP-binding cassette subfamily G, member 2 | NM_011920 | Intron1 | 15,477 | 0 | 6 | 7 | 1 | 10 | 0 | 4 | 0 | 39 | 103 | 9 |
| 88790629 | Chr12 | 5,768 | 1810035L17Rik | Hypothetical protein LOC380773 | NM_026958 | Intron3 | −6,286 | 0 | 4 | 6 | 2 | 15 | 9 | 4 | 0 | 34 | 130 | 9 |
| 64135805 | Chr1 | 32,156 | Klf7 | Kruppel-like factor 7 ubiquitous | NM_033563 | Intron1 | −32,381 | 0 | 6 | 4 | 11 | 17 | 1 | 4 | 0 | 108 | 48 | 27 |
| 21359913 | Chr2 | 70,720 | Gpr158 | G protein–coupled receptor 158 | NM_001004761 | Intron2 | −69,515 | 0 | 8 | 0 | 3 | 13 | 10 | 4 | 0 | 11 | 3 | 3 |
| 13609664 | Chr8 | 67,921 | Rasa3 | RAS p21 protein activator 3 | NM_009025 | intron3 | −67,326 | 0 | 8 | 5 | 2 | 14 | 6 | 4 | 0 | 570 | 349 | 157 |
| 24828918 | Chr8 | 48,754 | Zmat4 | Zinc finger matrin type 4 | NM_177086 | intron1 | −48,830 | 0 | 10 | 3 | 14 | 11 | 16 | 4 | 0 | 40 | 5 | 11 |
| 146036806 | Chr7 | 1,142 | Mapk1ip1 | MAPK-interacting and spindle-stabilizing | NM_001045483 | intron1 | −827 | 0 | 7 | 3 | 5 | 11 | 5 | 4 | 0 | 233 | 152 | 66 |
| 96960335 | Chr11 | 16,257 | Tbx21 | T-box 21 | NM_019507 | Exon_6/6_lastExon | −15,544 | 19 | 1 | 1 | 0 | 0 | 2 | 0 | 69 | 3 | 140 | 186 |
| 94729332 | Chr1 | 1,070 | Gpc1 | Glypican 1 | NM_016696 | Intron1 | 0 | 16 | 2 | 0 | 0 | 0 | 1 | 0 | 21 | 11 | 22 | 227 |
| 128915487 | Chr4 | 10,198 | C77080 | Hypothetical protein LOC97130 | NM_001033189 | Intron1 | −581 | 12 | 3 | 1 | 1 | 0 | 2 | 0 | 6 | 3 | 3 | 15 |
| 148238956 | Chr4 | 60,456 | Casz1 | Castor homolog 1 zinc finger | NM_027195 | Intron2 | 26,131 | 10 | 17 | 1 | 16 | 0 | 7 | 0 | 4 | 10 | 13 | 36 |
| 120328900 | Chr2 | 39,292 | Capn3 | Calpain 3 isoform a | NM_007601 | Exon_21/24 | 60,309 | 15 | 7 | 2 | 6 | 0 | 13 | 22 | 0 | 61 | 9 | 3 |
| 35990963 | Chr18 | 1,492 | Cxxc5 | CXXC finger 5 | NM_133687 | Intron1 | 0 | 28 | 4 | 9 | 2 | 0 | 1 | 13 | 0 | 12 | 22 | 1 |
| 126838794 | Chr8 | 83,501 | Galnt2 | UDP-N-acetyl-α-D-galactosamine:polypeptide | NM_139272 | Intron3 | −83,718 | 16 | 5 | 0 | 2 | 0 | 1 | 8 | 0 | 128 | 55 | 16 |
| 63546881 | Chr14 | 90,367 | Wdfy2 | WD repeat and FYVE domain containing 2 | NM_175546 | Intron4 | −90,799 | 20 | 1 | 1 | 9 | 0 | 6 | 6 | 0 | 30 | 17 | 5 |
The category was represented using the criteria of DMRs (changing from 0 to >10 tags at the sites able to be digested by MspI between naive and memory CD4 T cells) and gene expression (memory or naive; >10 tags and >4-fold difference). Each number of gene-expression tags from naive (3,382,975), effector (2,790,122), and memory (3,179,174) cells was normalized to 3,000,000.
DNA methylation score is described in Materials and Methods.
The relationship between DNA methylation and enhancer activity
To examine the functional implications of these DMRs, we constructed a luciferase reporter vector consisting of the EF1 promoter and sequences derived from the DMR in the introns of 15 genes, which positively and negatively correlated with gene expression. Transient transfections were performed in untreated or P/I-treated EL-4 T cells using unmethylated (CpG) or in vitro SssI-methylated (mCpG) reporter plasmids. The transcriptional activity of the luciferase reporter construct containing the DMR of Ptgir, Tnfsf4, Tbx21, Cish, Chsy1, IL7r, and Acot7 genes was 2-fold greater than that of the empty control vector (pCpGL-EF1) (Fig. 5). For these genes, transcriptional activation was reduced following in vitro methylation of the CpGs in the corresponding DMRs, demonstrating a suppressive effect of methylation on enhancer function. In contrast, for the luciferase reporter constructs containing the DMR of seven of the eight genes that showed reduced expression in memory cells compared with naive cells, transcriptional activity was unchanged relative to the empty control vector. Further validation confirmed that MSCC tag counts correlated with bisulfite-sequencing data for these genes. For example, DMRs in Klf7 and Mapk1ip1 had higher MSCC counts in memory cells (indicating less DNA methylation) but higher expression levels in naive cells (Fig. 6). Thus, although these DMRs may possess an alternative function, such as inhibition of silencer binding to the gene region, they do not influence enhancer activity.
FIGURE 5.

Transcriptional activity of a luciferase reporter gene in unmethylated and methylated DMR sequences from the introns of 15 genes. Transient transfections were performed with a control plasmid (pCpGL-EF1 promoter) or pCpGL-EF-DMR in P/I-treated EL-4 T cells using unmethylated (CpG) or in vitro SssI methylated (mCpG) reporter plasmids. Firefly raw light unit (RLU) data were normalized to Renilla luciferase activity relative to the control vector with no insert. *p < 0.05, unmethylated versus methylated plasmids, paired Student t test.
FIGURE 6.

DMRs in the Mapk1ip1 and Klf7 loci of naive and memory T cells. Genomic organization of the mouse Klf7 (A) and Mapk1ip1 (D) loci showing transcription start sites (→), exons (black boxes), DMRs that were detected by MSCC (↑), and bisulfite sequencing positions (white boxes). (B and E) Results of genomic bisulfite sequencing, where each row of circles represents an individual clone sequenced following bisulfite treatment and PCR. Open circles indicate CpG sites at which no DNA methylation was detected. Stars indicate the position of restriction sites detected by MSCC. Filled circles indicate CpG sites that were methylated. (C and F) Downregulated gene expression in memory CD4 T cells measured by quantitative real-time PCR. RT-PCR was performed as described in Materials and Methods.
DNA methylation status in T cell subsets
We next investigated DNA methylation in effector CD4+ T cells. Effector CD4+ T cells were isolated 5 d after Ag stimulation for gene-expression analysis. Interestingly, DMR methylation in effector cells followed different kinetics during differentiation compared with naive and memory cells. DMRs were classified into six distinct groups by DNA-methylation analysis (Table VII). Twenty-seven percent of DMRs were hypermethylated in naive and effector cells but were hypomethylated in memory cells (pattern 1). For example, the extent of DNA methylation in the DMR of CXCR6 was 92% in naive cells, 80% in effector cells, and 6% in memory T cells (Supplemental Fig. 1). Moreover, 43% of DMRs were hypermethylated in the naive phase, intermediately methylated in the effector phase, and hypomethylated in the memory phase (pattern 2). In Cish, for example, DNA methylation in the DMR in the second exon was 100% in naive cells, 52% in effector cells, and 13% in memory cells. An additional 17% of DMRs were hypermethylated in naive cells, intermediately methylated in effector cells, and hypomethylated in memory cells (pattern 3). GO classifications for each DMR methylation pattern revealed that genes in pattern 1 mostly fell into GO categories related to cell communication and signal transduction, whereas genes in pattern 3 aligned with GO categories related to negative regulation of cellular processes (Table VIII). These data indicate that the timing of methylation changes during T cell differentiation is regulated independently for each gene.
Table VII. DNA methylation status of DMRs in naive, effector, and memory CD4+ T cells.
| Pattern | DNA Methylation Status |
No. of DMR (%) | ||
|---|---|---|---|---|
| Naive | Effector | Memory | ||
| 1 | High | High | Low | 314 (27%) |
| 2 | High | Int | Low | 495 (43%) |
| 3 | High | Low | Low | 198 (17%) |
| 4 | Low | Low | High | 25 (2%) |
| 5 | Low | Int | High | 42 (4%) |
| 6 | Low | High | High | 70 (6%) |
| Total | 1144 (100%) | |||
High, High methylation status (≤2); Int, intermediate methylation status (3–9 tags); Low, low methylation status (>9 tags).
Table VIII. GOs classified by methylation state of DMRs in effector cells.
| GO | Genes | Count | Total | p Value |
|---|---|---|---|---|
| Hyper(N)-Hyper(E)-Hypo(M) | ||||
| GO:0007154 | Cell communication | 25 | 5560 | 0.00507 |
| GO:0007165 | Signal transduction | 23 | 5142 | 0.00772 |
| GO:0016477 | Cell migration | 5 | 233 | 0.00772 |
| GO:0006928 | Cell motility | 6 | 383 | 0.00772 |
| GO:0051674 | Localization of cell | 6 | 383 | 0.00772 |
| GO:0022610 | Biological adhesion | 9 | 960 | 0.00772 |
| GO:0007155 | Cell adhesion | 9 | 960 | 0.00772 |
| Hyper(N)-Int(E)-Hypo(M) | ||||
| GO:0007154 | Cell communication | 74 | 5560 | 6.09E−12 |
| GO:0007165 | Signal transduction | 69 | 5142 | 2.71E−10 |
| GO:0007242 | Intracellular signal transduction | 33 | 1965 | 2.85E−07 |
| GO:0007275 | Multicellular organismal development | 33 | 2299 | 6.72E−05 |
| GO:0007267 | Cell–cell signaling | 17 | 640 | 8.05E−05 |
| GO:0032502 | Developmental process | 42 | 3347 | 0.000126 |
| GO:0051179 | Localization | 51 | 4481 | 0.000243 |
| GO:0007215 | Glutamate signaling pathway | 4 | 21 | 0.00075 |
| GO:0032501 | Multicellular organismal process | 44 | 3822 | 0.000793 |
| GO:0009966 | Regulation of signal transduction | 17 | 800 | 0.000793 |
| GO:0048731 | System development | 23 | 1605 | 0.00236 |
| GO:0051234 | Establishment localization | 45 | 4135 | 0.00298 |
| GO:0006810 | Transport | 44 | 4035 | 0.00327 |
| GO:0050789 | Regulation of biological process | 60 | 6140 | 0.00428 |
| GO:0007268 | Synaptic transmission | 9 | 290 | 0.00434 |
| GO:0048856 | Anatomical structure development | 26 | 2005 | 0.00472 |
| GO:0065007 | Biological regulation | 64 | 6731 | 0.00472 |
| Hyper(N)-Hypo(E)-Hypo(M) | ||||
| GO:0048523 | Negative regulation of cellular process | 13 | 1137 | 0.000127 |
| GO:0048519 | Negative regulation of biological process | 13 | 1182 | 0.000127 |
| GO:0050794 | Regulation of cellular process | 26 | 5704 | 0.000748 |
| GO:0065007 | Biological regulation | 28 | 6731 | 0.00227 |
| GO:0050789 | Regulation of biological process | 26 | 6140 | 0.00289 |
| GO:0018212 | Peptidyl-tyrosine modification | 3 | 44 | 0.0064 |
| GO:0007242 | Intracellular signal transduction | 13 | 1965 | 0.0072 |
| GO:0007165 | Signal transduction | 22 | 5142 | 0.00765 |
| GO:0007154 | Cell communication | 23 | 5560 | 0.00893 |
| Hypo(N)-Int(E)-Hyper(M) | ||||
| GO:0007275 | Multicellular organismal development | 9 | 2299 | 0.00989 |
| GO:0032501 | Multicellular organismal process | 11 | 3822 | 0.00989 |
| Hypo(N)-Hypo(E)-Hyper(M) | ||||
| None | ||||
| Hypo(N)-Hyper(E)-Hyper(M) | ||||
| None |
GOs with a p value < 0.01 are shown.
E, Effector T cells; Hyper, hypermethylation status (more than nine tags); Hypo, hypomethylation status (two or fewer tags); Int, intermediate methylation status (three to nine tags); M, memory T cells; N, naive T cells.
It is well known that central and effector memory T cells are distinct in their differentiation status. Therefore, we also investigated the DNA methylation status of selected DMRs in subpopulations of central and effector memory CD4+ T cells from an untreated conventional BALB/c mouse. These DMRs were different across various T cell subsets, reinforcing the finding that the methylation status of T cell subsets reflects T cell differentiation (Fig. 7).
FIGURE 7.
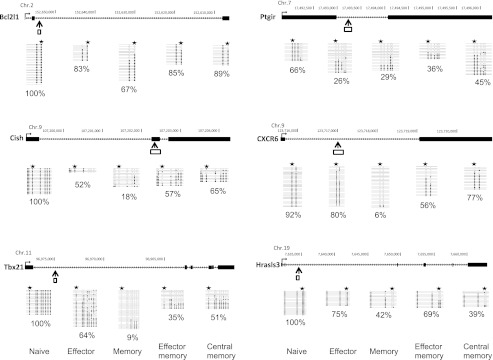
DNA methylation status of selected DMRs in subpopulations of central and effector memory CD4+ T cells. CD62L+ CCR7+ and CD62L− CCR7− CD4 T cells from BALB/c mice were isolated to represent “central memory” and “effector memory” T cells, respectively. Genomic organization of the mouse Cish, Hrasls3, Tbx21, CXCR6, Bcl2l1, and Ptgir loci, showing transcription start sites (→), exons (black box), DMRs that were detected by MSCC (↑), and bisulfite sequencing position (white box). Graphs show results of genomic bisulfite sequencing, where each row of circles represents an individual clone sequenced in the analysis after bisulfite treatment and PCR. Open circles indicate CpG sites at which no DNA methylation was detected. Filled circles indicate CpG sites that were methylated. Stars indicate the position of restriction sites detected by MSCC. Percentage values indicate the DNA methylation ratio of each region, as measured by bisulfite sequencing.
Discussion
Following activation with Ag, naive T cells differentiate into short-lived effector T cells and long-lived memory T cells. However, the molecular mechanisms behind the generation and maintenance of memory CD4+ T cells remain unclear. To address this problem, we studied changes in epigenetic modification and gene expression in Ag-specific CD4+ T cells using massive parallel DNA sequencing.
Phenotypically, both naive and memory T cell subsets are made up of small resting cells with upregulated IL-7R expression, which is necessary for their survival in vivo. Effector and memory T cells exhibit increased expression of adhesion markers (e.g., CD44 and LFA-1) and decreased expression of the lymph node homing receptor CD62L (28). This expression pattern was confirmed in the current study. Furthermore, our analyses indicated that, compared with naive CD4+ T cells, the genes that were upregulated in memory CD4+ T cells (e.g., IL-7R, Bcl2, Bcl2l1, and Cdkn1a and the chemokine-related genes CCL5, CCR2, CXCR6, and CXCR3) were related to cytokine production and development and maintenance of the memory phase. Expression of the Th1 genes IFN-γ, Tbox21, and IL18RAP also increased in memory CD4+ T cells. In addition, the expression of several other genes [i.e., IFN-induced trans-membrane protein 1 (IFITM1) (29), Dkkl1 (30), and Il18rap (31)], which are related to proliferative capacity and Th1-type immunological reactions, increased in memory CD4+ T cells compared with naive T cells.
It is well known that gene expression involves activation of transcription factors and/or epigenetic changes in the genome. CpG dinucleotides upstream of genes that are active in a particular tissue or cell type are less methylated, whereas inactive genes are surrounded by highly condensed chromatin and have densely methylated upstream CpG dinucleotides. A useful technique for gauging gene accessibility in the chromatin context is to monitor sensitivity of the relevant DNA sequences to digestion with DNaseI in intact nuclei (32). In general, genome sites encoding genes located in active chromatin that are actively transcribed or that have the potential to be transcribed upon stimulation are more sensitive to DNase I digestion than are sites encoding genes in inactive or closed chromatin. In this study, we used the recently developed MSCC method that enables cost-effective, high-throughput, genome-wide identification of methylated CpG sites. We identified 1,144 regions in the mouse genome that were differentially methylated in the process of T cell differentiation. All of these DMRs were in gene body sites without CGIs, highlighting the fact that DNA methylation can occur at sites other than CGIs. Irizarry et al. (33) reported that methylation of CGI shores that exist in close proximity (∼2 kb) to CGIs is closely associated with transcriptional inactivation. Most tissue-specific DNA methylation seems not to occur within CGI, but rather at CGI shores. However, our data demonstrate that most DMRs in naive and memory CD4+ T cells are not associated with CGI or CGI shores. Furthermore, most DMRs in naive and memory CD4+ T cells were located in gene bodies, rather than in the promoter regions, as is the case for tumor cells.
Of the DMRs identified in naive and memory CD4+ T cells, 51 were potentially associated with gene expression. Gene body methylation is common in ubiquitously expressed genes and is correlated with gene expression (23). Furthermore, intergenic methylation recently was reported to play a major role in regulating cell context–specific alternative promoters in gene bodies (34). In contrast, several groups (19, 35, 36) reported that, in human and mouse regulatory T cells, the majority of DMRs are located at promoter-distal sites and that many of these regions display DNA methylation-dependent enhancer activity in reporter gene assays. Tsuji-Takayama et al. (37) demonstrated that production of IL-10 in regulatory T cells was enhanced by IL-2 through a STAT5-responsive intron enhancer in the IL-10 locus. However, Lai et al. (38) reported that DNA methylation in an intron can prevent enhancer-blocking transcription factor–mediated silencing. We used a reporter assay to examine the 51 gene-expression–associated DMRs and obtained results consistent with earlier reports. When loci containing DMRs were cloned into the reporter gene plasmid, the DMRs possessed enhancer activity in naive T cells in which DNA methylation was suppressed. Like previous studies, our results revealed different enhancer activities for different DMRs. It was reported that, compared with normal control cells, the DNA methylation of gene promoter regions differed in CD4+ T cells in patients with rheumatoid arthritis (39), subacute cutaneous lupus erythematosus (40), and systemic lupus erythematosus (41). Together, these results suggest that, in the normal immune state, these DMRs are associated with enhancer activity rather than with promoter activity.
Genes associated with the 51 gene-expression–associated DMRs in naive and memory CD4+ T cells were functionally categorized as relating to signal transduction, cell communication, and immune responses. As predicted, IL-7R, Bcl2l1, Tbox21, and CXCR6 genes were associated with changes in DNA methylation. Kim et al. (42) reported that DNA methylation is involved in regulating IL-7R expression in T cells. They found that IL-7Rα high CD8 T cells had stronger cell signaling and survival responses to IL-7 compared with IL-7Rα low CD8 T cells. Together with these findings, our results indicate that DNA methylation of the IL-7R gene in CD4+ T cells may be a key mechanism for modifying IL-7–mediated T cell development and survival. In addition, in the current study, expression of Tbx21, as well as of the Th1-related gene Ptgir, was also correlated with DNA methylation. Lymph node cells from sensitized Ptgir(−/−) mice show reduced IFN-γ production and a smaller T-bet(+) subset compared with control mice (43).
There were also several genes relating to memory CD4+ T cells homing to bone marrow (BM) that were associated with changes in DNA methylation. Tokoyada et al. (44) reported that >80% of Ly-6ChiCD44hiCD62L− memory CD4 T lymphocytes reside in the BM of adult mice and associate with IL-7–expressing VCAM-1 stroma cells. Our results demonstrate that Ly-6C is expressed more highly in memory CD4+ T cells than in naive CD4+ T cells. Because IL-7 is the main cytokine required for CD4+ T cell survival (45), the BM is predicted to function as a survival niche for memory CD4+ T cells. Thus, in the memory phase of immunity, memory Th cells are maintained in BM as resting, but highly reactive, cells in niches defined by IL-7–expressing stroma cells. In addition, when gene expression between CD44hiCD62L−CD4+ T cells from the spleen and BM were compared, CD24, CD122, CXCR6, and CCR2 levels on CD44hiCD62L−CD4+ T cells from the BM were higher than on the same cells from the spleen (45). Our data also reveal upregulation of gene expression and unmethylation of CXCR6 in the memory phase, suggesting that the unmethylation of DNA in gene body regions may be related to the homing of CD44hiCD62L−CD4+ T cells to the BM.
In memory CD4+ T cells, the genes Chsy1 and Itgb1 were linked to changes in DNA methylation in introns. Chsy1 synthesizes chondroitin sulfate and regulates many biological processes, including cell proliferation, recognition, and extracellular matrix deposition. Yin (46) showed that Chsy1 is the most prominent secreted protein in myeloma cell–osteoclast coculture conditioned medium and that Chsy1 activates Notch2 signaling in myeloma cells in the BM microenvironment. Therefore, Chsy1 may play an important role in cell–cell interactions, such as those between T cells and osteoclasts in the BM microenvironment. In contrast, Itgb1 is critical for maintenance of Ag-specific CD4+ T cells in the BM (47). Therefore, DNA methylation in gene body regions is likely to play an important role in CD4+ T cell homing to BM.
The expression of Cish was also associated with changes in DNA methylation in gene body regions. Cish is a member of the SOCS family, which was discovered as a negative regulator of cytokine signaling. However, in CD4 promoter-driven Cish-Tg mice, elevated Cish expression promotes T cell proliferation and survival after TCR activation relative to T cells in control mice (48). Moreover, Nakajima et al. (49) showed that expression of both Cish mRNA and protein is significantly increased in allergen-stimulated CD4+ T cells from hen egg–allergic patients relative to patients not allergic to hen eggs. In addition, Khor et al. (50) identified a panel of Cish single nucleotide polymorphisms associated with increased susceptibility to infectious diseases, such as bacteremia, malaria, and tuberculosis. Thus, Cish expression caused by demethylation within the Cish locus in memory T cells may play a role in some infectious and allergic diseases.
In the current study, differences in methylated regions between naive and memory CD4+ T cells did not always correlate with gene expression. The promoter and enhancer regions of differentially expressed genes were unmethylated, even in naive CD4+ T cells. Therefore, gene expression in the naive phase is likely to be regulated primarily by the activation of transcription factors. However, changes in the DNA methylation of unsynchronized genes may prepare T cells for rapid responses following secondary stimulation via TCR signaling or other stimuli, such as inflammatory cytokines, bacteria, and viruses.
Variable DNA methylation of the enhancers of genes related to T cell development and survival represents a novel mechanism underlying the regulation of gene expression in memory CD4+ T cells. In this study, we demonstrated the important role that methylation and demethylation of DNA in exons and introns play in regulating gene-expression patterns in Ag-specific memory CD4+ T cells.
Acknowledgments
We thank Dr. Yong-Jun Lee and Ryu Takahashi for technical assistance and Dr. M. Klug (Department of Hematology and Oncology, University Hospital, Regensburg, Germany), for the plasmid pCpG-basic.
This work was supported by a Grant-in-Aid for Scientific Research (C) and Core Research for Evolution Science and Technology of the Japan Science and Technology Agency. S.-i.H. was supported by the “Genome Information Big Bang” Global Center of Excellence project from the Ministry of Education, Culture, Sports, Science, and Technology of Japan.
The sequences presented in this article have been submitted to the National Center for Biotechnology Information Sequence Read Archive (http://www.ncbi.nlm.nih.gov/sra) under accession number SRP007816.
The online version of this article contains supplemental material.
- BM
- bone marrow
- CGI
- CpG island
- DMR
- differentially methylated region
- GO
- Gene Ontology Consortium Database
- MSCC
- methyl-sensitive cut counting
- P/I
- PMA/ionomycin
- SAGE
- serial analysis of gene expression
- TAE
- Tris–acetate–EDTA
- Tg
- transgenic
- TSS
- transcription start site.
Disclosures
The authors have no financial conflicts of interest.
References
- 1.Seder R. A., Ahmed R. 2003. Similarities and differences in CD4+ and CD8+ effector and memory T cell generation. Nat. Immunol. 4: 835–842 [DOI] [PubMed] [Google Scholar]
- 2.Moulton V. R., Farber D. L. 2006. Committed to memory: lineage choices for activated T cells. Trends Immunol. 27: 261–267 [DOI] [PubMed] [Google Scholar]
- 3.Sawalha A. H. 2008. Epigenetics and T-cell immunity. Autoimmunity 41: 245–252 [DOI] [PubMed] [Google Scholar]
- 4.Wilson C. B., Rowell E., Sekimata M. 2009. Epigenetic control of T-helper-cell differentiation. Nat. Rev. Immunol. 9: 91–105 [DOI] [PubMed] [Google Scholar]
- 5.Cuddapah S., Barski A., Zhao K. 2010. Epigenomics of T cell activation, differentiation, and memory. Curr. Opin. Immunol. 22: 341–347 [DOI] [PMC free article] [PubMed] [Google Scholar]
- 6.Portela A., Esteller M. 2010. Epigenetic modifications and human disease. Nat. Biotechnol. 28: 1057–1068 [DOI] [PubMed] [Google Scholar]
- 7.Jaenisch R., Bird A. 2003. Epigenetic regulation of gene expression: how the genome integrates intrinsic and environmental signals. Nat. Genet. 33(Suppl.): 245–254 [DOI] [PubMed] [Google Scholar]
- 8.Bird A. 2002. DNA methylation patterns and epigenetic memory. Genes Dev. 16: 6–21 [DOI] [PubMed] [Google Scholar]
- 9.Jones P. A., Takai D. 2001. The role of DNA methylation in mammalian epigenetics. Science 293: 1068–1070 [DOI] [PubMed] [Google Scholar]
- 10.Li E. 2002. Chromatin modification and epigenetic reprogramming in mammalian development. Nat. Rev. Genet. 3: 662–673 [DOI] [PubMed] [Google Scholar]
- 11.Meehan R. R. 2003. DNA methylation in animal development. Semin. Cell Dev. Biol. 14: 53–65 [DOI] [PubMed] [Google Scholar]
- 12.Lee P. P., Fitzpatrick D. R., Beard C., Jessup H. K., Lehar S., Makar K. W., Pérez-Melgosa M., Sweetser M. T., Schlissel M. S., Nguyen S., et al. 2001. A critical role for Dnmt1 and DNA methylation in T cell development, function, and survival. Immunity 15: 763–774 [DOI] [PubMed] [Google Scholar]
- 13.Carbone A. M., Marrack P., Kappler J. W. 1988. Demethylated CD8 gene in CD4+ T cells suggests that CD4+ cells develop from CD8+ precursors. Science 242: 1174–1176 [DOI] [PubMed] [Google Scholar]
- 14.Wilson C. B., Makar K. W., Pérez-Melgosa M. 2002. Epigenetic regulation of T cell fate and function. J. Infect. Dis. 185(Suppl. 1): S37–S45 [DOI] [PubMed] [Google Scholar]
- 15.Schwab J., Illges H. 2001. Regulation of CD21 expression by DNA methylation and histone deacetylation. Int. Immunol. 13: 705–710 [DOI] [PubMed] [Google Scholar]
- 16.Chen S. C., Lin C. Y., Chen Y. H., Fang H. Y., Cheng C. Y., Chang C. W., Chen R. A., Tai H. L., Lee C. H., Chou M. C., et al. 2006. Aberrant promoter methylation of EDNRB in lung cancer in Taiwan. Oncol. Rep. 15: 167–172 [PubMed] [Google Scholar]
- 17.Makar K. W., Wilson C. B. 2004. DNA methylation is a nonredundant repressor of the Th2 effector program. J. Immunol. 173: 4402–4406 [DOI] [PubMed] [Google Scholar]
- 18.Lindahl Allen M., Koch C. M., Clelland G. K., Dunham I., Antoniou M. 2009. DNA methylation-histone modification relationships across the desmin locus in human primary cells. BMC Mol. Biol. 10: 51. [DOI] [PMC free article] [PubMed] [Google Scholar]
- 19.Schmidl C., Klug M., Boeld T. J., Andreesen R., Hoffmann P., Edinger M., Rehli M. 2009. Lineage-specific DNA methylation in T cells correlates with histone methylation and enhancer activity. Genome Res. 19: 1165–1174 [DOI] [PMC free article] [PubMed] [Google Scholar]
- 20.Chappell C., Beard C., Altman J., Jaenisch R., Jacob J. 2006. DNA methylation by DNA methyltransferase 1 is critical for effector CD8 T cell expansion. J. Immunol. 176: 4562–4572 [DOI] [PubMed] [Google Scholar]
- 21.Kersh E. N. 2006. Impaired memory CD8 T cell development in the absence of methyl-CpG-binding domain protein 2. J. Immunol. 177: 3821–3826 [DOI] [PubMed] [Google Scholar]
- 22.Yamashita M., Shinnakasu R., Nigo Y., Kimura M., Hasegawa A., Taniguchi M., Nakayama T. 2004. Interleukin (IL)-4-independent maintenance of histone modification of the IL-4 gene loci in memory Th2 cells. J. Biol. Chem. 279: 39454–39464 [DOI] [PubMed] [Google Scholar]
- 23.Ball M. P., Li J. B., Gao Y., Lee J. H., LeProust E. M., Park I. H., Xie B., Daley G. Q., Church G. M. 2009. Targeted and genome-scale strategies reveal gene-body methylation signatures in human cells. Nat. Biotechnol. 27: 361–368 [DOI] [PMC free article] [PubMed] [Google Scholar]
- 24.Hashimoto S., Qu W., Ahsan B., Ogoshi K., Sasaki A., Nakatani Y., Lee Y., Ogawa M., Ametani A., Suzuki Y., et al. 2009. High-resolution analysis of the 5′-end transcriptome using a next generation DNA sequencer. PLoS ONE 4: e4108. [DOI] [PMC free article] [PubMed] [Google Scholar]
- 25.Beissbarth T., Speed T. P. 2004. GOstat: find statistically overrepresented Gene Ontologies within a group of genes. Bioinformatics 20: 1464–1465 [DOI] [PubMed] [Google Scholar]
- 26.Eckhardt F., Lewin J., Cortese R., Rakyan V. K., Attwood J., Burger M., Burton J., Cox T. V., Davies R., Down T. A., et al. 2006. DNA methylation profiling of human chromosomes 6, 20 and 22. Nat. Genet. 38: 1378–1385 [DOI] [PMC free article] [PubMed] [Google Scholar]
- 27.Irizarry R. A., Ladd-Acosta C., Carvalho B., Wu H., Brandenburg S. A., Jeddeloh J. A., Wen B., Feinberg A. P. 2008. Comprehensive high-throughput arrays for relative methylation (CHARM). Genome Res. 18: 780–790 [DOI] [PMC free article] [PubMed] [Google Scholar]
- 28.Moulton V. R., Bushar N. D., Leeser D. B., Patke D. S., Farber D. L. 2006. Divergent generation of heterogeneous memory CD4 T cells. J. Immunol. 177: 869–876 [DOI] [PubMed] [Google Scholar]
- 29.Yang G., Xu Y., Chen X., Hu G. 2007. IFITM1 plays an essential role in the antiproliferative action of interferon-gamma. Oncogene 26: 594–603 [DOI] [PubMed] [Google Scholar]
- 30.Gattinoni L., Zhong X. S., Palmer D. C., Ji Y., Hinrichs C. S., Yu Z., Wrzesinski C., Boni A., Cassard L., Garvin L. M., et al. 2009. Wnt signaling arrests effector T cell differentiation and generates CD8+ memory stem cells. Nat. Med. 15: 808–813 [DOI] [PMC free article] [PubMed] [Google Scholar]
- 31.Debets R., Timans J. C., Churakowa T., Zurawski S., de Waal Malefyt R., Moore K. W., Abrams J. S., O’Garra A., Bazan J. F., Kastelein R. A. 2000. IL-18 receptors, their role in ligand binding and function: anti-IL-1RAcPL antibody, a potent antagonist of IL-18. J. Immunol. 165: 4950–4956 [DOI] [PubMed] [Google Scholar]
- 32.Rao A., Avni O. 2000. Molecular aspects of T-cell differentiation. Br. Med. Bull. 56: 969–984 [DOI] [PubMed] [Google Scholar]
- 33.Irizarry R. A., Ladd-Acosta C., Wen B., Wu Z., Montano C., Onyango P., Cui H., Gabo K., Rongione M., Webster M., et al. 2009. The human colon cancer methylome shows similar hypo- and hypermethylation at conserved tissue-specific CpG island shores. Nat. Genet. 41: 178–186 [DOI] [PMC free article] [PubMed] [Google Scholar]
- 34.Maunakea A. K., Nagarajan R. P., Bilenky M., Ballinger T. J., D’Souza C., Fouse S. D., Johnson B. E., Hong C., Nielsen C., Zhao Y., et al. 2010. Conserved role of intragenic DNA methylation in regulating alternative promoters. Nature 466: 253–257 [DOI] [PMC free article] [PubMed] [Google Scholar]
- 35.Kim H. P., Leonard W. J. 2007. CREB/ATF-dependent T cell receptor-induced FoxP3 gene expression: a role for DNA methylation. J. Exp. Med. 204: 1543–1551 [DOI] [PMC free article] [PubMed] [Google Scholar]
- 36.Baron U., Floess S., Wieczorek G., Baumann K., Grützkau A., Dong J., Thiel A., Boeld T. J., Hoffmann P., Edinger M., et al. 2007. DNA demethylation in the human FOXP3 locus discriminates regulatory T cells from activated FOXP3(+) conventional T cells. Eur. J. Immunol. 37: 2378–2389 [DOI] [PubMed] [Google Scholar]
- 37.Tsuji-Takayama K., Suzuki M., Yamamoto M., Harashima A., Okochi A., Otani T., Inoue T., Sugimoto A., Toraya T., Takeuchi M., et al. 2008. The production of IL-10 by human regulatory T cells is enhanced by IL-2 through a STAT5-responsive intronic enhancer in the IL-10 locus. J. Immunol. 181: 3897–3905 [DOI] [PubMed] [Google Scholar]
- 38.Lai A. Y., Fatemi M., Dhasarathy A., Malone C., Sobol S. E., Geigerman C., Jaye D. L., Mav D., Shah R., Li L., Wade P. A. 2010. DNA methylation prevents CTCF-mediated silencing of the oncogene BCL6 in B cell lymphomas. J. Exp. Med. 207: 1939–1950 [DOI] [PMC free article] [PubMed] [Google Scholar]
- 39.Janson P. C., Linton L. B., Bergman E. A., Marits P., Eberhardson M., Piehl F., Malmström V., Winqvist O. 2011. Profiling of CD4+ T cells with epigenetic immune lineage analysis. J. Immunol. 186: 92–102 [DOI] [PubMed] [Google Scholar]
- 40.Luo Y., Zhang X., Zhao M., Lu Q. 2009. DNA demethylation of the perforin promoter in CD4(+) T cells from patients with subacute cutaneous lupus erythematosus. J. Dermatol. Sci. 56: 33–36 [DOI] [PubMed] [Google Scholar]
- 41. Jeffries, M., M. Dozmorov, Y. Tang, J. T. Merrill, J. D. Wren, and A. H. Sawalha. 2011. Genome-wide DNA methylation patterns in CD4+ T cells from patients with systemic lupus erythematosus. Epigenetics 6: 593–601. [DOI] [PMC free article] [PubMed]
- 42.Kim H. R., Hwang K. A., Kim K. C., Kang I. 2007. Down-regulation of IL-7Ralpha expression in human T cells via DNA methylation. J. Immunol. 178: 5473–5479 [DOI] [PubMed] [Google Scholar]
- 43.Nakajima S., Honda T., Sakata D., Egawa G., Tanizaki H., Otsuka A., Moniaga C. S., Watanabe T., Miyachi Y., Narumiya S., Kabashima K. 2010. Prostaglandin I2-IP signaling promotes Th1 differentiation in a mouse model of contact hypersensitivity. J. Immunol. 184: 5595–5603 [DOI] [PubMed] [Google Scholar]
- 44.Tokoyoda K., Zehentmeier S., Hegazy A. N., Albrecht I., Grün J. R., Löhning M., Radbruch A. 2009. Professional memory CD4+ T lymphocytes preferentially reside and rest in the bone marrow. Immunity 30: 721–730 [DOI] [PubMed] [Google Scholar]
- 45.Chetoui N., Boisvert M., Gendron S., Aoudjit F. 2010. Interleukin-7 promotes the survival of human CD4+ effector/memory T cells by up-regulating Bcl-2 proteins and activating the JAK/STAT signalling pathway. Immunology 130: 418–426 [DOI] [PMC free article] [PubMed] [Google Scholar]
- 46.Yin L. 2005. Chondroitin synthase 1 is a key molecule in myeloma cell-osteoclast interactions. J. Biol. Chem. 280: 15666–15672 [DOI] [PubMed] [Google Scholar]
- 47.DeNucci C. C., Shimizu Y. 2011. β1 integrin is critical for the maintenance of antigen-specific CD4 T cells in the bone marrow but not long-term immunological memory. J. Immunol. 186: 4019–4026 [DOI] [PMC free article] [PubMed] [Google Scholar]
- 48.Li S., Chen S., Xu X., Sundstedt A., Paulsson K. M., Anderson P., Karlsson S., Sjögren H. O., Wang P. 2000. Cytokine-induced Src homology 2 protein (CIS) promotes T cell receptor-mediated proliferation and prolongs survival of activated T cells. J. Exp. Med. 191: 985–994 [DOI] [PMC free article] [PubMed] [Google Scholar]
- 49.Nakajima Y., Tsuge I., Kondo Y., Komatsubara R., Hirata N., Kakami M., Kato M., Kurahashi H., Urisu A., Asano Y. 2008. Up-regulated cytokine-inducible SH2-containing protein expression in allergen-stimulated T cells from hen’s egg-allergic patients. Clin. Exp. Allergy 38: 1499–1506 [DOI] [PubMed] [Google Scholar]
- 50.Khor C. C., Vannberg F. O., Chapman S. J., Guo H., Wong S. H., Walley A. J., Vukcevic D., Rautanen A., Mills T. C., Chang K. C., et al. 2010. CISH and susceptibility to infectious diseases. N. Engl. J. Med. 362: 2092–2101 [DOI] [PMC free article] [PubMed] [Google Scholar]