

Abstract
Platelets are activated in sickle cell disease (SCD), and particularly during vaso-occlusive episodes (VOE). Thrombospondin-1 (TSP1), a major secretory product of activated platelets, is increased in the circulation in VOE and binds to sickle red blood cells (RBC) promoting vascular adhesion. Thus, we hypothesized that TSP1 may represent a plasma biomarker of disease severity in SCD. We tested the plasma collected from patients in steady state (n = 27) and VOE (n = 14), as well as healthy controls (n = 17) at the University of Pittsburgh Medical Center (UPMC), and from patients in steady state enrolled in the walk-PHaSST clinical trial (n = 483). We found that TSP1 levels were increased in VOE in the UPMC cohort. Among steady-state patients at UPMC, TSP1 values correlated positively with lifetime history of acute chest syndrome (r = 0.72, P < 0.0001) and hemoglobin concentration (r = 0.49, P = 0.01), and negatively with markers of hemolysis, such as LDH (r = −0.50, P = 0.009). Analysis of the walk-PHaSST cohort also showed a positive association between TSP1 levels and hydroxyurea use (r = 0.14, P = 0.003), and confirmed the negative associations with the severity of hemolysis. Our results suggest that TSP1 levels are associated with more VOE, hydroxyurea use and lower rates of hemolysis. High TSP1 concentrations may indicate higher risk of the viscosity/vaso-occlusion phenotype of SCD.
In sickle cell disease (SCD), mutated hemoglobin (HbS) polymerizes when sickle RBC are exposed to hypoxic conditions in the microcirculation, leading to increased cellular adhesiveness, nitric oxide depletion and vaso-occlusion [1]. Increased platelet activation likely plays a catalytic role in SCD vaso-occlusion and vasculopathy [2,3]. Markers of platelet activation such as (a) P-selectin and other activation-dependent antigens on circulating platelets [4–6], (b) increased plasma concentrations of platelet factor 4 [5], beta-thromboglobulin [5], thrombospondin-1 (TSP1) [7] and soluble CD40 ligand [8], and (c) increased numbers of circulating platelet microparticles [6] have been detected in patients with SCD in steady state and are amplified during acute VOE [3,6]. Activated platelets are proposed to contribute to the pathogenesis of VOE by increasing adhesion of sickle RBCs to the endothelium [9] via secretion of fibrinogen, von Willebrand Factor [10] and TSP1 [11] and promoting further intimal damage [12,13].
TSP1, a multifunctional glycoprotein containing domains for adhesive proteins, enzymes, cell receptors, and abundantly present in platelet α-granules, is emerging as a key player in vascular biology [14]. TSP1 is released by activated platelets and is increased in the plasma of patients with SCD in VOE [7]. TSP1 binds to the “stress” receptor CD36, expressed on sickle RBC under erythropoietic stress and to phosphatidylserine (PS)-expressing RBC and tethers them to the endothelium through binding to von Willebrand Factor and αvβ3 integrin, thus promoting vascular adhesiveness [11,15,16]. Moreover, we have shown that TSP1 inhibits the NO signaling pathway through binding to the receptors CD36 [17] and CD47 [18], expressed on endothelial cells and platelets. Interestingly, TSP1 levels were found to be elevated in children with SCD and silent cerebral infarction (SCI) as compared with those without SCI (median 8.5 vs. 6.2 μg/ml for TSP1, P = 0.03) and correlated with baseline oxygen saturation in both the SCI (r = −0.51) and non-SCI groups (r = −0.35, P in both <0.001) [19]. Taken together, these results suggest that TSP1 may be a valuable biomarker in SCD and has the potential to mediate adhesive VOE. To explore the role of TSP1 as a biomarker and define its associations with measures of disease activity we conducted a biochemical analysis of plasma samples in the prospective UPMC cohort and in the walk-PHaSST clinical trial plasma repository.
We found that patients with SCD in VOE in the UPMC cohort demonstrated induction of supra-physiologic levels of circulating plasma TSP1 [median (IQ range) = 898 ng/mL (381–1,657)] as compared to patients in steady state [303 ng/mL (187–939) and healthy controls (239 ng/mL (125–344) P = 0.001]. Although patients in steady state SCD had higher TSP1 levels than controls, the difference was of borderline significance (P = 0.056).
We then explored the association of TSP1 with laboratory and clinical markers of disease activity in the two cohorts of SCD patients. As expected based on the localization of TSP1 in platelet alpha granules, TSP1 correlated with platelet count in steady state SCD in the UPMC cohort (r = 0.6, P = 0.001). However, the platelet count was not increased in patients with VOE as compared to patients in steady state, thus suggesting that increased platelet activation and degranulation rather than thrombocytosis, may have led to increased plasma levels of TSP1 in these patients. This is in keeping with a prior study that showed increased platelet activation in VOE [3]. Alternatively, plasma TSP1 may have originated from endothelial cells and other cellular components of the endothelial wall [14]. We also found that in the steady state group, TSP1 levels correlated with a lifetime history of acute chest syndrome (r = 0.72, P < 0.0001, Fig. 1, Panel A), a lifetime history of pulmonary embolism (r = 0.44, P = 0.03), had a marginal correlation with the number of severe vaso-occlusive pain episodes in the preceding 12 months (0.39, P = 0.07), and correlated inversely with age (r = −0.39, P = 0.05, Table I).
Figure 1.
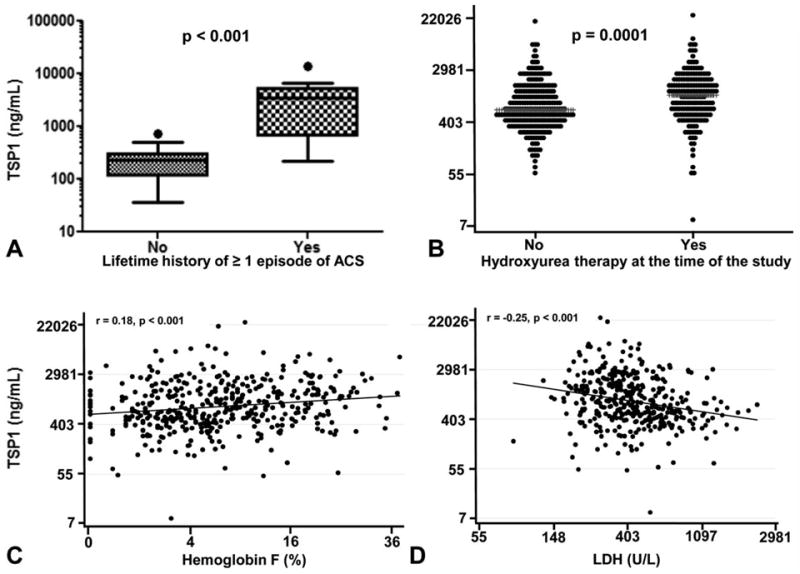
Plasma thrombospondin-1 (TSP1) is increased in patients with HbSS and a lifetime history of acute chest syndrome (ACS) and is associated with hydroxyurea therapy and lower hemolytic rates. Patients with HbSS and a lifetime history of at least one episode of ACS in the UPMC cohort had higher plasma levels of TSP1 (median (IQ range) = 3470 (676.4–5366) ng/mL as compared to patients without a history of ACS (228.2 (113.4–300.5) ng/mL, Panel A). Correlations of TSP1 with hydroxyurea use, hemoglobin F and LDH among patients with steady state HbSS in the walk-PHaSST cohort (Spearman correlation, Panels B-D). Plasma TSP1 levels were measured by ELISA.
TABLE I.
Correlations of TSP1 (Natural Log) with Clinical and Laboratory Characteristics Among Patients with Steady State HbSS in the UPMC Cohort
| Characteristic | n | r | P |
|---|---|---|---|
| Agea | 26 | −0.39 | 0.05 |
| Hydroxyurea use | 25 | 0.09* | 0.7 |
| Systolic blood pressurea | 25 | −0.08 | 0.7 |
| Diastolic blood pressurea | 25 | −0.12 | 0.6 |
| Hemoglobin | 26 | 0.49 | 0.01 |
| White blood cell count (WBC)a | 26 | 0.09 | 0.7 |
| Platelet counta | 26 | 0.60 | 0.001** |
| Reticulocyte counta | 14 | 0.06 | 0.8 |
| Lactate dehydrogenase (LDH)a | 26 | −0.50 | 0.009 |
| Bilirubina | 25 | −0.09 | 0.7 |
| Creatinine | 19 | −0.09 | 0.7 |
| Hemoglobin Fa | 14 | 0.44 | 0.12 |
| Ferritina | 25 | −0.20 | 0.3 |
| Chronic pain | 27 | −0.03* | 0.9 |
| History of acute chest syndrome (ACS) | 25 | 0.72* | <0.0001** |
| Severe VOE/last 12 months | 23 | 0.39* | 0.07 |
| History of cerebrovascular accident | 24 | −0.13 | 0.6 |
| History of leg ulcers | 25 | −0.23 | 0.3 |
| History of priapism | 19 | −0.23 | 0.4 |
| History of osteonecrosis (AVN) | 25 | 0.18 | 0.4 |
| History of retinopathy | 24 | 0.06 | 0.8 |
| History of deep vein thrombosis | 25 | −0.05 | 0.8 |
| History of pulmonary embolism | 25 | 0.44 | 0.03 |
Severe vaso-occlusive episode (VOE) is defined as an acute pain episode leading to an emergency department visit or hospitalization. TSP1, thrombospondin-1; AVN, avascular necrosis.
Transformed using the natural log or square root function.
Spearman correlation
Significant after adjustment for multiple comparisons.
We next examined these results in a larger cohort of patients with HbSS disease within the walk-PHaSST clinical trial (n = 431) which includes prospective detailed data on clinical, hemolytic, and cardiopulmonary phenotypes at steady state from multiple sites in the US and Europe. We found that study site was a significant predictor of TSP1 in this cohort and that there were wide discrepancies in multiple laboratory values between sites. We acknowledge that this is a limitation of our study and might have been due to geographic variations in the SCD population or different blood collection methodologies. Thus we calculated crude correlations as well as adjusted correlations for study site. We also adjusted for platelet count, as blood collection in the walk-PHaSST trial was not subjected to the same rigorous criteria to minimize platelet activation we employed in the prospective cohort at UPMC and we were interested in adjusting for the potential effects of artifactual ex vivo platelet degranulation on the analysis. In this cohort, the median (interquartile range) for age and TSP1 in patients were 35 years (25–46) and 787 ng/ml (456–1547), respectively. The TSP1 concentration was not different between the sexes (P = 0.9). Patients on hydroxyurea had significantly higher TSP1 values as compared to patients not on hydroxyurea (median of 1137 vs. 646 ng/ml, P < 0.001, Fig. 1, Panel B). Consistent with this association, TSP1 also correlated with MCV values (r = 0.19, P = 0.001), and HbF levels (r = 0.17, P < 0.001, Fig. 1, Panel C), which likely reflect compliance with hydroxyurea therapy and effectiveness. These correlations remained significant after adjusting for study site and platelet count. Consistent with the UPMC cohort where TSP1 positively correlated with hemoglobin and negatively correlated with LDH (Table I), TSP1 values were positively correlated with total hemoglobin and inversely correlated with markers of hemolysis (reticulocyte count and percentage, LDH, AST, bilirubin, hemolytic component) (Table II, Fig. 1, Panel D).
TABLE II.
Correlation of TSP1 (Natural Log) with Demographic and Laboratory Markers of Patients with Steady State HbSS in the Walk-PHaSST Cohort
| n | Crude r | P | Adj. r site | P | Adj. r site/plt | P | |
|---|---|---|---|---|---|---|---|
| Age | 428 | 0.00 | 0.9 | 0.01 | 0.8 | 0.06 | 0.2 |
| Female gender | 431 | 0.01* | 0.8 | 0.0 | 0.9 | 0.0 | 0.9 |
| Body mass index (BMI)a | 424 | 0.10 | 0.038 | 0.11 | 0.020 | 0.12 | 0.011 |
| Hemoglobin oxygen saturation | 427 | 0.07 | 0.14 | 0.13 | 0.010 | 0.13 | 0.006 |
| Six-minute walk distance | 425 | 0.01 | 0.8 | −0.03 | 0.5 | −0.06 | 0.2 |
| Hydroxyurea use | 431 | 0.22* | <0.001** | 0.14 | 0.003** | 0.19 | <0.001** |
| Chronic pain | 430 | −0.03* | 0.5 | 0.0 | 0.9 | −0.02 | 0.7 |
| Systolic blood pressure | 430 | 0.04 | 0.4 | 0.02 | 0.7 | −0.01 | 0.9 |
| Diastolic blood pressure | 430 | −0.01 | 0.9 | 0.0 | 0.9 | 0.02 | 0.8 |
| Hemoglobin | 424 | 0.15 | 0.002** | 0.17 | <0.001** | 0.17 | <0.001** |
| Medium corpuscular volume (MCV) | 427 | 0.19 | <0.001** | 0.13 | 0.007 | 0.14 | 0.003** |
| White blood cell count (WBC)a | 426 | −0.10 | 0.039 | −0.12 | 0.011 | −0.17 | <0.001** |
| Platelet counta | 425 | 0.25 | <0.001** | 0.18 | <0.001** | NA | NA |
| Reticulocyte (%) | 399 | −0.12 | 0.020 | −0.21 | <0.001** | −0.24 | <0.001** |
| Reticulocyte count | 414 | −0.07 | 0.19 | −0.14 | 0.005 | −0.17 | <0.001** |
| Lactate dehydrogenase (LDH)1 | 393 | −0.25 | <0.001** | −0.12 | 0.017 | −0.09 | 0.06 |
| Aspartate aminotransferase (AST)a | 421 | −0.18 | <0.001** | −0.13 | 0.007 | −0.10 | 0.037 |
| Alanine aminotransferase (ALT)a | 429 | −0.01 | 0.8 | −0.04 | 0.4 | −0.04 | 0.4 |
| Total bilirubina | 425 | −0.14 | 0.004 | −0.16 | <0.001** | −0.17 | <0.001** |
| Creatininea | 428 | −0.04 | 0.4 | −0.12 | 0.014 | −0.09 | 0.07 |
| Hemolytic componentb | 369 | −0.16 | 0.003** | −0.22 | <0.001** | −0.22 | <0.001** |
| Alkaline phosphatase1 | 429 | 0.02 | 0.6 | 0.04 | 0.4 | 0.04 | 0.4 |
| Serum total globulina,c | 425 | 0.07 | 0.13 | 0.13 | 0.007 | 0.15 | 0.002** |
| Hemoglobin Fa | 418 | 0.18 | <0.001** | 0.13 | 0.006 | 0.16 | 0.001** |
| Ferritin | 430 | 0.04 | 0.4 | −0.01 | 0.9 | −0.01 | 0.9 |
TSP1, thrombospondin-1; Adj., adjusted; plt, platelet;
Transformed using the natural log or square root function.
A hemolytic component was generated by Principal Component Analysis of the levels of lactate dehydrogenase, aspartate aminotransferase, bilirubin, and reticulocyte count.
Serum total globulin was obtained by subtracting the albumin level from the serum total protein level.
Spearman correlation
Significant after adjustment for multiple comparisons.
The variables hydroxyurea, body mass index, hemoglobin, oxygen saturation, hemolytic component, MCV, the inflammatory marker serum total globulin (obtained from subtraction of the albumin level from the serum total protein value), platelet count, hemoglobin F, and white blood cell count were then entered in a multiple linear regression model. This analysis showed that TSP1 remained correlated with hemoglobin (B = 0.06, CI = 0.01–0.12, P = 0.025), platelet count (B = 0.04, CI = 0.02–0.07, P = 0.0003), serum total globulin (B = 1.08, CI = 0.63–1.54), P < 0.001) and hemoglobin F (B = 0.15, CI = 0.06–0.23), P = 0.001) and was inversely correlated with the hemolytic component (B = −0.07, CI = −0.14, −0.01, P = 0.019), which is generated by principal component analysis of the levels of lactate dehydrogenase, aspartate aminotransferase, bilirubin, and reticulocyte count. Thus, the hematologic parameters that show hydroxyurea effectiveness were predictors of TSP1 in the multivariate model.
Hydroxyurea treatment is known to lower platelet counts in patients with SCD [20]. By inhibiting hemolysis this would also be expected to limit platelet activation [2,3]. At the same time platelets represent the major depot location of preformed TSP1 [14] and as expected our present analysis demonstrates a strong correlation between total platelet counts and TSP1. Thus, we would have expected hydroxyurea use to be inversely correlated with TSP1 levels. One possible explanation is that since hydroxyurea is indicated for the most severe clinical phenotypes of SCD, the positive association of TSP1 and hydroxyurea use suggests both are biomarkers of SCD disease severity. It is therefore possible that the sickest patients who had more frequent pain episodes and higher TSP1 levels were more likely to be placed on hydroxyurea, with the resultant increase in MCV, HbF and decrease in hemolysis (indication bias). Alternatively, hydroxyurea might have directly induced TSP1 production, potentially via HIF-1α dependent signaling pathways, or direct drug effects on TSP1 transcription [21]. Longitudinal studies of patients on hydroxyurea and basic investigations at the cellular level will be required to establish these mechanisms.
Over the last decade, multiple lines of evidence from epidemiological and mechanistic studies and clinical trials in SCD have suggested that there are two overlapping subphenotypes in SCD, one driven by increased rates of hemolytic anemia and low NO bioavailability and the other by hyperviscosity/inflammation/vaso-occlusion. Patients in the hyperhemolysis/NO depletion subphenotype have steady state high level intravascular hemolysis, and a high prevalence of pulmonary hypertension, leg ulcers and priapism while patients in the vaso-occlusive/hyperviscosity phenotype have frequent painful VOE, ischemic osteonecrosis and ACS [22,23]. In light of these studies, we were intrigued to find that TSP1 values were strongly correlated with higher hemoglobin levels while being inversely correlated with LDH, bilirubin, and reticulocyte count, all markers of hemolysis, in the walk-PHaSST cohort. There was a similar trend in the UPMC cohort where there was a significant positive correlation between TSP1 and hemoglobin and significant negative correlation between TSP1 and LDH. The positive association of TSP1 with VOE/ACS and hemoglobin levels, and its negative association with hemolytic markers suggest that consistent with its role as an adhesion molecule, TSP1 may be a valuable marker of vaso-occlusion in SCD and may allow to identify patients at risk of vaso-occlusive complications. Future mechanistic studies will need to be conducted to elucidate the relative role of the multiple potential pathways through which TSP1 likely modulates the SCD phenotype, as well as to fully understand the mechanisms accounting for high TSP1 levels in patients on hydroxyurea therapy.
Materials and Methods
Patients
To avoid confounders related to SCD genotype, the present report focuses on patients with hemoglobin SS.
UPMC cohort
This cohort included the following subject groups: (1) Patients with hemoglobin SS documented by high-pressure liquid chromatography in steady state (usual state of health and at least 2 weeks following a VOE, hospitalization or emergency room visit) presenting to the University of Pittsburgh Medical Center (UPMC) Adult Sickle Cell Program outpatient clinic; (2) Patients with HbSS in acute severe pain episodes (VOE requiring ED visit or hospitalization); (3) Healthy African American control subjects aged 21 and above who accompanied the patients to their clinic appointments. Patients in VOE underwent blood testing within 24 hr from presenting to the ED and prior to receiving any blood transfusion if this was indicated for the treatment of ACS or other complications. All subjects were enrolled after informed consent under IRB protocol PRO08110422.
Walk-PHaSST cohort
Patients in the Sildenafil Therapy for Pulmonary Hypertension and Sickle Cell Disease (walk-PHaSST, http://www.clinicaltrials.gov; unique identifier, NCT00492531) clinical trial were assessed in steady state. This paper reports the results of a subset of 483 patients with HbSS from the walk-PHaSST trial. Demographics as well as the other available laboratory measurements were obtained as part of the clinical care of the patients at UPMC or as part of the walk-PHaSST clinical trial. Clinical data on the lifetime prevalence of sickle cell related complications in the UPMC cohort were obtained through retrospective chart review. The variable ACS was coded as a dichotomous variable: no lifetime history of ACS vs. 1 or more episodes of ACS. Disease coding for data abstraction from the charts was conducted based on standard criteria to diagnose sickle cell related complications (NIH guidelines [24]). Chronic pain was defined as chronic use (>6 months) of long-acting opiates. Deep vein thrombosis was diagnosed by Doppler ultrasound. Pulmonary embolism was diagnosed by CT-pulmonary angiogram. We did not include clinical variables for the walk-PHaSST cohort, as this study relied on patient’s self-report of complications without validation through chart abstraction.
Processing of plasma samples
To minimize the confounding effect of platelet activation and degranulation ex vivo, possibly leading to artifactual elevation of TSP1 levels, we avoided or minimized the use of a tourniquet for arm occlusion whenever possible. Blood samples from patients and controls at the UPMC Adult Sickle Cell Program were collected in citrated tubes and immediately transferred to laboratory facilities adjacent to the collection sites at 4°C. The tubes were inverted 8–10 times and then subjected to double centrifugation at 1,500g at 4°C to obtain platelet poor plasma (PPP). The supernatant was aliquoted into cryotubes and stored at −80°C until the day of testing by ELISA. On the day of plasma collection for TSP1 testing, patients also underwent routine blood testing as indicated by their clinical care. PPP from the UPMC cohort and whole plasma from the walk-PHaSST cohort were thawed and assessed in parallel for levels of TSP1 in the clinical laboratory of The Institute for Transfusion Medicine (ITXMSM)(Pittsburgh, PA) or at the translational core laboratory for the Division of Pulmonary, Allergy and Critical Care Medicine (University of Pittsburgh, Pittsburgh, PA). TSP1 was measured by ELISA in duplicate (R&D Systems, Minneapolis, MN).
Statistical analysis
Data were analyzed using SAS (v. 9.1.3, Cary NC) or STATA 10.1 (College Station, TX). Comparisons of TSP1 levels between patients in steady state and VOE were compared by Mann-Whitney U test. Log-transformed TSP1 levels were also compared using the parametric two-sample t-test. The association between TSP1 and biomarkers, log-transformed as needed to meet normality assumptions, was determined by examining scatter plots and correlation coefficients. Each variable that was univariately associated with TSP1 (P < 0.2) was then examined in a multivariate linear regression model to determine which correlates remained associated with TSP1 after adjustment for all other correlates. Assumptions in linear regression were checked using residuals. We also used the Variance Inflation Factor to check for collinearity in the final model. TSP1 was adjusted for study site in the walk-PHaSST study using residuals from a linear regression analysis. A hemolytic component was generated by Principal Component Analysis of the levels of lactate dehydrogenase, aspartate aminotransferase, bilirubin, and reticulocyte count as previously described [25]. Briefly, the hemolytic component is a normalized factor of the four hemolytic variables with mean of 0 and SD of 1.56 and can predict more than 50% of the total variability among the other four markers of hemolysis (data reduction). The new marker can then be studied as a surrogate for the degree of hemolysis. Bonferroni correction was used to adjust the p values for multiple comparisons.
Acknowledgments
We are thankful to the patients of the UPMC Adult Sickle Cell Center for participation in this study. We also wish to acknowledge the laboratory technicians of The Institute for Transfusion Medicine, (ITxMSM) Pittsburgh, PA. Dr. Novelli received research support for this study by NIH bench-to-bedside award # 128767, a Hemophilia and Thrombosis Research Society (HTRS) Mentored Award and an American Society of Hematology (ASH) Scholar Award. Dr. Gladwin receives research support from NIH grants R01HL098032, RO1HL096973, and PO1HL103455, ITxMSM and the Hemophilia Center of Western Pennsylvania. Dr. Isenberg receives research support from NIH grants K22 CA128616 and R01 HL-108954, American Heart Association grant 11BGIA7210001, ITXMSM and the Hemophilia Center of Western Pennsylvania. Dr. Isenberg is chair of the scientific advisory boards of Vasculox, Inc. (St. Louis, MO) and Radiation Control Technologies, Inc. (Rockville, MD). Dr. Kato receives research support from the National Heart, Lung and Blood Institute Division of Intramural Research (1 ZIA HL005116-05). We thank the walk-PHaSST investigators who are not co-authors and patients for biobank and database contribution to this study.
Footnotes
Conflict of interest: Dr. Isenberg is chair of the scientific advisory boards of Vasculox, (St. Louis, MO) and Radiation Control Technologies, (Rockville, MD).
Additional Supporting Information may be found in the online version of this article.
References
- 1.Stuart MJ, Nagel RL. Sickle-cell disease. Lancet. 2004;364:1343–1360. doi: 10.1016/S0140-6736(04)17192-4. [DOI] [PubMed] [Google Scholar]
- 2.Hu W, Jin R, Zhang J, et al. The critical roles of platelet activation and reduced NO bioavailability in fatal pulmonary arterial hypertension in a murine hemolysis model. Blood. 2010;116:1613–1622. doi: 10.1182/blood-2010-01-267112. [DOI] [PMC free article] [PubMed] [Google Scholar]
- 3.Villagra J, Shiva S, Hunter LA, et al. Platelet activation in patients with sickle disease, hemolysis-associated pulmonary hypertension, and nitric oxide scavenging by cell-free hemoglobin. Blood. 2007;110:2166–2172. doi: 10.1182/blood-2006-12-061697. [DOI] [PMC free article] [PubMed] [Google Scholar]
- 4.Mohan JS, Lip GY, Bareford D, et al. Platelet P-selectin and platelet mass, volume and component in sickle cell disease: Relationship to genotype. Thromb Res. 2006;117:623–629. doi: 10.1016/j.thromres.2005.05.010. [DOI] [PubMed] [Google Scholar]
- 5.Tomer A, Harker LA, Kasey S, et al. Thrombogenesis in sickle cell disease. J Lab Clin Med. 2001;137:398–407. doi: 10.1067/mlc.2001.115450. [DOI] [PubMed] [Google Scholar]
- 6.Wun T, Paglieroni T, Rangaswami A, et al. Platelet activation in patients with sickle cell disease. Br J Haematol. 1998;100:741–749. doi: 10.1046/j.1365-2141.1998.00627.x. [DOI] [PubMed] [Google Scholar]
- 7.Browne PV, Mosher DF, Steinberg MH, et al. Disturbance of plasma and platelet thrombospondin levels in sickle cell disease. Am J Hematol. 1996;51:296–301. doi: 10.1002/(SICI)1096-8652(199604)51:4<296::AID-AJH8>3.0.CO;2-R. [DOI] [PubMed] [Google Scholar]
- 8.Lee SP, Ataga KI, Orringer EP, et al. Biologically active CD40 ligand is elevated in sickle cell anemia: Potential role for platelet-mediated inflammation. Arterioscler Thromb Vasc Biol. 2006;26:1626–1631. doi: 10.1161/01.ATV.0000220374.00602.a2. [DOI] [PubMed] [Google Scholar]
- 9.Antonucci R, Walker R, Herion J, et al. Enhancement of sickle erythrocyte adherence to endothelium by autologous platelets. Am J Hematol. 1990;34:44–48. doi: 10.1002/ajh.2830340110. [DOI] [PubMed] [Google Scholar]
- 10.Blann AD, Marwah S, Serjeant G, et al. Platelet activation and endothelial cell dysfunction in sickle cell disease is unrelated to reduced antioxidant capacity. Blood Coagul Fibrinolysis. 2003;14:255–259. doi: 10.1097/01.mbc.0000061293.28953.8c. [DOI] [PubMed] [Google Scholar]
- 11.Brittain HA, Eckman JR, Swerlick RA, et al. Thrombospondin from activated platelets promotes sickle erythrocyte adherence to human microvascular endothelium under physiologic flow: A potential role for platelet activation in sickle cell vaso-occlusion. Blood. 1993;81:2137–2143. [PubMed] [Google Scholar]
- 12.Schermuly RT, Dony E, Ghofrani HA, et al. Reversal of experimental pulmonary hypertension by PDGF inhibition. J Clin Invest. 2005;115:2811–2821. doi: 10.1172/JCI24838. [DOI] [PMC free article] [PubMed] [Google Scholar]
- 13.Ross R, Glomset J, Kariya B, et al. A platelet-dependent serum factor that stimulates the proliferation of arterial smooth muscle cells in vitro. Proc Natl Acad Sci USA. 1974;71:1207–1210. doi: 10.1073/pnas.71.4.1207. [DOI] [PMC free article] [PubMed] [Google Scholar]
- 14.Bonnefoy A, Moura R, Hoylaerts MF. The evolving role of thrombospondin-1 in hemostasis and vascular biology. Cell Mol Life Sci. 2008;65:713–727. doi: 10.1007/s00018-007-7487-y. [DOI] [PMC free article] [PubMed] [Google Scholar]
- 15.Sugihara K, Sugihara T, Mohandas N, et al. Thrombospondin mediates adherence of CD36+ sickle reticulocytes to endothelial cells. Blood. 1992;80:2634–2642. [PubMed] [Google Scholar]
- 16.Hillery CA, Scott JP, Du MC. The carboxy-terminal cell-binding domain of thrombospondin is essential for sickle red blood cell adhesion. Blood. 1999;94:302–309. [PubMed] [Google Scholar]
- 17.Isenberg JS, Ridnour LA, Perruccio EM, et al. Thrombospondin-1 inhibits endothelial cell responses to nitric oxide in a cGMP-dependent manner. Proc Natl Acad Sci USA. 2005;102:13141–13146. doi: 10.1073/pnas.0502977102. [DOI] [PMC free article] [PubMed] [Google Scholar]
- 18.Isenberg JS, Ridnour LA, Dimitry J, et al. CD47 is necessary for inhibition of nitric oxide-stimulated vascular cell responses by thrombospondin-1. J Biol Chem. 2006;281:26069–26080. doi: 10.1074/jbc.M605040200. [DOI] [PubMed] [Google Scholar]
- 19.Williams L, Fu Z, Dulloor P, et al. Identification of Thrombospondin-1 and L-Selectin as Potential Plasma Biomarkers of Silent Cerebral Infarct In Children with Sickle Cell Disease Using a Proteomic-Based Approach in 52nd ASH Annual Meeting and Exposition; Orlando. 2010. [Google Scholar]
- 20.Steinberg MH, Barton F, Castro O, et al. Effect of hydroxyurea on mortality and morbidity in adult sickle cell anemia: Risks and benefits up to 9 years of treatment. JAMA. 2003;289:1645–1651. doi: 10.1001/jama.289.13.1645. [DOI] [PubMed] [Google Scholar]
- 21.Gordeuk VR, Campbell A, Rana S, et al. Relationship of erythropoietin, fetal hemoglobin, and hydroxyurea treatment to tricuspid regurgitation velocity in children with sickle cell disease. Blood. 2009;114:4639–4644. doi: 10.1182/blood-2009-04-218040. [DOI] [PMC free article] [PubMed] [Google Scholar]
- 22.Kato GJ, Gladwin MT, Steinberg MH. Deconstructing sickle cell disease: Reappraisal of the role of hemolysis in the development of clinical subphenotypes. Blood Rev. 2007;21:37–47. doi: 10.1016/j.blre.2006.07.001. [DOI] [PMC free article] [PubMed] [Google Scholar]
- 23.Gladwin MT, Vichinsky E. Pulmonary complications of sickle cell disease. N Engl J Med. 2008;359:2254–2265. doi: 10.1056/NEJMra0804411. [DOI] [PubMed] [Google Scholar]
- 24.The management of sickle cell disease, NIH guidelines. 2002. [Google Scholar]
- 25.Minniti CP, Sable C, Campbell A, et al. Elevated tricuspid regurgitant jet velocity in children and adolescents with sickle cell disease: association with hemolysis and hemoglobin oxygen desaturation. Haematologica. 2009;94:340–347. doi: 10.3324/haematol.13812. [DOI] [PMC free article] [PubMed] [Google Scholar]