

Abstract
The complex life cycle of Plasmodium falciparum (Pf) makes it difficult to limit infections and reduce the risk of severe malaria. Improved understanding of Pf blood-stage growth and development would provide new opportunities to evaluate and interfere with successful completion of the parasite’s life cycle. Cultured blood stage Pf was incubated with Hoechst 33342 (HO) and thiazole orange (TO) to stain DNA and total nucleic acids, respectively. Correlated HO and TO fluorescence emissions were then measured by flow cytometry. Complex bivariate data patterns were analyzed by manual cluster gating to quantify parasite life cycle stages. The permutations of viable staining with both reagents were tested for optimal detection of parasitized RBC (pRBC). Pf cultures were exposed to HO and TO simultaneously to achieve optimal staining of pRBC and consistent quantification of early and late stages of the replicative cycle (rings through schizonts). Staining of Pf nucleic acids allows for analysis of parasite development in the absence of fixatives, lysis, or radioactivity to enable examination of erythrocytes from parasite invasion through schizont rupture using sensitive and rapid assay procedures. Investigation of the mechanisms by which anti-malarial drugs and antibodies act against different Pf lifecycle stages will be aided by this cytometric strategy.
Key terms: flow cytometry, FACS, Hoechst 33342, thiazole orange, malaria, erythrocytes
The development of in vitro culturing methods by Trager and Jensen (1) has allowed for increased understanding of Plasmodium falciparum (Pf) blood stage infection and parasite biology. Advanced studies enabled by Pf culturing included successful completion of Pf genetic crosses (2,3), mapping (4), sequencing of the genome (5), and gene manipulation (6). Since the discovery of wide-spread Pf drug resistance (7,8) it has become important to develop methods to evaluate parasite drug susceptibility through in vitro studies (9) and field-based drug trials (10). Based on the level of in vitro resistance of parasites isolated from different malaria-endemic regions of the world, strains of genetically diverse Pf were identified (11,12). Studies have identified genes responsible for resistance to chloroquine (11), sulfa drugs (13), pyrimethamine (14,15), as well as genes conferring resistance to multiple drugs (16).
Many different approaches have been used to evaluate Pf in vitro cultures in drug susceptibility assays (17). Two common methods are light microscopy (LM), which enables quantification of the fraction of parasitized RBC (pRBC) and evaluation of the impact of antimalarial drugs on the replicative and developmental cycles of the blood stage parasite, or monitoring the biological viability of parasites by tracking the incorporation of 3H-hypoxanthine (9). There are drawbacks to both of these approaches. LM is labor-intensive, subjective, and suffers from inter-operator variation. Metabolic uptake studies require the use of radioactivity, are subject to large error at low parasitemia, and because hypoxanthine is utilized by both RNA and DNA, this method requires LM to correlate measurements of radioactivity to the parasitemia and developmental stages present in a sample. Additionally, 3H-hypoxanthine uptake by the parasite and recently introduced enzyme assays of lactate dehydrogenase (18,19) only measure metabolic activity over the second half of the parasite life cycle whereas measurements of the histidine rich protein II have been developed to study an entire blood stage replication cycle (20).
A number of strategies using fluorescent dyes have been investigated to replace LM with flow cytometry. Studies utilizing these DNA dyes take advantage of the fact that uninfected erythrocytes lack DNA while erythrocytes invaded by parasites contain DNA and will therefore fluoresce. Although several staining methods have been developed to determine the overall amount of DNA present in a culture, many require complete lysis of the erythrocytes, such as Picogreen® (21) or Hoechst 33258 (22,23). Others use detergent and/or fixatives to allow entry or desired binding kinetics of dyes in the cells such as with acridine orange (24–26), YOYO-1 (27), or propidium iodide (28). DNA staining methods to identify parasitized cells have been described using ethidium bromide (29) or Draq 5 (30), which do not require lysis or fixatives using a flow cytometer; however, these methods have difficulty in delineating infected cells from uninfected cells.
Acridine orange was the first nucleic acid stain used to discriminate cell cycle stages of replicating cells (31) by revealing the relative levels of both DNA and RNA within a cell. Based upon the fluorescence of this stain, the different levels of nucleic acids expressed could be identified and the G1, S, and G2 cell-cycle stages could be distinguished (32,33). Although this stain has been used to identify certain stages of the Plasmodium life cycle (24,25,34) technical considerations limit the use of acridine orange for precise quantitative measurements of parasitemia or parasite life cycle stages (35). Acridine orange is a technically difficult stain to use, requiring precise timing and fixatives or acids to allow incorporation of the dye into the cells. These factors plus the quenching of the dye upon binding to nucleic acids (34) reduce the reproducibility and reliability of this method (36). Additionally, acridine orange is a photodynamically toxic stain that damages cell membranes, reduces cell surface antibody binding, and is therefore self-limiting for investigation of complex markers in parasitized erythrocytes (36). To increase sensitivity of cell cycle stage detection by cytometry, a similar method was developed by Shapiro (36) using the vital stain Hoechst 33342 (HO) to identify DNA levels and Pyronin Y to detect the levels of RNA within cells. By combining these two stains Crissman et al. were able to identify G1, S, and G2 cell cycle stages of Chinese hamster ovary cells (37), but not for Plasmodium species.
Because HO has been used successfully to detect RBC parasitized by both mouse (35,38) and human (39) Plasmodium species, it has remained the focus of interest to malaria researchers. Jouin et al. (40) modified Shapiro’s method by using HO plus the RNA stain, thiazole orange (TO) (41). Thiazole orange preferentially stains the AU nucleotide doublets of RNA (42). Thiazole orange is a non-lethal vital stain that does not require fixatives or RNAse treatment for successful staining. This dye also has a significant signal when bound to RNA, increasing by >3,000 fold over unbound dye (42). When Pf life cycle stages were isolated on density gradients, Jouin et al. (40) showed a large difference in the staining patterns of the parasite stages using HO and TO. However, these studies used a large number of parasites, a lethal dose of HO which was 20-fold greater than previously described (35), and they did not identify life cycle stages from an asynchronous culture. The studies presented here tested and optimized the use of both HO and TO in viable cell cultures to demonstrate that this combination of nucleic acid dyes improves the study of Plasmodium growth and replication. Optimized staining enables clear differentiation of infected from uninfected cells and identification of developmental stages in parasitized erythrocytes by identifying DNA and RNA levels without damaging the cells or parasites. A research assay of this nature will improve in vitro evaluation of the stage-specific effects of anti-malarial drug activity (43) at clinically relevant parasitemias, inhibition of parasite erythrocyte invasion using antibodies (44,45), and further analysis of parasite protein expression during blood stage development.
Materials and Methods
Parasites and In Vitro Culturing
The Pf strain HB3 (MR4-155, contributed by T.E. Wellems, NIAID) was obtained from the Malaria Research and Reference Reagent Resource (ATCC, Manassas, Virginia). Before use, heparinized leukocyte-depleted O+ blood from adult volunteers was washed three times with RPMI-1640 and stored at 50% hematocrit at 4°C. Pf strains were cultivated at 5% hematocrit in complete malaria culture medium (CMCM) (RPMI-1640 supplemented with 25 mg/ml HEPES, 2 mg/ml sodium bicarbonate, 0.5% albumax II (Gibco, Grand Island, NY), 2.2 mM L-Glutamine, 0.08 mg/ml of gentamicin, and 0.2 mM hypoxanthine). All cultures were maintained at 37°C in an atmosphere of 5% CO2, 1% O2, and 94% N2, with daily medium changes (46).
Synchronization of P. falciparum Cultures
Late stage parasites were removed from a culture with 1% parasitemia by treatment with 5% D-sorbitol (Sigma, St. Louis, MO) for 10 min at 37°C, which preferentially leaves intact uninfected cells as well as ring and early trophozoite pRBC. After treatment, the cells, now at 0.18% parasitemia, were washed twice with 5 ml CMCM, resuspended to 5% hematocrit, and cultured for 56 h. Cultures were sampled every 8 h and stained as described below to assess development of the parasites from rings to early trophozoite, late trophozoite, early schizont, and late schizont and segmenter stages after using flow cytometry.
Enrichment of Late Trophozoite and Schizont Stages from In Vitro P. falciparum Cultures
Isolation of late trophozoite and schizont stages was performed using MS-MACS magnetic columns (Miltenyi Biotec, Auburn, CA) using recommended protocols (47). For this procedure, a parasite culture containing 108 total cells (1% parasitemia) was suspended in 2 ml of 1 × phosphate buffered saline pH = 7.4 (PBS), and loaded onto the MS column. Later stage parasites containing high levels of hemozoin, the paramagnetic by-product of erythrocyte digestion (48), were captured while the MS column was held in the magnetic field of the MiniMACS™ separation unit (Miltenyi Biotec, Auburn, CA). Uninfected cells or early stage parasites were washed off the column with 1 ml PBS. Late stage parasites were collected by removing the column from the magnetic field and eluting the parasitized cells with 2 ml of PBS.
Microscopy
Standard blood smear microscopy was performed as described previously (46) to determine parasitemia. In brief, thin smears were prepared by spreading 7 μl of blood from cultures with a glass slide, fixed in 100% methanol, stained in 4% Giemsa (Sigma-Aldrich, St. Louis, MO), and examined by oil immersion LM (1000×). Parasitemia was determined by counting the number of pRBC per 2,000 total erythrocytes. All stated parasitemias were the average of three replicates.
Fluorescence microscopy was performed on sorted cells stained with HO as described below using an Olympus BH-2 microscope (Center Valley, PA) equipped with a UV capable 100× oil immersion lens. Images were captured using Magna-Fire 2.0 (Optronics, Goleta, CA) with an Olympus Peltier cooled camera (Center Valley, PA).
Flow Cytometry
Optimal staining conditions of pRBC were determined after rigorously evaluating the concentrations (0.012 μM–4 μM Hoechst 33342 (Molecular Probes, Eugene, OR)), order of exposure (TO followed by HO, HO followed by TO, or both stains together), and duration (15–120 min) of exposure to each nucleic acid stain. In all initial optimization experiments a sample of parasite cultures, at a parasitemia of 1%, containing uninfected and pRBC (107 total cells), were resuspended in 400 μl of either CMCM with HO, or commercially available Retic-Count™ solution (Becton-Dickinson, Franklin Lakes, NJ) with or without HO as needed. The concentration of thiazole orange (100 ng/mL) was based on the extinction coefficient previously determined by Lee et al. (42). Samples initially stained with HO in CMCM were pelleted and the supernatant discarded before exposure to the second stain. These cells were resuspended in 400 μl of TO solution, which contained the starting concentration of HO, for 30 min. All staining was carried out in a 37°C incubator. Stained cells were examined using a 355 nm UV 20 mW Xcyte diode laser (Lightwave Electronics, Milpitas, CA) and a 488 nm 20 mW Sapphire blue laser (Coherent Inc. Santa Clara, CA) on a Becton-Dickinson LSRII flow cytometer (Franklin Lakes, NJ) to collect data from a minimum of 5 × 10⁴ cells (45). The HO dye (excitation max 355, emission max 465) was excited by a UV laser and detected by a 440/40 filter. Thiazole orange (excitation 510, emission max 530) was excited by a blue laser and detected by a 525/20 filter. Based on these optimization studies, all further experiments investigating the identification of specific life cycle stages of the parasite were performed by staining 107 cells simultaneously with 4 μM of HO in 400 μl TO stain for 75 min. It is important to note that the uninfected blood used for parasite culturing was leukocyte depleted and did not contain cells positive for either dye (data not shown).
For cell sorting, HO and TO stained Pf-infected cells were selected based upon their DNA copy number and sorted onto slides using a Beckman Coulter Epics Elite (Fullerton, CA). The resulting sorted cells were observed by fluorescence microscopy as described above. Becton-Dickinson FACS Diva 5.01(Franklin Lakes, NJ) and WinList 5.0 3D (Verity Software House, Topsham, ME) programs were used to collect, analyze, and represent all cytometry data.
Results
The rationale for the experiments performed in this study was based on the premise (shown in Fig. 1) that ring stage parasites (early G1 phase)contain DNA primarily and should stain with HO. Early trophozoites (late G1 phase) will begin to accumulate RNA as inferred by an increase in TO staining. As parasite DNA replication proceeds (S phase) late trophozoites and schizonts (≥4 nuclei) (40,49) increasing both DNA and RNA content, should be characterized by both increased HO and TO specific fluorescence. When the parasite reaches its spore-like, pre-lytic segmenter stage, DNA synthesis has ceased (G2 phase) and the parasitized erythrocyte has reached maximum levels of HO staining. By determining the optimum dose and timing of HO and TO staining, application of both stains to a Pf culture should allow for identification of Pf life cycle stages, from rings though the pre-lytic segmenter stages.
Figure 1.

Theoretical diagram of Hoechst 33342 and thiazole orange staining of P. falciparum infected erythrocytes. Staining of Pf samples with HO has shown that uninfected cells (light gray cube) can be distinguished from infected cells and that the DNA copy number (N) within the erythrocyte could be determined (38). By adding the nucleic acid stain TO, which is normally used to identify reticulocytes (42) (dashed oval), to determine the amount of RNA within the cells, it should be possible to distinguish parasite life cycle stages. When parasites initially invade erythrocytes they are in an early G1 phase in a stage known as rings (dark gray ovals). Multiple ring stage parasites can invade an erythrocyte at the same time. After ~6 h the cells begin increasing their RNA levels and are expected to maintain their DNA copy number, as they enter a later pre-nuclear division G1 phase known as the early trophozoite stage (lower black ovals) (25). After 24 h the parasites enter S phase replicating their DNA ~7–24 fold. As the parasites begin to replicate their DNA, they are now in a stage known as late trophozoites (lower half of the black oval at 45°). When the erythrocyte contains ≥4 nuclei they are known as schizonts (49) (upper half of the black oval at 45°) and when they reach their maximum DNA levels they enter a G2 phase known as segmenters before erythrocyte lysis. Based upon current understanding of the parasite life cycle it was anticipated that these different stages could be isolated by knowing the level of DNA and RNA expressed by the parasite.
Comparing LM and Flow Cytometric Assessment of In Vitro P. falciparum Replication
As a first step to verify that this method of determining Pf parasitemia in cultures by flow cytometry was comparable to LM, dilutions of an asynchronous in vitro culture were evaluated in triplicate using both methods. Based on previously used concentrations of HO (38,50) flow cytometry demonstrated a clear separation between infected (black) and uninfected (light gray) cells (Fig. 2A). In addition, we observed a strong correlation between the two methods in determining total percent parasitemia (slope = 1.060; r2 = 0.997) (Fig. 2B). Interestingly, HO staining distinguished the complexity of the pRBC by recognizing quantitative differences in nuclear content. This was shown in Figure 2A by large clusters of cells with relative mean HO fluorescence at 433, 855, 1,268, and additional pRBC with readings up to 10,000. These results suggested that flow cytometry was capturing information related to the number of parasite nuclei per infected erythrocyte as DNA content increased through parasite nuclear division. Because parasite replication requires expression of genes to grow and divide, it was predicted that additional information related to parasite development could be gained by monitoring accumulation of RNA through simultaneous staining of pRBC with TO.
Figure 2.
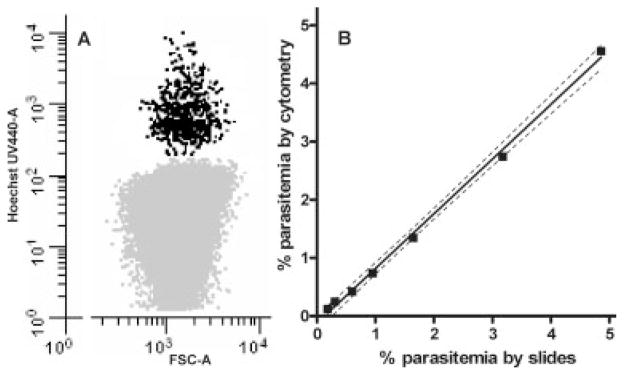
Comparison of different methods for determining parasitemia. Figure 2A is the dot plot from an unsynchronized culture with a 1% parasitemia stained with 4 μM HO which shows regular intervals of DNA positive cells possibly because of the different number of nuclei within the erythrocyte. Serial dilutions of a Pf culture were performed and the percent parasitemia was determined using two methods. First, LM using standard thin smears and Giemsa staining techniques were used to count the number of infected and uninfected RBC (>2,000) for each dilution to determine parasitemia. These results were compared with the percent parasitemia determined by staining cultures with Hoechst 33342 and counting 104 DNA positive erythrocytes by flow cytometry (Fig. 2B). All dilutions were tested in triplicate for both methods and the 95% confidence bands (dashed lines) demonstrate the consistency with which flow cytometry was comparable to the classic LM methods for identifying and counting pRBC.
Optimizing DNA and RNA Staining of P. falciparum-Infected Erythrocytes
A series of experiments was performed to optimize a strategy for staining both DNA and RNA of pRBC. When the concentration of HO used to stain Pf cultures (parasitemia = 0.76%) was too low (0.12 μM Fig. 3A) a large number of pRBC were not detected and determination of nuclear content (N) within the cell would not have been reliable. To determine the optimum dose of HO (4 μM Fig. 3B) in co-staining of Pf cultures, cells were stained with increasing concentrations of HO (0.012 μM to 4 μM) for 120 min before exposing the cells to the Retic-Count™ TO solution for 30 min (single dose 100 ng/mL) and measuring the fraction of detected pRBC. At concentrations of 0.04 μM the HO dye bound only 7.74% of the available DNA positive cells (Fig. 3C). The amount of DNA bound to pRBC increased logarithmically as the HO concentration was increased from 0.04 to 0.4 μM and reached maximal staining at 1.2 μM. At 4 μM, the HO appeared to interfere with the TO signal suggesting that at this concentration, DNA binding by TO was prevented. Therefore this combination (4 μM HO and 100 ng/mL TO) was selected to provide optimal staining of DNA and RNA content of pRBC. Separate experiments were performed to determine that the optimum duration of exposure of pRBC to these nucleic acid stains as single agents was 45–90 min at 4 μM of HO and 30–90 min of exposure to the TO solution (data not shown).
Figure 3.

Dose response and order of treatment of Plasmodium falciparum cultures with Hoechst 33342 and thiazole orange. When the concentration of HO used to stain Pf cultures is too low (Fig. 3A, 0.12 μM) many pRBC go undetected when compared with an optimized dose (Fig. 3B, 4 μM); parasitemia at both HO concentrations was 0.76%. A Pf culture was exposed to varying levels of HO from 0.012 μM to 4 μM (Fig. 3C) to determine the appropriate dose of the stain to use with Pf. Each dilution of the HO staining was repeated three times and the mean and standard error bars are shown. Because the RNA stain TO also has some ability to bind DNA the highest dose of HO (4 μM) was utilized in subsequent experiments. This dose allows for the exclusion of TO from binding to DNA showing a more accurate representation of DNA and RNA content of the various cell populations. Staining of a separate malaria culture was performed to determine how the order of stain addition affects the ability to determine the parasitemia and life cycle stages of the parasites (Fig. 3D). The whiskers indicate the entire range of the six replicate tests of each staining method with the mean and interquartile range indicated by the box.
The order in which the stains were added to cultures was as important as using the proper dose of the stains. While TO predominately stains RNA it does have some ability to stain DNA (42). Evidence illustrating competitive interactions between TO and HO is shown in Fig. 3D. Here a significantly higher number of TO-positive cells was observed when pRBC were exposed to the Retic-Count™ TO solution first (1705 ± 38.7) compared to when 4 μM HO was applied first (1424 ± 55.4, P = 0.002) or when both stains were applied together (1480 ± 35.5, P = 0.003). The addition of both stains at the same time, or HO before TO, had similar results, because HO is known not to detect RNA (36,51–53), and ensured consistent detection of both RNA and DNA positive cells. Additionally, exposure of pRBC to both stains at once increased the speed and reproducibility of these experiments.
Evaluating P. falciparum In Vitro Blood Stage Development
With this optimized strategy for staining pRBC, we reasoned that it should be possible to perform global evaluation of gene expression activity and DNA copy number and evaluate progression of a parasite population through the blood-stage developmental cycle. To monitor the number of nuclei per infected cell and assess differences in overall levels of gene expression during blood stage replication, an initial evaluation was made of an asynchronous culture (Fig. 4A–4I). Simultaneous HO and TO exposure identified cells that stained positive for both DNA and RNA content, respectively. The bivariate analysis shown in Figure 4 can be divided into pRBC with low levels of RNA (fluorescence <180) which were DNA positive (with 1, 2, or 3 nuclei) and cells in which RNA-based fluorescence was greater than 180 (Fig. 4A and 4B). Cells with increasing RNA correlated directly with increased DNA content (≥4 nuclei), consistent with S phase. These results suggest that parasites at the newly invaded ring, trophozoite, and schizont stages were distinctly different from each other by these two parameters. Overall, this was consistent with the expected results theorized in Figure 1, and could be tested further using techniques to enrich early (sorbitol) or late (paramagnetic capture) developmental stages of erythrocyte infection.
Figure 4.

Isolation of life cycle stages. Dot plots are colored as described in Figure 1. A mixed population of parasite stages found in a culture with a 2% parasitemia is shown in Figure 4A. The corresponding histogram (Fig. 4B) shows a wide distribution of cells with varying amounts of DNA and RNA found in the infected cells. The middle panels (Fig. 4D and 4E) represent a ring-enriched population that has been isolated from the mixed culture seen in the top panels using a sorbitol treatment that lyses most late-stage parasites. Rings contain one nucleus each and express very little RNA until they begin to transition to the later stages. To increase the amount of later stage parasites in a culture (Fig. 4G and 4H) the mixed population shown in Figure 4A was treated by subjecting the parasite culture to magnetic column fractionation. The histogram (Fig. 4H) shows a major shift towards cells with increased amounts of DNA and RNA fluorescence which was expected since schizonts contain 6–24 times as many copies of their genome compared with rings. This double staining method may yield additional information about the parasite life cycle. The black arrows in Figure 4A and 4D show cells may represent a Go population and/or a type of cells known as segmenters. This population regularly expresses lower RNA levels from the rest of the DNA positive cells and is resistant to sorbitol treatment. The picture insets (Fig. 4C, 4F, and 4I) are fluorescent microscopy photos of cells isolated from peaks designated on the histograms by range indicators. Cells from these peaks were isolated using a Coulter Epics Elite cell sorter to determine the number of nuclei (white arrows) found in the cells as shown by HO fluorescence.
By treating a heterogeneous culture of Pf with sorbitol (Fig 4D and 4E), there was a 3.5-fold reduction in the percentage of erythrocytes infected with late stage parasites, as well as almost complete elimination of RNA expressing cells to <0.2% of the sample. The black arrows in Figure 4 identify a population of pRBC that have high DNA copy number but slightly reduced RNA content, which are potentially segmenter stages that vary in number of merozoites they contain. Capture of hemozoin-laden trophozoites and schizonts on a magnetic column and elimination of many nonparamagnetic cells from the sample, reduced the number of early developmental stages by half, and enriched the percentage of later stages by a factor of four (Fig. 4G and 4H). The tightly packed magnetic column additionally enriched the sample for larger cells, namely reticulocytes. Uninfected reticulocytes were only TO positive (42), and are observed in the lower right quadrant of Figure 4G.
Further analysis of the preparations described above was performed by FACS and fluorescent microscopy. Parasitized erythrocytes from the first peak were observed to contain a single nucleus (Fig. 4C) while parasitized cells from the second peak contained two nuclei (Fig. 4F). In parasitized cells with a six-fold increase in HO fluorescence over the first peak, the fluorescent micrograph (Fig. 4I) showed a Pf-infected cell containing six nuclei.
If identification of parasite life cycle stages from Figure 4 was correct, it was reasoned that it would be possible to follow the parasite developmental program from early ring to late schizont stages. Ring stages would contain DNA but are metabolically quiescent, and so should contain little RNA. Early trophozoites would maintain their DNA content while accumulating RNA through gene expression. Late trophozoites and schizonts would contain increasing amounts of DNA and RNA as the parasite replicates its nucleus and prepares to continue its’ life cycle by lysing the host cell.
The observation of parasite progression through the life cycle was initiated by synchronizing a culture of Pf so predominantly early stage parasites were present in the culture. The culture was then allowed to grow for 56 h under normal culture conditions and samples were collected every 8 h over the course of one whole life cycle (Fig. 5). Tracking the nucleotide staining levels of the parasite life cycle stages over time led to the observation that the total parasitemia remained relatively steady (0.18–0.38%) until hour 40. After 40 h the parasitemia of the double stained cells dropped to 0.07% and the total parasitemia increased, at the expected time point (48), more than fivefold when the parasites lysed the erythrocytes, released their merozoites, and infected naïve erythrocytes. Consistent with this observation, as the parasites grew the percentage of erythrocytes that contained both DNA and RNA increased from only 12% of the infected population at 0 h, to 55% of the infected population by 32 h. By the 40 h time-point RNA-positive cells were increasing in DNA copy number as nuclear replication continued within schizonts. At 48 h the total number of RNA-positive/DNA-positive cells had decreased as erythrocyte lysis and merozoite reinvasion occurred. Finally, at 56 h we observed a return of RNA-positive cells with low DNA copy number (N = 1 or 2).
Figure 5.
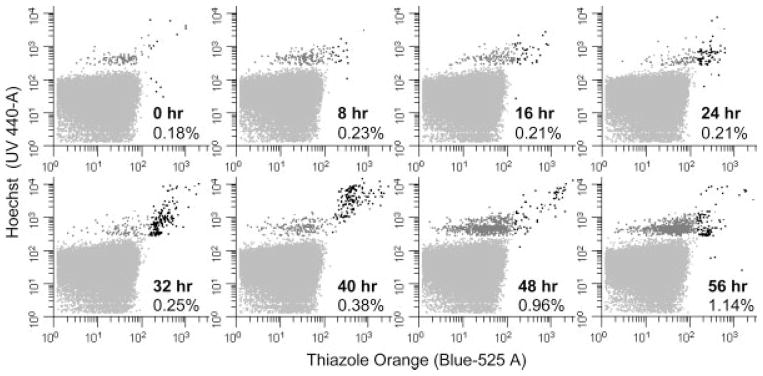
Parasite growth over time. Pf cultures were highly synchronized with sorbitol treatment leaving only uninfected erythrocytes and erythrocytes infected with rings stage parasites. This treated mixture was grown for 56 h and samples were taken every 8 h. Samples were optimally stained with HO and TO and counted by flow cytometry until 1000 DNA positive cells were observed. The overall percent parasitemia is shown in the lower right quadrant of each graph. Dot plots are colored as described in Figure 1. As the cells progress through their life cycle and express more RNA the cells progress from the upper left to the upper right quadrant. RNA levels steadily increases after 6 h (61) followed by DNA synthesis between 28–38 h (66). The anticipated sharp increase in parasitemia was detected between 40 and 48 h as the advanced stages lyse and merozoites infect naïve erythrocytes (48).
Discussion
Our studies have evaluated current strategies for flow cytometric analysis of in vitro Pf blood-stage development to improve the study of Pf cell and molecular biology. Generally, erythrocytes are enucleated and do not contain DNA. Erythrocytes infected with a single ring-stage Pf contain a single parasite nucleus but initially express relatively low levels of RNA. As the rings develop into trophozoites the DNA content of the infected cell remains stable while the level of RNA increases as the cell expresses genes needed for development and cell division (54). As schizogeny commences, DNA content increases via nuclear replication >10-fold (55) as RNA synthesis continues to increase. Development of a rapid flow cytometric test of parasite growth and development has enabled us to observe this dynamic processes during the Pf blood stage infection cycle. Based upon the haploid genome copy number of infected cells (which could be determined by HO fluorescence (56)) and the RNA levels (based on the range of TO fluorescence (42)) within the DNA positive cells, the life cycle stages of the parasite could be identified as proposed (Fig. 1).
Current nonmicroscopic techniques used to monitor parasite growth eliminate all potential evaluation of developmental stages during drug assays. Commonly used tritiated hypoxanthine uptake (9) assays not only rely upon high parasitemias but also the presence of late stage parasites to catabolize this reporter. Although hypoxanthine uptake can give general trends of the parasite’s response to anti-malarial drugs, it lacks the capacity to evaluate how all the parasite stages respond to drugs. It has been proposed that ring stage malaria parasites are inherently resistant to chloroquine (57), which may have contributed to the parasite’s inevitable resistance to this drug. Since the technique described here can assess parasite growth kinetics throughout blood stage development it may be used to provide more specific information about drug action and improve strategies for effective antimalarial drug treatment. Additionally, since this method does not require the use of fixatives, which halt cell function and has been observed to cause cells to autofluoresce (increasing false positives), it may be possible to evaluate repeated and cumulative dosing of antimalarial drugs on the same sample. Therefore, in vitro experiments will be able to mimic more closely the effects of long-term treatment with antimalarial drugs and monitor the potential for development of drug resistance.
Commonly used cytometry stains, such as propidium iodide and ethidium bromide, have been used to distinguish malaria infected from uninfected RBC (29,43). The dot plots resulting from treatment of Pf cultures with these stains have shown overlap of both uninfected and infected cells (29,43) containing low parasite DNA copy number (1–3 N). In contrast to the method described here, these stains can reliably identify only those cells with very high DNA content as occurs in late stage parasites. This can lead to an inaccurate measure of the overall number of infected cells and compromise assay reproducibility because newly infected cells will be indistinguishable from uninfected erythrocytes. The ability to detect early stage parasites accurately is particularly important when assessing the effectiveness of agents that would inhibit any biological processes necessary for the parasite to initiate growth and development. Additionally, invasion inhibition assays, that are beginning to provide new insight into acquisition of immunity rely upon determining the number of invasion events (58–60) or the change in parasitemia (44) and therefore require accurate measuring techniques. Refining technology used to measure acquired immunity is essential for improving capabilities for evaluating vaccine efficacy.
Additional information about the parasite life cycle may be gleaned from this double staining method. The black arrows in Figure 4A and 4D show a separate population that regularly expresses lower RNA levels from the rest of the DNA positive cells. These cells may represent a Go population and/or parasite stage known as segmenters (61). Segmenters are the late stage of the life cycle that the parasite enters just before erythrocyte lysis. The supposition that these populations were segmenters is implied as RNA expression is reduced during this stage (61) and this population was enriched by sorbitol treatment. These cells are resistant to sorbitol treatment (as shown in Fig. 4) which is why Pf cultures are treated twice at a 4 h intervals (48,59) to obtain a highly synchronized population of ring stage parasites. The HB3 strain of Pf used in these experiments has been reported to vary the number of merozoites (and therefore N) found in the segmenter stage from 8–24 (62), and this may explain why this shift is observed across a broad range of DNA copy number. Experiments culturing other strains of Pf with stable numbers of merozoites and sorting experiments in the future will provide more information about this population.
Previously mentioned alternative staining methods for studying Pf have been developed primarily because of the cost of purchasing and maintaining the UV laser needed to read cells stained by HO. However, the need for multicolor staining of samples and the significantly decreased cost of a UV laser has improved the availability of this equipment to more facilities. The method described here is not only more accurate and informative but is cost effective for cytometry and malaria research laboratories because of reduced protocol time (i.e. reduced washing, staining, or fixing steps, or cell counting by LM) and elimination of the purchase and disposal of radioactivity. Currently, experiments are underway to enhance the utility of this method by utilizing the High Throughput Sampler option for the Becton-Dickinson LSRII flow cytometer, which will allow for the rapid 96-well assessment (63) of growth for multiple parasite strains in the presence of drugs. Advances in cytometry may allow for further analysis of hemozoin crystal formation (64) also found in later stage parasites for more precise evaluation of parasite digestive physiology. Also, other common fluorochromes can be used to simultaneously evaluate the response of red blood cell surface markers (65) as parasites invade, develop, and modify the host erythrocyte.
In conclusion, this method provides a rapid, relatively inexpensive, and safe strategy to investigate parasite invasion of RBC and blood stage development. Future application of this method will pursue studies to evaluate stage specific effects of antimalarial drugs and drug combinations. Moreover, this method provides a new set of tools to be used for successful evaluation of various drug combinations against parasites throughout blood-stage infection.
Acknowledgments
Grant sponsor: NIH; Grant number: AI52312; Grant sponsor: National Research Service Award Geographic Medicine and Infectious Disease training fellowship; Grant number: AI07024; Grant sponsors: Howard Hughes Medical Institute Summer Program for Undergraduate Research (SPUR), Support of Undergraduate Research and Creative Endeavors (SOURCE).
Thank you to Kerry O’Connor and Arlene Dent for helpful discussions and critical evaluation of the methods and manuscript. We thank Kyle Carver and the Flow Cytometry Core Facility of the Comprehensive Cancer Center of Case Western Reserve University and University Hospitals of Cleveland (P30 CA43703) for their generous technical support.
Literature Cited
- 1.Trager W, Jensen J. Human malaria parasites in continuous culture. Science. 1976;193:673–675. doi: 10.1126/science.781840. [DOI] [PubMed] [Google Scholar]
- 2.Walliker D, Quakyi IA, Wellems TE, McCutchan TF, Szarfman A, London WT, Corcoran LM, Burkot TR, Carter R. Genetic analysis of the human malaria parasite Plasmodium falciparum. Science. 1987;236:1661–1666. doi: 10.1126/science.3299700. [DOI] [PubMed] [Google Scholar]
- 3.Wellems TE, Walker-Jonah A, Panton LJ. Genetic mapping of the chloroquine-resistance locus on Plasmodium falciparum chromosome 7. Proc Natl Acad Sci USA. 1991;88:3382–3386. doi: 10.1073/pnas.88.8.3382. [DOI] [PMC free article] [PubMed] [Google Scholar]
- 4.Walker-Jonah A, Dolan SA, Gwadz RW, Panton LJ, Wellems TE. An RFLP map of the Plasmodium falciparum genome, recombination rates and favored linkage groups in a genetic cross. Mol Biochem Parasitol. 1992;51:313–320. doi: 10.1016/0166-6851(92)90081-t. [DOI] [PubMed] [Google Scholar]
- 5.Gardner MJ, Hall N, Fung E, White O, Berriman M, Hyman RW, Carlton JM, Pain A, Nelson KE, Bowman S, et al. Genome sequence of the human malaria parasite Plasmodium falciparum. Nature. 2002;419:498–511. doi: 10.1038/nature01097. [DOI] [PMC free article] [PubMed] [Google Scholar]
- 6.Soldati D, Foth BJ, Cowman AF. Molecular and functional aspects of parasite invasion. Trends Parasitol. 2004;20:567–574. doi: 10.1016/j.pt.2004.09.009. [DOI] [PubMed] [Google Scholar]
- 7.Payne D. Spread of chloroquine resistance in Plasmodium falciparum. Parasitol Today. 1987;3:241–246. doi: 10.1016/0169-4758(87)90147-5. [DOI] [PubMed] [Google Scholar]
- 8.Anderson TJ, Roper C. The origins and spread of antimalarial drug resistance: Lessons for policy makers. Acta Trop. 2005;94:269–280. doi: 10.1016/j.actatropica.2005.04.010. [DOI] [PubMed] [Google Scholar]
- 9.Desjardins RE, Canfield CJ, Haynes JD, Chulay JD. Quantitative assessment of anti-malarial activity in vitro by a semiautomated microdilution technique. Antimicrob Agents Chemother. 1979;16:710–718. doi: 10.1128/aac.16.6.710. [DOI] [PMC free article] [PubMed] [Google Scholar]
- 10.Dorsey G, Kamya MR, Singh A, Rosenthal PJ. Polymorphisms in the Plasmodium falciparum pfcrt and pfmdr-1 genes and clinical response to chloroquine in Kampala, Uganda. J Infect Dis. 2001;183:1417–1420. doi: 10.1086/319865. [DOI] [PubMed] [Google Scholar]
- 11.Fidock DA, Nomura T, Talley AK, Cooper RA, Dzekunov SM, Ferdig MT, Ursos LM, Sidhu AB, Naude B, Deitsch KW, Su XZ, Wootton JC, Roepe PD, Wellems TE. Mutations in the P. falciparum digestive vacuole transmembrane protein PfCRT and evidence for their role in chloroquine resistance. Mol Cell. 2000;6:861–871. doi: 10.1016/s1097-2765(05)00077-8. [DOI] [PMC free article] [PubMed] [Google Scholar]
- 12.Ngo T, Duraisingh M, Reed M, Hipgrave D, Biggs B, Cowman AF. Analysis of pfcrt, pfmdr1, dhfr, and dhps mutations and drug sensitivities in Plasmodium falciparum isolates from patients in Vietnam before and after treatment with artemisinin. Am J Trop Med Hyg. 2003;68:350–356. [PubMed] [Google Scholar]
- 13.Triglia T, Menting JG, Wilson C, Cowman AF. Mutations in dihydropteroate synthase are responsible for sulfone and sulfonamide resistance in Plasmodium falciparum. Proc Natl Acad Sci USA. 1997;94:13944–13949. doi: 10.1073/pnas.94.25.13944. [DOI] [PMC free article] [PubMed] [Google Scholar]
- 14.Cowman AF, Morry MJ, Biggs BA, Cross GA, Foote SJ. Amino acid changes linked to pyrimethamine resistance in the dihydrofolate reductase-thymidylate synthase gene of Plasmodium falciparum. Proc Natl Acad Sci USA. 1988;85:9109–9113. doi: 10.1073/pnas.85.23.9109. [DOI] [PMC free article] [PubMed] [Google Scholar]
- 15.Plowe CV, Cortese JF, Djimde A, Nwanyanwu OC, Watkins WM, Winstanley PA, Estrada-Franco JG, Mollinedo RE, Avila JC, Cespedes JL, Carter D, Doumbo OK. Mutations in Plasmodium falciparum dihydrofolate reductase and dihydropteroate synthase and epidemiologic patterns of pyrimethamine-sulfadoxine use and resistance. J Infect Dis. 1997;176:1590–1596. doi: 10.1086/514159. [DOI] [PubMed] [Google Scholar]
- 16.Nagesha HS, Din S, Casey GJ, Susanti AI, Fryauff DJ, Reeder JC, Cowman AF. Mutations in the pfmdr1, dhfr and dhps genes of Plasmodium falciparum are associated with in-vivo drug resistance in West Papua. Indonesia Trans R Soc Trop Med Hyg. 2001;95:43–49. doi: 10.1016/s0035-9203(01)90329-3. [DOI] [PubMed] [Google Scholar]
- 17.Scheibel LW, Adler A, Trager W. Tetraethylthiuram disulfide (Antabuse) inhibits the human malaria parasite Plasmodium falciparum. Proc Natl Acad Sci USA. 1979;76:5303–5307. doi: 10.1073/pnas.76.10.5303. [DOI] [PMC free article] [PubMed] [Google Scholar]
- 18.Delhaes L, Lazaro JE, Gay F, Thellier M, Danis M. The microculture tetrazolium assay (MTA): Another colorimetric method of testing Plasmodium falciparum chemosensitivity. Ann Trop Med Parasitol. 1999;93:31–40. doi: 10.1080/00034989958771. [DOI] [PubMed] [Google Scholar]
- 19.Makler MT, Hinrichs DJ. Measurement of the lactate dehydrogenase activity of Plasmodium falciparum as an assessment of parasitemia. Am J Trop Med Hyg. 1993;48:205–210. doi: 10.4269/ajtmh.1993.48.205. [DOI] [PubMed] [Google Scholar]
- 20.Noedl H, Wernsdorfer WH, Miller RS, Wongsrichanalai C. Histidine-rich protein II: A novel approach to malaria drug sensitivity testing. Antimicrob Agents Chemother. 2002;46:1658–1664. doi: 10.1128/AAC.46.6.1658-1664.2002. [DOI] [PMC free article] [PubMed] [Google Scholar]
- 21.Corbett Y, Herrera L, Gonzalez J, Cubilla L, Capson TL, Coley PD, Kursar TA, Romero LI, Ortega-Barria E. A novel DNA-based microfluorimetric method to evaluate antimalarial drug activity. Am J Trop Med Hyg. 2004;70:119–124. [PubMed] [Google Scholar]
- 22.Smeijsters LJ, Zijlstra NM, Franssen FF, Overdulve JP. Simple, fast, and accurate fluorometric method to determine drug susceptibility of Plasmodium falciparum in 24-well suspension cultures. Antimicrob Agents Chemother. 1996;40:835–838. doi: 10.1128/aac.40.4.835. [DOI] [PMC free article] [PubMed] [Google Scholar]
- 23.Howard RJ, Battye FL, Mitchell GF. Plasmodium-infected blood cells analyzed and sorted by flow fluorimetry with the deoxyribonucleic acid binding dye 33258 Hoechst. J Histochem Cytochem. 1979;27:803–813. doi: 10.1177/27.4.87413. [DOI] [PubMed] [Google Scholar]
- 24.Hare JD. Two-color flow-cytometric analysis of the growth cycle of Plasmodium falciparum in vitro: Identification of cell cycle compartments. J Histochem Cytochem. 1986;34:1651–1658. doi: 10.1177/34.12.2431031. [DOI] [PubMed] [Google Scholar]
- 25.Hare JD, Bahler DW. Analysis of Plasmodium falciparum growth in culture using acridine orange and flow cytometry. J Histochem Cytochem. 1986;34:215–220. doi: 10.1177/34.2.2418101. [DOI] [PubMed] [Google Scholar]
- 26.Bhakdi SC, Sratongno P, Chimma P, Rungruang T, Chuncharunee A, Neumann HP, Malasit P, Pattanapanyasat K. Re-evaluating acridine orange for rapid flow cytometric enumeration of parasitemia in malaria-infected rodents. Cytometry A. 2007;71A:662–667. doi: 10.1002/cyto.a.20406. [DOI] [PubMed] [Google Scholar]
- 27.Li Q, Gerena L, Xie L, Zhang J, Kyle D, Milhous W. Development and validation of flow cytometric measurement for parasitemia in cultures of P. falciparum vitally stained with YOYO-1. Cytometry A. 2007;71A:297–307. doi: 10.1002/cyto.a.20380. [DOI] [PubMed] [Google Scholar]
- 28.Pattanapanyasat K, Udomsangpetch R, Webster HK. Two-color flow cytometric analysis of intraerythrocytic malaria parasite DNA and surface membrane-associated antigen in erythrocytes infected with Plasmodium falciparum. Cytometry. 1993;14:449–454. doi: 10.1002/cyto.990140415. [DOI] [PubMed] [Google Scholar]
- 29.Staalsoe T, Giha HA, Dodoo D, Theander TG, Hviid L. Detection of antibodies to variant antigens on Plasmodium falciparum-infected erythrocytes by flow cytometry. Cytometry. 1999;35:329–336. doi: 10.1002/(sici)1097-0320(19990401)35:4<329::aid-cyto5>3.3.co;2-p. [DOI] [PubMed] [Google Scholar]
- 30.Billker O, Dechamps S, Tewari R, Wenig G, Franke-Fayard B, Brinkmann V. Calcium and a calcium-dependent protein kinase regulate gamete formation and mosquito transmission in a malaria parasite. Cell. 2004;117:503–514. doi: 10.1016/s0092-8674(04)00449-0. [DOI] [PubMed] [Google Scholar]
- 31.Darzynkiewicz Z, Traganos F, Sharpless T, Melamed MR. Lymphocyte stimulation: A rapid multiparameter analysis. Proc Natl Acad Sci USA. 1976;73:2881–2884. doi: 10.1073/pnas.73.8.2881. [DOI] [PMC free article] [PubMed] [Google Scholar]
- 32.Darzynkiewicz Z, Sharpless T, Staiano-Coico L, Melamed MR. Subcompartments of the G1 phase of cell cycle detected by flow cytometry. Proc Natl Acad Sci USA. 1980;77:6696–6699. doi: 10.1073/pnas.77.11.6696. [DOI] [PMC free article] [PubMed] [Google Scholar]
- 33.Darzynkiewicz Z, Traganos F, Melamed MR. New cell cycle compartments identified by multiparameter flow cytometry. Cytometry. 1980;1:98–108. doi: 10.1002/cyto.990010203. [DOI] [PubMed] [Google Scholar]
- 34.Shapiro HM, Mandy F. Cytometry in malaria: Moving beyond Giemsa. Cytometry A. 2007;71A:643–645. doi: 10.1002/cyto.a.20453. [DOI] [PubMed] [Google Scholar]
- 35.Jacobberger JW, Horan PK, Hare JD. Cell cycle analysis of asexual stages of erythrocytic malaria parasites. Cell Prolif. 1992;25:431–445. doi: 10.1111/j.1365-2184.1992.tb01452.x. [DOI] [PubMed] [Google Scholar]
- 36.Shapiro HM. Flow cytometric estimation of DNA and RNA content in intact cells stained with Hoechst 33342 and pyronin Y. Cytometry. 1981;2:143–150. doi: 10.1002/cyto.990020302. [DOI] [PubMed] [Google Scholar]
- 37.Crissman HA, Darzynkiewicz Z, Tobey RA, Steinkamp JA. Correlated measurements of DNA. RNA, and protein in individual cells by flow cytometry. Science. 1985;228:1321–1324. doi: 10.1126/science.2408339. [DOI] [PubMed] [Google Scholar]
- 38.Janse CJ, van Vianen PH, Tanke HJ, Mons B, Ponnudurai T, Overdulve JP. Plasmodium species: Flow cytometry and microfluorometry assessments of DNA content and synthesis. Exp Parasitol. 1987;64:88–94. doi: 10.1016/0014-4894(87)90012-9. [DOI] [PubMed] [Google Scholar]
- 39.Franklin RM, Brun R, Grieder A. Microscopic and flow cytophotometric analysis of parasitemia in cultures of Plasmodium falciparum vitally stained with Hoechst 33342 application to studies of antimalarial agents. Parasitol Res. 1986;72:201–212. doi: 10.1007/BF00931147. [DOI] [PubMed] [Google Scholar]
- 40.Jouin H, Goguet de la Salmoniere Y, Behr C, Huyin Qan Dat M, Michel J, Sarthou J, Pereira da Silva L, Dubois P. Flow cytometry detection of surface antigens on fresh, unfixed red blood cells infected by Plasmodium falciparum. J Immunol Methods. 1995;179:11–12. doi: 10.1016/0022-1759(94)00265-x. [DOI] [PubMed] [Google Scholar]
- 41.Makler MT, Lee LG, Recktenwald D. Thiazole orange: A new dye for Plasmodium species analysis. Cytometry. 1987;8:568–570. doi: 10.1002/cyto.990080606. [DOI] [PubMed] [Google Scholar]
- 42.Lee LG, Chen CH, Chiu LA. Thiazole orange: A new dye for reticulocyte analysis. Cytometry. 1986;7:508–517. doi: 10.1002/cyto.990070603. [DOI] [PubMed] [Google Scholar]
- 43.Contreras CE, Rivas MA, Dominguez J, Charris J, Palacios M, Bianco NE, Blanca I. Stage-specific activity of potential antimalarial compounds measured in vitro by flow cytometry in comparison to optical microscopy and hypoxanthine uptake. Mem Inst Oswaldo Cruz. 2004;99:179–184. doi: 10.1590/s0074-02762004000200011. [DOI] [PubMed] [Google Scholar]
- 44.Haynes JD, Moch JK, Smoot DS. Erythrocytic malaria growth or invasion inhibition assays with emphasis on suspension culture GIA. Methods Mol Med. 2002;72:535–554. doi: 10.1385/1-59259-271-6:535. [DOI] [PubMed] [Google Scholar]
- 45.Persson KE, Lee CT, Marsh K, Beeson JG. Development and optimization of high-throughput methods to measure Plasmodium falciparum-specific growth inhibitory antibodies. J Clin Microbiol. 2006;44:1665–1673. doi: 10.1128/JCM.44.5.1665-1673.2006. [DOI] [PMC free article] [PubMed] [Google Scholar]
- 46.McNamara DT, Kasehagen LJ, Grimberg BT, Cole-Tobian J, Collins WE, Zimmerman PA. Diagnosing infection levels of four human malaria parasite species by a polymer-ase chain reaction/ligase detection reaction fluorescent microsphere-based assay. Am J Trop Med Hyg. 2006;74:413–421. [PMC free article] [PubMed] [Google Scholar]
- 47.Uhlemann A, Staalsoe T, Klinkert M, Hviid L. Analysis of Plasmodium falciparum-infected red blood cells. MACS & more. 2000;4:7–8. [Google Scholar]
- 48.Moore LR, Fujioka H, Williams PS, Chalmers JJ, Grimberg B, Zimmerman PA, Zborowski M. Hemoglobin degradation in malaria-infected erythrocytes determined from live cell magnetophoresis. FASEB J. 2006;20:747–749. doi: 10.1096/fj.05-5122fje. [DOI] [PMC free article] [PubMed] [Google Scholar]
- 49.Trager W, Rozario C, Shio H, Williams J, Perkins ME. Transfer of a dense granule protein of Plasmodium falciparum to the membrane of ring stages and isolation of dense granules. Infect Immun. 1992;60:4656–4661. doi: 10.1128/iai.60.11.4656-4661.1992. [DOI] [PMC free article] [PubMed] [Google Scholar]
- 50.Sramkoski RM, Wormsley SW, Bolton WE, Crumpler DC, Jacobberger JW. Simultaneous detection of cyclin B1, p105, and DNA content provides complete cell cycle phase fraction analysis of cells that endoreduplicate. Cytometry. 1999;35:274–283. doi: 10.1002/(sici)1097-0320(19990301)35:3<274::aid-cyto11>3.0.co;2-o. [DOI] [PubMed] [Google Scholar]
- 51.Arndt-Jovin DJ, Jovin TM. Analysis and sorting of living cells according to deoxyribonucleic acid content. J Histochem Cytochem. 1977;25:585–589. doi: 10.1177/25.7.70450. [DOI] [PubMed] [Google Scholar]
- 52.Halicka HD, Bedner E, Darzynkiewicz Z. Segregation of RNA and separate packaging of DNA and RNA in apoptotic bodies during apoptosis. Exp Cell Res. 2000;260:248–256. doi: 10.1006/excr.2000.5027. [DOI] [PubMed] [Google Scholar]
- 53.Monger BC, Landry MR. Flow cytometric analysis of marine bacteria with hoechst 33342. Appl Environ Microbiol. 1993;59:905–911. doi: 10.1128/aem.59.3.905-911.1993. [DOI] [PMC free article] [PubMed] [Google Scholar]
- 54.Bozdech Z, Llinas M, Pulliam BL, Wong ED, Zhu J, DeRisi JL. The transcriptome of the intraerythrocytic developmental cycle of Plasmodium falciparum. PLoS Biol. 2003;1:85–100. doi: 10.1371/journal.pbio.0000005. [DOI] [PMC free article] [PubMed] [Google Scholar]
- 55.Bruce-Chwatt L. Essential Malariology. New York: Wiley; 1985. [Google Scholar]
- 56.Jacobberger J, Horan P, Hare J. Analysis of malaria parasite-infected blood by flow cytometry. Cytometry. 1983;4:228. doi: 10.1002/cyto.990040307. [DOI] [PubMed] [Google Scholar]
- 57.Yayon A, Vande Waa JA, Yayon M, Geary TG, Jensen JB. Stage-dependent effects of chloroquine on Plasmodium falciparum in vitro. J Protozool. 1983;30:642–647. doi: 10.1111/j.1550-7408.1983.tb05336.x. [DOI] [PubMed] [Google Scholar]
- 58.John CC, O’Donnell RA, Sumba PO, Moormann AM, de Koning-Ward TF, King CL, Kazura JW, Crabb BS. Evidence that invasion-inhibitory antibodies specific for the 19-kDa fragment of merozoite surface protein-1 (MSP-1 19) can play a protective role against blood-stage Plasmodium falciparum infection in individuals in a malaria endemic area of Africa. J Immunol. 2004;173:666–672. doi: 10.4049/jimmunol.173.1.666. [DOI] [PubMed] [Google Scholar]
- 59.O’Donnell R, de Koning-Ward T, Burt R, Bockarie M, Reeder J, Cowman A, Crabb B. Antibodies against merozoite surface protein (MSP)-1(19) are a major component of the invasion-inhibitory response in individuals immune to malaria. J Exp Med. 2001;193:1403–1412. doi: 10.1084/jem.193.12.1403. [DOI] [PMC free article] [PubMed] [Google Scholar]
- 60.Grimberg B, Udomsangpetch R, Xainli J, McHenry A, Panichakul T, Sattabongkot J, Cui L, Bockarie M, Chitnis C, Adams J, Zimmerman PA, King CL. Plasmodium vivax invasion of human erythrocytes inhibited by antibodies directed against the duffy binding protein. PLoS Med. 2007;4:e350. doi: 10.1371/journal.pmed.0040337. [DOI] [PMC free article] [PubMed] [Google Scholar]
- 61.Arnot DE, Gull K. The plasmodium cell-cycle: Facts and questions. Ann Trop Med Parasitol. 1998;92:361–365. doi: 10.1080/00034989859357. [DOI] [PubMed] [Google Scholar]
- 62.Reilly HB, Wang H, Steuter JA, Marx AM, Ferdig MT. Quantitative dissection of clone-specific growth rates in cultured malaria parasites. Int J Parasitol. 2007;37:1599–1607. doi: 10.1016/j.ijpara.2007.05.003. [DOI] [PMC free article] [PubMed] [Google Scholar]
- 63.Edwards BS, Young SM, Oprea TI, Bologa CG, Prossnitz ER, Sklar LA. Biomolecular screening of formylpeptide receptor ligands with a sensitive, quantitative, high-throughput flow cytometry platform. Nat Protoc. 2006;1:59–66. doi: 10.1038/nprot.2006.9. [DOI] [PubMed] [Google Scholar]
- 64.Grobusch MP, Hanscheid T, Kramer B, Neukammer J, May J, Seybold J, Kun JF, Suttorp N. Sensitivity of hemozoin detection by automated flow cytometry in non-and semi-immune malaria patients. Cytometry B Clin Cytom. 2003;55:46–51. doi: 10.1002/cyto.b.10039. [DOI] [PubMed] [Google Scholar]
- 65.Woolley I, Wood E, Sramkoski R, Zimmerman P, Miller J, Kazura J. Expression of Duffy antigen receptor for chemokines during reticulocyte maturation: Using a CD71 flow cytometric technique to identify reticulocytes. Immunohematology. 2005;21:15–20. [PubMed] [Google Scholar]
- 66.Graeser R, Wernli B, Franklin RM, Kappes B. Plasmodium falciparum protein kinase 5 and the malarial nuclear division cycles. Mol Biochem Parasitol. 1996;82:37–49. doi: 10.1016/0166-6851(96)02716-8. [DOI] [PubMed] [Google Scholar]