

Abstract
We describe a genetic AND gate for cell-targeted metabolic labeling and proteomic analysis in complex cellular systems. The centerpiece of the AND gate is a bisected methionyl-tRNA synthetase (MetRS) that charges the Met surrogate azidonorleucine (Anl) to tRNAMet. Cellular protein labeling occurs only upon activation of two different promoters that drive expression of the N- and C-terminal fragments of the bisected MetRS. Anl-labeled proteins can be tagged with fluorescent dyes or affinity reagents via either copper-catalyzed or strain-promoted azide-alkyne cycloaddition. Protein labeling is apparent within five minutes after addition of Anl to bacterial cells in which the AND gate has been activated. This method allows spatial and temporal control of proteomic labeling and identification of proteins made in specific cellular subpopulations. The approach is demonstrated by selective labeling of proteins in bacterial cells immobilized in the center of a laminar-flow microfluidic channel, where they are exposed to overlapping, opposed gradients of inducers of the N- and C-terminal MetRS fragments. The observed labeling profile is predicted accurately from the strengths of the individual input signals.
The bio-orthogonal non-canonical amino acid tagging (BONCAT) method of proteomic analysis enables enrichment and identification of selected subsets of cellular proteins 1. The initial demonstration of the BONCAT method used the methionine (Met) surrogate azidohomoalanine (Aha) as a metabolic label; addition of Aha to cells at selected time points provides temporal control of proteomic labeling. In contrast to Aha, which is incorporated into proteins in all cells through the action of the wild-type methionyl-tRNA synthetase (MetRS), the bulkier Met surrogate azidonorleucine (Anl) can be used to restrict labeling to cells that express a mutant MetRS (designated NLL-MetRS)2. Sensitivity to cell state (e.g., to oxidative stress) can be achieved by controlling expression of the mutant synthetase with carefully chosen promoters3. However, it is not yet possible to specify cell state more precisely in such experiments, and to control proteomic labeling by integrating multiple signals to activate the NLL-MetRS.
Here we introduce a new approach in which multiple promoters (P1 and P2) are used to regulate Anl incorporation into the E. coli proteome. The approach relies on construction of a split MetRS that generates a translational output only in cells in which the P1 and P2 inputs are simultaneously on. The split MetRS functions as an AND gate to control protein labeling (Figure 1).
Figure 1.
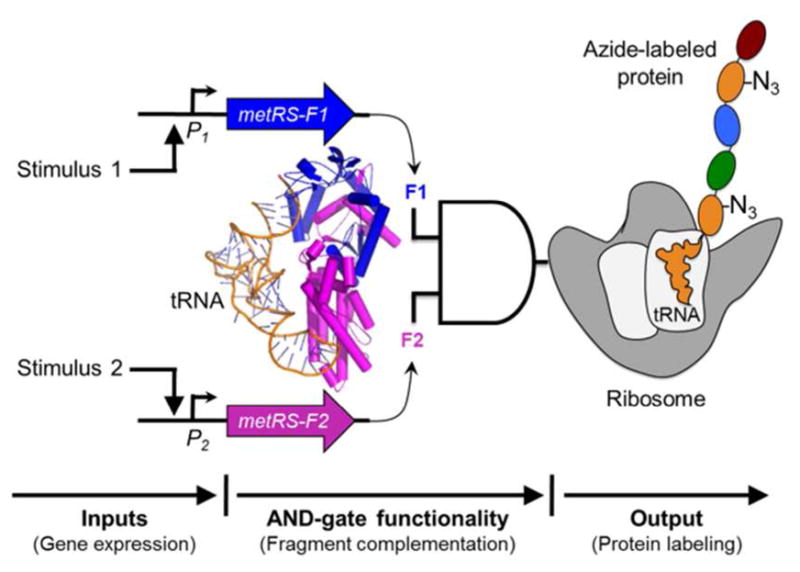
A genetic AND gate for proteomic labeling. Two promoters (P1 and P2) are used as inputs to drive expression of E. coli MetRS fragments F1 and F2. tRNAMet is charged with Anl only when the MetRS fragments are both expressed, and associate to form a functional enzyme. Ribosomes use Anl-charged tRNAMet during protein synthesis in competition with Met-charged tRNAMet. Newly synthesized proteins are labeled with azide groups, which can be selectively tagged by the azide-alkyne cycloaddition4. Diverse promoter inputs can be plugged into the AND gate to control proteomic labeling with Anl. The MetRS image was created using PDB 2CSX5.
We used protein fragment complementation to make a bisected MetRS6, prompted by the work of Schimmel and coworkers who showed that the E. coli MetRS could be cut at six different sites to yield functional split variants7. To assess which of the peptide bonds in the MetRS backbone should be broken to create fragments that associate to form the most active enzymes, transposase mutagenesis was used to construct a library of vectors that express split MetRS8 and active variants were selected via bacterial complementation. To avoid variants that require only a single fragment for activity, a gene fragment encoding MetRS residues 1-548 (designated MetRS henceforth) was used to construct the vector library (Figure 2a). The 1-548 variant is the smallest MetRS fragment that has been reported to exhibit near-native activity and stability9. E. coli strain CS50 was used for selecting functional variants on medium lacking Met10; growth was visible only when cells expressed an active MetRS (Figure 2b).
Figure 2.
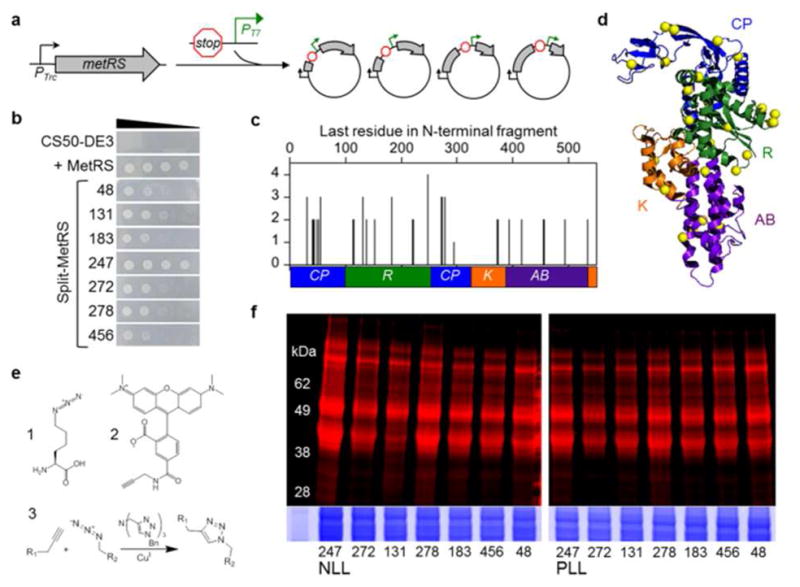
Identifying fragmented MetRS variants that metabolically label proteins with Anl. (a) DNA that contains a terminator, promoter (PT7), and ribosomal binding site was randomly inserted into the MetRS gene to create a library of vectors that express two-piece MetRS variants8. (b) Growth of E. coli CS50-DE3 cells in the absence of Met is compared for cells that express a functional MetRS truncation comprised of residues 1-548 and split MetRS variants. Ten-fold serial dilutions of cells were spotted on M9-agar plates and growth was imaged after 24 h. (c) Complementation strengths of fragmented MetRS variants, which were named based on the last residue encoded by their N-terminal fragments. (d) Color coding of the connective polypeptide [CP, blue], Rossmann fold [R, green], KMSKS [K, orange], and anticodon-binding [AB, purple] domains maps the locations of backbone fission (yellow spheres) in functional variants onto the MetRS structure11. (e) Structure of Anl (1), which can be detected in proteins after reaction with alkyne-functionalized tetramethylrhodamine (TAMRA) dye (2). Copper-catalyzed azide-alkyne cycloaddition (3) results in a stable triazole linkage. (f) Cells expressing the split NLL-MetRS and PLL-MetRS from the vectors selected using bacterial complementation were grown in the presence of Anl, and cell lysates were treated with TAMRA-alkyne dye. In-gel fluorescence image shows TAMRA labeling, which indicates Anl incorporation into cellular proteins. Colloidal blue staining (bottom) was performed to compare protein loading across lanes.
Selection by CS50-DE3 complementation yielded hundreds of colonies with varying complementation strengths (Figure S1). DNA sequencing of these clones identified MetRS variants with backbone cleavage sites lying within all four domains of the synthetase (Figure 2c, Table S1). Variants with the greatest complementation strength were cut within the connective polypeptide and Rossmann domains. Mapping the locations of backbone cleavage onto the MetRS structure (Figure 2d) revealed that cleavage in these domains yields fragments that make large numbers of intermolecular residue-residue contacts in the assembled enzyme (Figure S2).
We have shown previously that two MetRS triple mutants, L13N/Y260/H301 (NLL) and L13P/Y260/H301 (PLL), charge Anl with good efficiency12. The corresponding mutations were introduced into the vectors encoding the bisected MetRS variants that exhibited the strongest complementation (those with cut sites at residues 48, 131, 183, 247, 272, 278, and 456) (Figure S3). E. coli CS50-DE3 cells transformed with each mutant vector were grown to mid-log phase in liquid culture, and labeling was initiated by addition of 1 mM Anl (1, Figure 2e). After 1 h, cells were lysed and total cellular proteins were treated with alkyne-tetramethylrhodamine (TAMRA) dye (2, Figure 2e) for labeling via copper-catalyzed azide-alkyne cycloaddition (3, Figure 2e)4,13,14. After SDS-PAGE, TAMRA-labeled proteins were detected by in-gel fluorescence imaging (Figure 2f). All fourteen of the NLL and PLL split MetRS variants enabled Anl incorporation into cellular proteins. On the basis of this result and the strong complementation observed for wild-type MetRS(247) (Figure 2b), NLL-MetRS(247) was selected for further development.
To construct an AND gate for controlled labeling of cellular proteins with Anl, the coding sequences for the N- and C-terminal fragments of NLL-MetRS(247) were placed in a pair of vectors under control of PT5 and PBAD promoters, respectively. As expected, NLL-MetRS(247) showed IPTG- and arabinose-dependent activity, with the highest levels of metabolic protein labeling observed in cultures supplemented with both inducers. To be useful as an AND gate, the system described here should be active only when both IPTG and arabinose are present – not in the presence of a single inducer. However, we observed some activity even in the absence of IPTG, presumably as a consequence of leaky expression of the N-terminal fragment (Figure S4). This activity was readily eliminated by catabolite repression (Figure S5)15; in glucose-supplemented media, Anl labeling was observed only upon addition of both IPTG and arabinose (Figure 3a–c).
Figure 3.
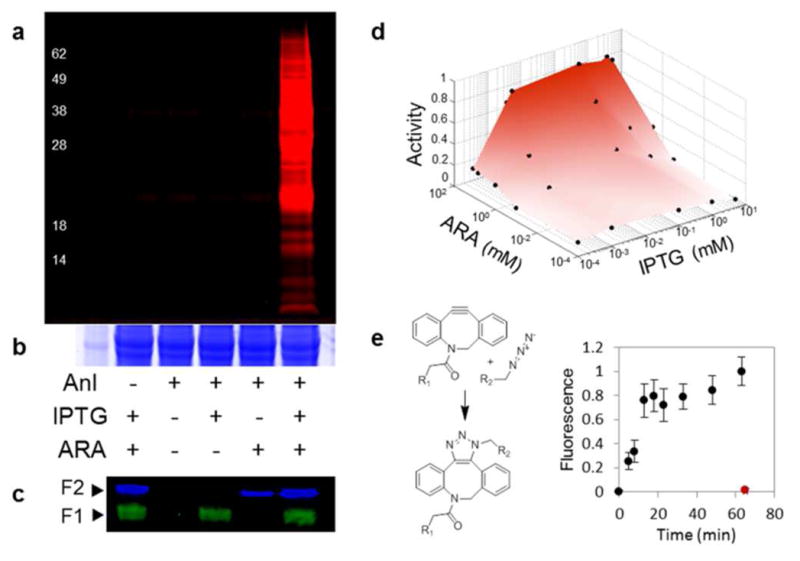
Genetic control of Anl incorporation into proteins in cells that express the N- and C-terminal fragments of NLL-MetRS( 247) under control of IPTG- and arabinose-inducible promoters. (a) Anl labeling of E. coli proteins in the presence or absence of IPTG (1 mM), arabinose (5 mM), and Anl (1 mM). Cell lysates were treated with an alkyne-TAMRA dye, and in-gel TAMRA fluorescence was imaged to detect Anl incorporation. (b) Colloidal blue staining of the gel in (a) confirms similar total protein in each sample. (c) Western blot detection of the N-terminal (green) fragment containing a His6 tag and the C-terminal (blue) fragment containing a hemagglutinin tag. (d) Effects of arabinose and IPTG levels on Anl incorporation. Cell lysates were treated with alkyne-TAMRA, and the in-gel fluorescence signal from TAMRA-labeled proteins was used to determine relative Anl incorporation levels. Dots on the surface show conditions under which Anl incorporation was measured. (e) Time-dependence of protein labeling upon addition of Anl to cells harboring the activated AND gate. IPTG (1 mM) and arabinose (5 mM) were added to activate the AND gate; Anl (1 mM) was added 3 h later (at 0 min on the time axis). Anl-labeled proteins were detected by treatment with azadibenzocyclooctyne-TAMRA dye (R1); labeling was quantified by in-gel fluorescence detection. When the AND gate was not activated but Anl was present, no measurable incorporation was observed even after 1 h, as shown by the red symbol.
To investigate how the output of the AND gate was controlled by variation in input levels, we used varying combinations of arabinose and IPTG concentrations to induce MetRS fragment expression and Anl incorporation. We found concentration-dependent expression of the N- and C-terminal fragments (Figure S6) and steep transitions between the on and off states (Figure 3d, and Figure S6). The time-dependence of Anl-labeling under control of the activated AND gate was monitored by detection of labeled proteins with an azadibenzocyclooctyne-TAMRA dye; labeling was apparent within 5 min after addition of Anl (Figure 3e). The rate of AND-gate activation upon induction by IPTG and arabinose was also measured (Figure S7). The rate of activation will depend on the particular promoters used to drive fragment expression.
Spatially controlled proteomic labeling of cells within complex multi-cellular systems is useful for study of a variety of important biological phenomena including biofilm formation and developmental patterning16,17. The MetRS AND gate provides a useful solution to such challenges because it can be activated by spatially regulated signals. As a step toward this goal, we sought to control Anl labeling in cells that are subjected to spatial gradients of activators. A laminar-flow microfluidic channel was used to expose surface-immobilized bacterial cells harboring the AND gate to opposing gradients of IPTG and arabinose. Anl incorporation should occur only in cells that encounter sufficient levels of both inducers (Figure 4a). The diffusion of IPTG and arabinose in the microfluidic channel was modeled (Figure S8) and diffusion analysis results were used to estimate inducer profiles across the width of the channel (Figure 4b).
Figure 4.
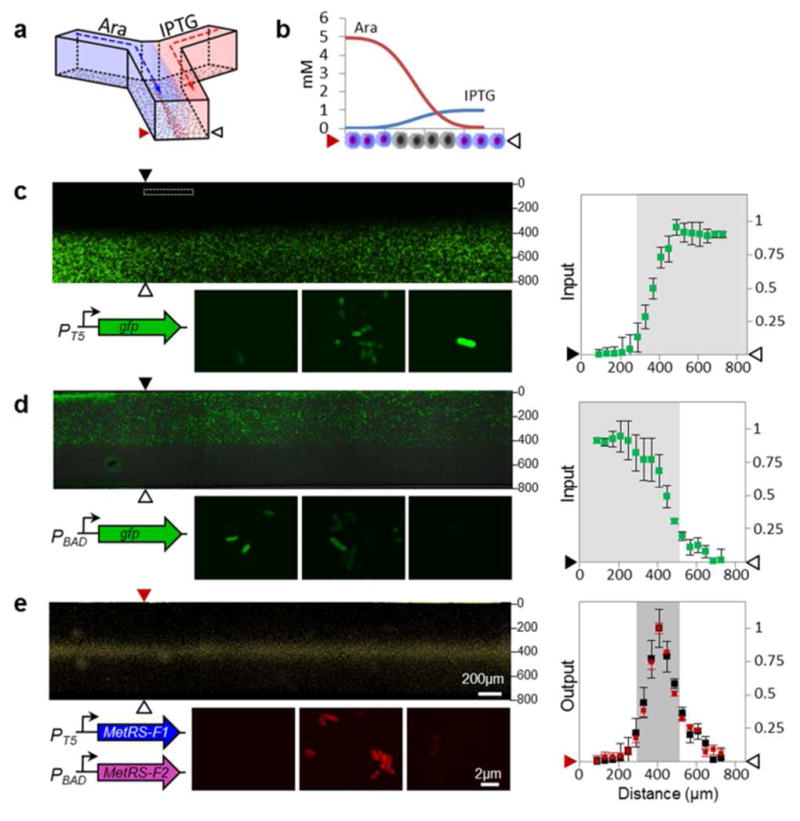
Spatial control of protein labeling. (a) A laminar flow microfluidic channel was used to expose surface-immobilized cells to gradients of arabinose and IPTG. In this device, the AND gate should be activated only in the center of the channel, where cells are exposed to both IPTG and arabinose. (b) Modeling of inducer diffusion was used to determine cross-channel concentration profiles of arabinose and IPTG at the locations shown by the arrows in (c, d, and e). Schematic shows that cells in the middle of the channel should incorporate Anl (gray); those on the periphery should not be labeled (purple). (c) Fluorescence image of the microfluidic channel (top) seeded with cells expressing GFP under IPTG control, and images of individual cells (bottom) that were incubated with varying combinations of inducers (left to right; 5 mM arabinose, 1 mM arabinose plus 0.1 mM IPTG, and 1 mM IPTG). GFP fluorescence was quantified as a function of distance from the wall of the channel at positions indicted by the arrows, and is plotted to the right. Fluorescence values were normalized by setting the maximum fluorescence to 1. (d) Fluorescence detection of arabinose-regulated GFP expression under conditions identical to (c); the corresponding normalized fluorescence values are plotted to the right. (e) Detection of Anl incorporation by labeling with TAMRA-alkyne dye. Conditions are identical to those used for (c). The plot to the right shows the TAMRA fluorescence intensity (red) as a function of distance from the wall of the channel. TAMRA fluorescence values represent the experimental output of the AND gate, and were normalized by setting the maximum fluorescence to 1. Black dots represent the products of the GFP fluorescence signals from plots in (c) and (d), which were point-wise multiplied to provide a measure of the predicted output of the AND gate. The products were normalized by setting the maximum signal to 1 in order to allow direct comparison to the TAMRA fluorescence values.
Dye diffusion experiments enabled visualization of similar gradients during flow, and confirmed the modeling results (Figure S9). To estimate the strengths of the individual AND-gate inputs, E. coli DH10B cells were transformed with constructs that expressed GFP under control of the same PT5 and PBAD promoters that were used for expression of the N-and C-terminal fragments of the AND gate. GFP expression revealed the activation profile of each promoter as a function of position across the width of the channel (Figure 4c–e).
Cells harboring the AND gate were immobilized in the microfluidic channel, exposed to the inducer gradients and Anl for 4 h, then fixed and treated with an alkyne-functionalized AlexaFluor 488 dye. Fluorescence imaging showed that Anl incorporation was confined to cells in the center of the channel (Figure 4e).
To confirm that the observed labeling profile is predictable from the strengths of the input signals, we used the activation profile of each promoter as reported by GFP expression. As expected, either for a bimolecular binding equilibrium or for a Boolean AND operation, the scalar product of the inputs closely matched the output signal as measured by Anl incorporation (Figure 4e). This result suggests that the protein labeling profile can be adjusted, by tuning the input promoter strengths, to be more- or less-sharply dependent on the gradients of local activators or morphogens. Conversely, using endogenous promoters to drive the AND gate should provide labeling outputs that closely match spatial patterns of promoter activation.
This work introduces a new AND gate based on protein fragment complementation6. The AND gate can be used to restrict protein labeling to subsets of cells in which specified promoters or genes of interest are active. Because the AND gate is genetically encoded, it should be easily integrated with previously reported transcription-based logic gates (e.g., AND, OR, NOR, and XOR gates)15,18,19 to create more complex genetic circuits with protein labeling as the output. As shown previously1,20,21, azide-labeled proteins can be affinity-tagged and purified for analysis by mass spectrometry. Thus the AND gate provides a powerful new tool for targeted analysis of cellular protein synthesis.
Supplementary Material
Acknowledgments
We are grateful for financial support by National Institutes of Health grant NIH RO1 GM062523 and the Programmable Molecular Technology Initiative of the Gordon and Betty Moore Foundation (D.A.T), the Institute for Collaborative Biotechnologies through grant W911NF-09-0001 from U.S. Army Research Office (D.A.T. and R.F.I.), the American Heart Association (J.J.S.), and the Robert A. Welch Foundation (J.J.S.). A.M. was supported by a scholarship from the National Science and Engineering Research Council of Canada and by a post-graduate scholarship from the Donna and Benjamin M. Rosen Center for Bioengineering at Caltech.
Footnotes
The authors declare no competing financial interests.
Experimental details and supporting information. This material is available free of charge via the Internet at http://pubs.acs.org.
References
- 1.Dieterich DC, Link AJ, Graumann J, Tirrell DA, Schuman EM. Proc Natl Acad Sci USA. 2006;103:9482. doi: 10.1073/pnas.0601637103. [DOI] [PMC free article] [PubMed] [Google Scholar]
- 2.Ngo JT, Champion JA, Mahdavi A, Tanrikulu IC, Beatty KE, Connor RE, Yoo TH, Dieterich DC, Schuman EM, Tirrell DA. Nat Chem Biol. 2009;5:715. doi: 10.1038/nchembio.200. [DOI] [PMC free article] [PubMed] [Google Scholar]
- 3.Ngo JT, Babin BM, Champion JA, Schuman EM, Tirrell DA. ACS Chem Biol. 2012;7:1326. doi: 10.1021/cb300238w. [DOI] [PMC free article] [PubMed] [Google Scholar]
- 4.Rostovtsev VV, Green LG, Fokin VV, Sharpless KB. Angew Chem Int Ed. 2002;41:2596. doi: 10.1002/1521-3773(20020715)41:14<2596::AID-ANIE2596>3.0.CO;2-4. [DOI] [PubMed] [Google Scholar]
- 5.Nakanishi K, Ogiso Y, Nakama T, Fukai S, Nureki O. Nat Struct Mol Biol. 2005;12:931. doi: 10.1038/nsmb988. [DOI] [PubMed] [Google Scholar]
- 6.Ullmann A, Jacob F, Monod J. J Mol Biol. 1967;24:339. doi: 10.1016/0022-2836(67)90341-5. [DOI] [PubMed] [Google Scholar]
- 7.Burbaum JJ, Schimmel P. Biochemistry. 1991;30:319. doi: 10.1021/bi00216a002. [DOI] [PubMed] [Google Scholar]
- 8.Segall-Shapiro TH, Nguyen PQ, Dos Santos ED, Subedi S, Judd J, Suh J, Silberg JJ. J Mol Biol. 2011;406:135. doi: 10.1016/j.jmb.2010.11.057. [DOI] [PubMed] [Google Scholar]
- 9.Mellot P, Mechulam Y, Le Corre D, Blanquet S, Fayat G. J Mol Biol. 1989;208:429. doi: 10.1016/0022-2836(89)90507-x. [DOI] [PubMed] [Google Scholar]
- 10.Somerville CR, Ahmed A. J Mol Biol. 1977;111:77. doi: 10.1016/s0022-2836(77)80133-2. [DOI] [PubMed] [Google Scholar]
- 11.Schmitt E, Tanrikulu IC, Yoo TH, Panvert M, Tirrell DA, Mechulam Y. J Mol Biol. 2009;394:843. doi: 10.1016/j.jmb.2009.10.016. [DOI] [PMC free article] [PubMed] [Google Scholar]
- 12.Tanrikulu IC, Schmitt E, Mechulam Y, Goddard WA, 3rd, Tirrell DA. Proc Natl Acad Sci USA. 2009;106:15285. doi: 10.1073/pnas.0905735106. [DOI] [PMC free article] [PubMed] [Google Scholar]
- 13.Tornoe CW, Christensen C, Meldal MJ. Org Chem. 2002;67:3057. doi: 10.1021/jo011148j. [DOI] [PubMed] [Google Scholar]
- 14.Hong V, Presolski SI, Ma C, Finn MG. Angew Chem Int Ed. 2009;48:9879. doi: 10.1002/anie.200905087. [DOI] [PMC free article] [PubMed] [Google Scholar]
- 15.Wang B, Kitney RI, Joly N, Buck M. Nat Commun. 2011;2:508. doi: 10.1038/ncomms1516. [DOI] [PMC free article] [PubMed] [Google Scholar]
- 16.Lucchetta EM, Lee JH, Fu LA, Patel NH, Ismagilov RF. Nature. 2005;434:1134. doi: 10.1038/nature03509. [DOI] [PMC free article] [PubMed] [Google Scholar]
- 17.Berk V, Fong JC, Dempsey GT, Develioglu ON, Zhuang X, Liphardt J, Yildiz FH, Chu S. Science. 2012;337:236. doi: 10.1126/science.1222981. [DOI] [PMC free article] [PubMed] [Google Scholar]
- 18.Tamsir A, Tabor JJ, Voigt CA. Nature. 2011;469:212. doi: 10.1038/nature09565. [DOI] [PMC free article] [PubMed] [Google Scholar]
- 19.Moon TS, Lou C, Tamsir A, Stanton BC, Voigt CA. Nature. 2012;491:249. doi: 10.1038/nature11516. [DOI] [PMC free article] [PubMed] [Google Scholar]
- 20.Hodas JJ, Nehring A, Hoche N, Sweredoski MJ, Pielot R, Hess S, Tirrell DA, Dieterich DC, Schuman EM. Proteomics. 2012;12:2464. doi: 10.1002/pmic.201200112. [DOI] [PMC free article] [PubMed] [Google Scholar]
- 21.Eichelbaum K, Winter M, Diaz MB, Herzig S, Krijgsveld J. Nat Biotechnol. 2012;30:984. doi: 10.1038/nbt.2356. [DOI] [PubMed] [Google Scholar]
Associated Data
This section collects any data citations, data availability statements, or supplementary materials included in this article.