Abstract
Spectral fingerprints of samples of three Panax species (P. quinquefolius L., P. ginseng, and P. notoginseng) were acquired using UV, NIR, and MS spectrometry. With principal components analysis (PCA), all three methods allowed visual discrimination between all three species. All three methods were able to discriminate between white and red ginseng and showed distinctive sub-groupings of red ginseng related to root quality (age/size). Analysis of variance (ANOVA) was used to evaluate the relative variance arising from the species, run, and analytical uncertainty and was used to identify the most information rich portions of the spectrum for NIR and UV. Accurate classification of the 3 species was obtained using partial least squares-discriminant analysis (PLS-DA) and fuzzy rule-building expert system (FuRES). Relatively poor accuracy was obtained using soft independent modeling of class analogy (SIMCA) when a single component was used.
Keywords: Panax ginseng, Panax quinquefolius, Panax notoginseng, spectral fingerprinting, principal component analysis, UV, NIR, MS, PLS-DA, SIMCA, FuRES
INTRODUCTION
The roots of American and Asian ginseng and Sanqi (Panax quinquefolius, P. ginseng, and P notoginseng, respectively) are well known herbal remedies, each with different health promoting properties, which are used throughout the world (1–9). The primary active components of all three are the ginsenosides (triterpenoid saponins) that are present either as aglycones or in glycosylated forms (1–9). The similarities of the roots and the difficulty in identifying powders and extracts have led to accidental misidentifications and intentional misrepresentations of the three species. Accurate identification of the species and the country of origin can have a significant economic impact.
The most common method of analysis has been separation by high performance liquid chromatography (HPLC) of an ethanolic extract with detection by either ultraviolet absorption spectrophotometry (UV) (3–9) or mass spectrometry (MS) (2). Less commonly used methods are HPLC with evaporative light scattering detection (10), thin layer chromatography (7), reflectance near-infrared spectrometry (1), Raman spectrometry (11), and genetic barcoding (12). Except for the last method, the focus of the instrumental methods has been on the ginsenosides. Little attention has been paid to the other components of the roots or the chemical composition as a whole.
Numerous studies have sought to differentiate between the ginsenoside content of the roots with respect to species, age, cultivation method (wild crafted versus domestic), root part (main roots, lateral roots, and root hairs), growing site (provinces in China), season (time of year), and post-harvest processing (red versus white P. ginseng) (1–9). The effects of other environmental factors, such as light, temperature, moisture, and nutrition, are still unknown (6). The interpretations of these studies have been questioned because of the limited number of samples analyzed (3,6).
Little is known about the natural variance of the total ginsenoside content of the roots (3,6). It is generally conceded that P. quinquefolius and P. ginseng are closer genetically than P. notoginseng (4), but considerable variation in the ginsenoside content has been observed within each species and within populations (roots within 1 m2) (3,6,13). Several fold differences in total and specific ginsensoide content have been reported for P. quinquefolius and P. notoginseng. One study of P. notoginseng reported a lack of genetic uniformity within a population and the authors questioned whether the plants could be considered to be of the same variety (7). It was emphasized that larger sample sizes were needed to reach valid conclusions as to the effect of genetic and environmental factors on ginsenoside concentrations (6).
A rapid means of differentiating between plant materials with respect to species, nutrition, growing site, growing year, and harvest is the use of chemical spectral fingerprinting (with no prior separation) in conjunction with analysis of variance (ANOVA) and/or pattern recognition (14–17). Previous work employing MS fingerprints and both unsupervised and supervised pattern recognition methods demonstrated that differentiation among all three Panax species could be achieved (18). In that study, 68 samples of P. quinquefolius, 11 samples of P. ginseng, and 4 samples of P. notoginseng were used. Soft independent modeling of class analogy (SIMCA), partial least squares-discriminant analysis (PLS-DA), and fuzzy rule-building expert system (FuRES) modeling allowed the three species to be identified with close to 100% accuracy. The loading patterns indicated that a significant number of non-ginsenosides characterized chemical differences among the species.
In the current study, 58 of the same Panax samples previously analyzed by two MS methods (18) were analyzed by two UV spectrophotometry methods and the original solids were analyzed by reflectance NIR spectrometry. Results for all 5 methods were compared using PCA to discriminate between the three species and patterns arising from the growing location of P. quinquefolius and the quality (age/size) of P. ginseng. ANOVA was used to identify the sources of variance and to identify enhanced spectral regions for NIR and UV determinations. Classification methods (SIMCA, PLS-DA, and FuRES) were tested for their ability to discriminate between species.
EXPERIMENTAL
A. Reagents
Water - Optima* grade ((Thermo Fisher Scientific Inc., Waltham, MA).
Acetonitrile - Optima* grade ((Thermo Fisher Scientific Inc., Waltham, MA)
Methanol - Optima* grade ((Thermo Fisher Scientific Inc., Waltham, MA)
Formic acid - Mass spectrometry grade (Sigma/Aldrich, St. Louis, MO).
Ginsenoside Rb2 (>95% purity, ChromaDex Inc., Irvine, CA).
HPLC mobile phase - formic acid in water 0.1% (A), formic acid in acetonitrile 0.1% (B).
B. Samples
For this study, 44 P. quinquefolius, 12 P. ginseng, and 4 P. notoginseng samples were obtained or purchased (Table 1).
Table 1.
Panax samples analyzed in this Study
| Sample Number | N | Label | Provider | Source |
|---|---|---|---|---|
| P. quinquefolius | ||||
| 1 | 23 | American Ginseng | Ginseng Board of Wisconsin1 | USA |
| 2 | 13 | American Ginseng | American Herbal Pharmacopoeia2 | USA |
| 3 | 4 | American Ginseng | Internet Retailer (Wisconsin farm) 3 | USA |
| 4 | 2 | American Ginseng | Internet Retailer (Canadian farm) 4 | Canada |
| 5 | 1 | American Ginseng | Ginseng Board of Wisconsin1 | Canada |
| 6 | 1 | American Ginseng | Ginseng Board of Wisconsin1 | China |
| P ginseng | ||||
| 7 | 3 | Asian Ginseng, red | American Herbal Pharmacopoeia2 | China |
| 8 | 2 | Asian Ginseng, white | American Herbal Pharmacopoeia2 | China |
| 9 | 1 | Kirin Red #1 | Internet Retailer5 | China |
| 10 | 1 | Kirin Red #3 | Internet Retailer5 | China |
| 11 | 1 | Kirin Red #5 | Internet Retailer5 | China |
| 12 | 1 | Shih Chu #25 | Internet Retailer5 | China |
| 13 | 1 | Shih Chu #80 | Internet Retailer5 | China |
| P. notoginseng | ||||
| 14 | 4 | Notoginseng | American Herbal Pharmacopoeia2 | China |
GB of Wisconsin
AHP
Wisconsin farm
Internet retailer
Starwest
C. Apparatus
NIR – Nicolet 6700 (Thermo-Electron, Waltham, MA, USA)
MS-Exactive - An Exactive mass spectrometer (Thermo Fisher Scientific Inc., Waltham, MA). Samples were introduced using an Accela high speed LC (Thermo Fisher Scientific Inc., Waltham, MA, USA) consisting of a quaternary pump with a vacuum degasser, a thermostatted column compartment, and an auto-sampler. Only a guard column was used.
MS-LCQ - An LCQ Classic ion-trap mass spectrometer (Thermo Fisher Scientific Inc., Waltham, MA). Samples were introduced using an Agilent 1100 HPLC (Agilent Technologies, Palo Alto, CA) consisting of a binary pump with a vacuum degasser, a thermostatted column compartment, an auto-sampler, and a diode array detector (DAD). Only a guard column (Adsorbosphere All-Guard Cartridge, C18, 5μm, 4.6 × 7.5 mm, Alltech Associates, Inc., Deerfield, IL) was used.
96-Well Plate Reader – Spectramax, Plus 384 (Molecular Devices, Sunnyvale, CA, USA).
Centrifuge. – IEC Clinical Centrifuge (Danon/IEC Division Needham H.T.S., USA)
Grinder. – IKA A 11 basic Analytical mill (IKA® Works, Inc. Wilmington, NC, USA)
LC Conditions - The HPLC-UV-MS method used a mobile phase consisting 0.1% formic acid in H2O (A) and 0.1% formic acid in acetonitrile (B) with isocratic elution at 60:40 (v/v) for 1.5 minutes. The flow rate used was 0.5 mL/min.
MS Conditions - Electrospray ionization (ESI) was performed in negative ion mode to obtain the MS spectra fingerprints. The parameters of both mass spectrometers were optimized for ginsenoside Rb2 by auto-tune using the Xcalibur software through infusion of ginsenoside Rb2 standard. For MS-EX: spray voltage, −4.0 kV; capillary temperature, 275.0 °C; sheath gas, 50.0 arbitrary units (au); aux gas, 15.0 au; spare gas, 5.0 au; max spray current, 100.00 μA; heater temperature, 365.0 °C. For MS-LCQ: spray voltage, −4.0 kV; capillary temperature, 275.0 °C; sheath gas, 80.00 au; aux gas, 10.00 au; and heated capillary temperature, 220 °C.
D. Sample Preparation
Grinding - Ginseng root samples were grounded into fine powder using a IKA A 11 basic Analytical mill with knife blade (1 minute/sample) and stored in desiccators.
Solids analysis – for each sample, 0.5 g was placed in a separate vial for reflectance NIR.
Extraction - Each dried ground sample 300 mg was mixed with 10.0 mL of methanol-water (60:40, v/v) in 15 mL polypropylene conical centrifuge tubes (Bection Dickinson and Company, NJ, USA) and sonicated for 60 min at room temperature. The extracted samples were centrifuged at 5,000 g for 15 min. The supernatant was filtered through a 17 mm (0.45 μm) PVDF syringe filter (VWR Scientific, Seattle, WA, USA). For LC-DAD, 5 μL of the extract was injected.
E. Data Acquisition
NIR – The 58 samples were analyzed in triplicate on 3 separate days producing 174 spectra. Spectra were acquired at approximately 2 cm−1 intervals between 4,000 and 10,000 cm−1. This experiment produced a data matrix with 174 rows comprising the spectra and 3112 columns corresponding to the wavenumber.
MS-Exactive - Spectral fingerprints were obtained in negative ion mode using flow injection. Spectra were summed over a 0.5 min interval over the total ion current peak. The 58 samples were analyzed in triplicate providing 174 spectra. The resulting data matrix had 174 rows comprising spectra and 1351 columns comprising mass measurements.
MS-LCQ – Spectral fingerprints were obtained in negative ion mode using flow injection. Spectra were summed over a 0.5 min interval over the total ion current peak. Triplicate analyses of the 58 different samples on 3 different days yielded 174 spectra. The resulting data matrix had 174 rows comprising spectra and 1301 columns of mass measurements.
UV-Flow Injection - Spectra were acquired using the MS-LCQ with flow injection through a guard column. Spectra were summed over a 0.5 min interval as the sample flowed through the DAD. Duplicate analyses of the 58 different samples yielded 116 spectra. Data were acquired at 2 nm intervals between 200 and 400 nm resulting in a data matrix with 116 rows comprising spectra and 101 columns corresponding to wavelength.
UV-96 Well Plate Reader – Each of the 58 samples was delivered by pipet into a well on 2 different plates and each plate was read 3 times resulting in 344 UV spectra. Data were acquired at 1 nm intervals between 200 and 400 nm. The resulting data matrix had 344 rows comprising spectra and 201 columns corresponding to wavelength.
F. Data Processing
The data matrices were exported to Solo (Eigenvector Research, Inc., Wenatchee, WA, USA) for principal component analysis (PCA). The classification methods, soft independent modeling of class analogy (SIMCA), partial least squares-discriminant analysis (PLS-DA), and the fuzzy rule-building expert system (FuRES) modeling were performed using programs developed for MATLAB (Mathworks, Natick, MA, USA). Preprocessing for PCA, SIMCA, PLS-DA, and FuRES consisted of normalization of each sample (the sum of squares of all the intensities in each spectrum was set equal to 1.0). For NIR and UV spectra, the data were transformed to the second derivative using a third order polynomial fit to a 15 data point window. For classification, the principal component transform (PCT) was used to reduce the computational load when the number of variables exceeded the number of objects. The PCT is a lossless compression method that used the MATLAB function SVD to calculate the full set of row eigenvectors from the model-building data. The prediction data were projected onto this set of eigenvectors to compress them to the same size.
G. Classifiers
A home-built SIMCA script was written for MATLAB. Each class of training data was processed separately. The data for the class model were mean-centered and principal components were calculated using the SVDS function in MATLAB. In this paper, a first order model (single principal component) was used for all the evalutions, models with other orders systematically investigated. Confidence limits for each model were based on the Hotelling T2 and the Q statistic (19). The Hotelling T2 statistic is the multidimensional equivalent of Student’s t statistic. It characterizes the multivariate standardized variance of an object from the model, whereas the Q statistic characterizes the lack of fit of a data object to the model by the residual variance.
A home-built PLS2 script was written that is described in detail (20). The algorithm divides the training data into two Latin partitions for which the results are pooled for each of 10 bootstraps. The average prediction error with respect to component number is calculated for the 10 bootstraps. The number of latent variables in the PLS model is determined by the minimum of the average prediction error.
A home-built FuRES classifier was written that is described in detail (21). FuRES builds classification trees and has no adjustable parameters such as the number of components or latent variables of SIMCA and PLS. FuRES uses a divide and conquer algorithm to construct rules that minimize the fuzzy entropy of classification. The degree of fuzziness is selected that maximizes the first derivative of the fuzzy entropy with respect to the rule temperature. This constraint speeds up the optimization, reduces local minima, and furnishes robust and reproducible multivariate rules.
Generalized validation was accomplished using bootstrapped Latin partitions (22,23). This method characterizes a key source of variation which is the partitioning the data into a prediction and calibration sets. Confidence intervals can be obtained by bootstrapping that characterize the reproducibility of the method and allow statistical comparisons to be made among the different methods. Latin partitions randomly divide the data into equally sized subsets for which the class distributions are the same. Each partition is used once for prediction while the others are used for calibration. The prediction results of the partitions are pooled. The procedure is repeated several times and the average prediction results are reported with confidence intervals.
All calculations were performed with the 64 bit version of MATLAB 2010a (version 7.10) with the Optimization Toolbox (version 5.0). The software was executed on a homebuilt Intel Core i7-860 Lynnfield 2.93 GHz LGA 1156 Quad Core processor computer equipped with 4 GBs of DDR3 RAM that operated under MS Window 7 (version 6.1) 64 bit Enterprise version.
RESULTS
Principal Component Analysis
Spectral fingerprints were acquired for samples of three species of Panax using NIR, two UV spectrophotometers, and two MS (24). The NIR fingerprints were acquired for finely powdered samples with no sample preparation other than grinding. Both sets of UV and MS spectra were acquired from methanol-water extracts of the powdered samples. The MS data were acquired using flow injection (through a guard column) to the Exactive (MS-EX) and the LCQ (MS-LCQ), both from Thermo Scientific, Waltham, MA, USA. One set of UV data were acquired using flow injection to the LCQ (UV-FI) and other set were acquired using a 96-well plate reader (UV-96WPR). The 58 samples listed in Table 1 were analyzed by all 5 methods.
NIR Fingerprints
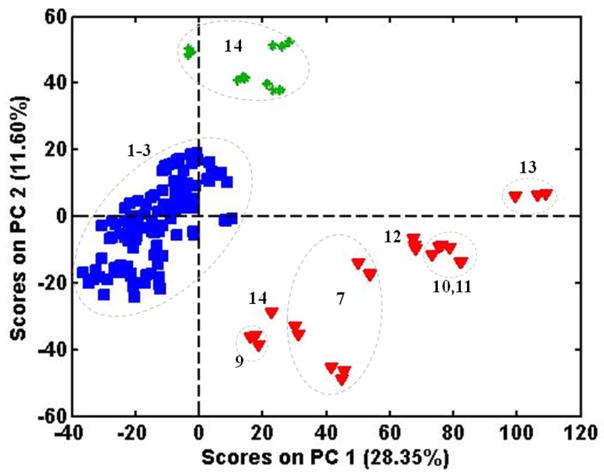
Figure 1 shows the object score plot obtained for PCA of the derivatized and normalized NIR spectra of all the samples from all 3 species using the entire spectrum (4,000–10,000 cm−1). The three species are clearly separated. However, while the clusters for P. quinquefolius and P. notoginseng are relatively amorphous, the P. ginseng cluster has distinct sub-groupings which are related to their quality, i.e., the numerical rating was supplied by the distributor and reflects age and size. Samples of Kirin 1, 3, and 5 (#9-#11 in Table 1) and Shih Chu 25 and 80 (#12 and #13 in Table 1) are identified in the figure and show a progression from left to right with increasing label number, i.e., Kirin 1 and Shih Chu 25 further to the left and Kirin 3 and 5 and Shih Chu 80 further to the right. Samples from American Herbal Pharmacopoeia labeled as “red ginseng” (#7) fall between the Kirin 1 and the Shih Chu 25.
Figure 1.
PCA scores from NIR spectra for all three Panax species.
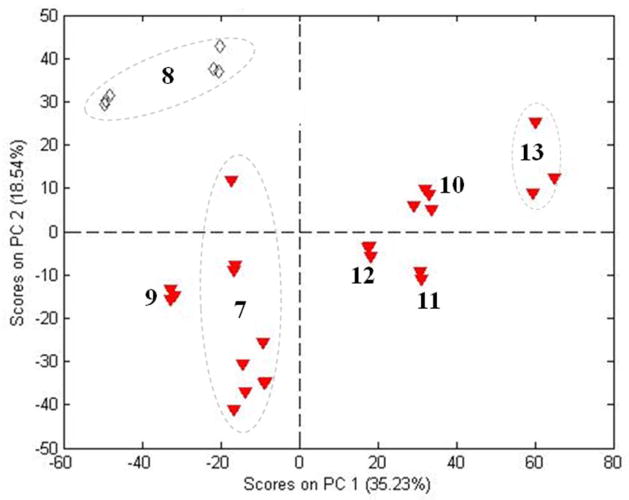
The sub-grouping observed for P. ginseng in Figure 1 led us to apply PCA to each of the species individually. No pattern was noted in the score plot for P. notoginseng (not shown). The object score plot for P. ginseng (Figure 2) has the same sub-groupings that appear in Figure 1. All the samples lie within the 95% confidence limit based on Hotelling T2. All the P. ginseng samples in Figure 1 (#7 and #9–#13) were labeled “red’ ginseng by the sources. Two samples from AHP labeled “white” ginseng (#8) have been added to Figure 2. These samples were bleached with sulfite prior to drying. These samples lie above the “red” ginseng samples, although they are still within the 95% confidence limit for the whole population.
Figure 2.
PCA scores from NIR spectra for P. ginseng samples.
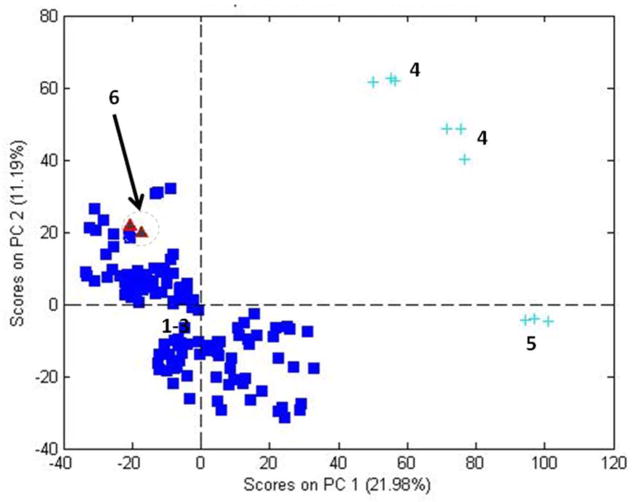
The PCA object score plot for P. quinquefolius is shown in figure 3. The main cluster consists of samples grown in the US (#1–#3 in Table 1). The three clusters of samples (#4 and #5) that lie to the right of the cluster of US samples are samples grown in Canada and are outside the 95% confidence limit. A sample grown in China (#6) lies just above the cluster of samples grown in the US, but within the 95% confidence limit. The separation of the Canadian grown samples from the US samples is much greater in Figure 3, where only the variance of the P. quinquefolius samples is considered, than in Figure 1 where all three species contribute to the variance.
Figure 3.
PCA scores from NIR spectra for P. quinquefolius samples.
UV Fingerprints
As stated earlier, UV spectra were acquired by: 1.) flow injection using an HPLC autosampler through a guard column to a diode array detector (UV-FI) and 2.) a 96-well plate reader (UV-96WPR). Both methods offer fully automated data acquisition.
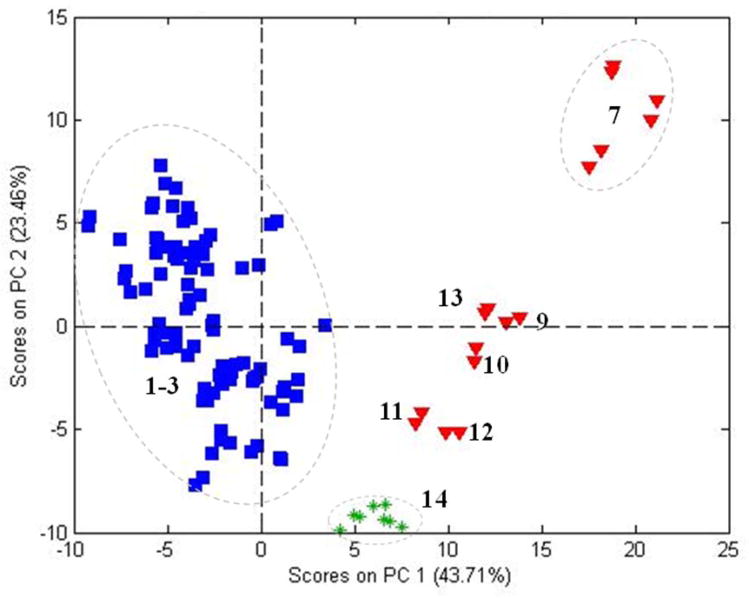
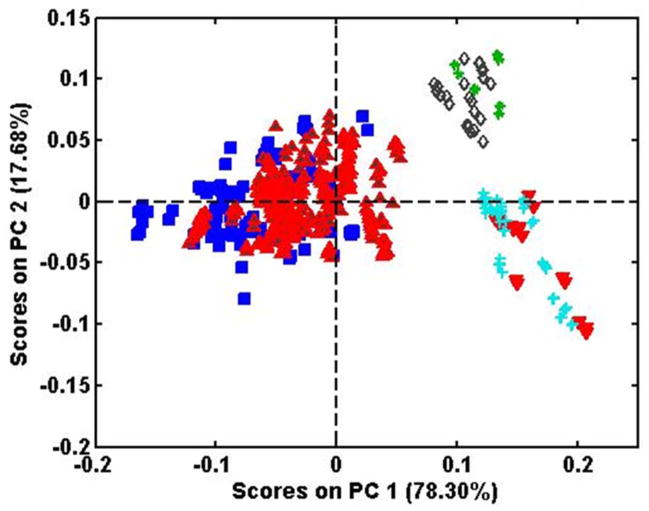
The PCA object score plot for UV-FI spectra (240–400 nm at 2 nm intervals) is shown in Figure 4. The score plot is very similar to that for NIR (Figure 1). The species are separated on two PCs to the same extent as observed with NIR and the sub-groupings of P. ginseng are very distinct compared to the other 2 species. The order of separation of the P. ginseng samples is closer to that for MS (shown later) than for NIR. The object score plots for PCA of the individual species (not shown) were similar to those acquired by NIR (Figures 2 and 3). P. notoginseng presented no pattern while the pattern for P. ginseng was similar to the pattern of scores in Figure 2. For P. quinquefolius, the Canadian grown samples were separated from the US samples, but all the sample scores were within the 95% confidence limit.
Figure 4.
PCA scores from UV-FI spectra for all three Panax species using wavelengths 240–400 nm.
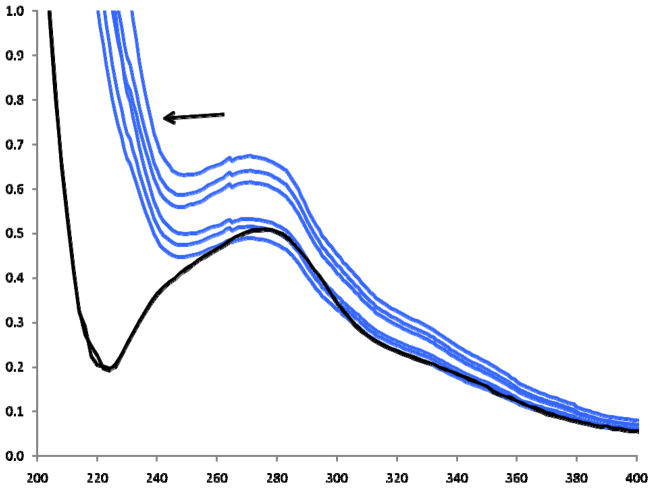
The PCA object scores for UV-96WPR were very similar to those for UV-FI. This similarity is apparent in Figure 5 where the scores for both UV-FI and UV-96WPR spectra are plotted together. There is almost perfect overlap for each of the three 3 clusters of the different species. The plots in Figure 5 were obtained using spectra from 270 to 400 nm. Inclusion of wavelengths below 270 nm caused the sample scores to differ between the two methods (not shown). This difference was caused by the difference in optical transmission between the two methods in the far UV. The 96-well plates used in these analyses were constructed of a UV-transparent acrylic. Figure 6 compares the spectra of a sample analyzed in duplicate by UV-FI and 6 times (duplicate plates analyzed in triplicate) by UV-96WPR. The UV cut-off wavelength of the plate appears to be approximately 230 nm, considerably higher than the 190 nm cut-off expected for a quartz window. The refraction limit imposed by the samples analyzed by UV-FI was approximately 210 nm.
Figure 5.
PCA scores from UV-FI and UV-96WPR spectra for all three Panax species using wavelengths 270–400 nm.
Figure 6.
UV spectra for UV-FI (duplicate analyses) and UV-96WPR (6 repeat analyses).
MS Fingerprints
Analyses of the same Panax samples were previously reported for spectra acquired using an Exactive (MS-EX) and an LCQ (MS-LCQ) (24). The separation of the three species by MS was relatively greater than was observed for NIR (Figure 1) for both the MS-EX spectra (Figure 7A) and the MS-LCQ spectra (not shown). Inclusion of the third PC (Figure 7B) for the MS-EX spectra reveals the same distinctive sub-grouping observed with NIR, although the numerical sequence of the scores is not the same. Certainly, the distinctive sub-grouping is apparent as compared to the amorphous clusters for P. quinquefolius and P. notoginseng. The sub-grouping was less distinct with the MS-LCQ spectra. Examination of the loadings for the third PC showed that the most significant ion contributing to the separation was m/z 323, a dihexoside.
Figure 7.
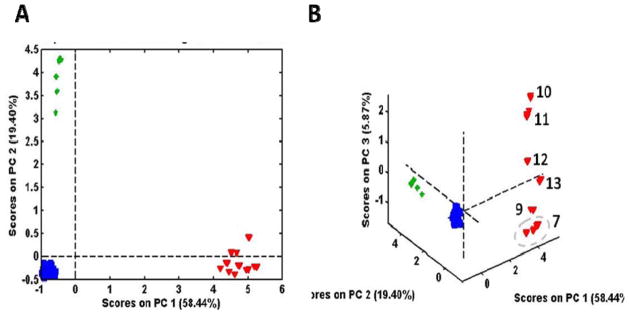
PCA scores from MS-EX spectra for all three Panax species showing: A) the first two PCs and B) the first 3 PCs.
ANOVA
Analysis of variance was used to determine the variance associated with the species means, sample means, run means, and analytical uncertainty (Table 2). For the UV-96WPR data, the variance arising between plates was also determined.
Table 2.
ANOVA expressed as percentage of total variance
| 1 | 2 | 3 | 4 | 5 | 6 | 7 | 8 | 9 | |
|---|---|---|---|---|---|---|---|---|---|
| NIR | NIR | NIR | UV FIA | UV 96WPR | UV FIA | UV 96WPR | MS EX | MS LCQ | |
| Source of Variance | All* | Region 1* | Region 2* | 220–400 | 240–400 | 280–320 | 280–320 | ||
| Between Species | 24.0 | 33.4 | 39.0 | 62.9 | 63.6 | 81.6 | 82.5 | 64.7 | 41.6 |
| Between Samples | 73.4 | 65.3 | 53.0 | 35.8 | 33.8 | 18.1 | 16.1 | 34.7 | 36.6 |
| Between Plates | 0.1 | 0.1 | |||||||
| Between Runs | 0.1 | <0.1 | <0.1 | <0.1 | 1.8 | <0.1 | 1.1 | 0.1 | 6.0 |
| Analytical Uncertainty | 2.5 | 1.2 | 8.0 | 1.3 | 0.7 | 0.3 | 0.3 | 0.5 | 15.8 |
| Total | 100.0 | 99.9 | 100.0 | 100.0 | 100.0 | 100.0 | 100.1 | 100.0 | 100.0 |
All wavenumbers, 4,000–10,000 cm−1; Region 1, 4300–4799 cm−1; Region 2, 5500–5900 cm−1)
NIR Fingerprints
We considered three spectral regions when applying ANOVA to the NIR spectra (Table 2, columns 1–3); the whole spectra (4,000–10,000 cm−1) and two high information regions (region 1 from 4,300–4,700 cm−1 and region 2 from 5,500–5,900 cm−1) lying between the water bands. The third band (7,000–10,000 cm−1) was not considered as it had previously been shown to provide little information (24). In this study, the variance associated with the water bands (4,700–5,500 cm−1 and 5,900–7,000 cm−1) was found to be primarily associated with the analytical uncertainty (not shown) and had little influence on the means of the species or samples.
Regions 1 and 2 (Table 2, columns 2 and 3) have greater variance between species means, compared to the whole spectrum, suggesting enhanced ability to discriminate between species but less ability to discriminate between samples. Object score plots for regions 1 and 2 (not shown) showed increased separation between the P. quinquefolius and P. ginseng clusters, but less separation between P. quinquefolius and P. notoginseng.
The PCA object score plot for the NIR spectra showed distinctive sub-groupings for P. ginseng as compared to the other two species. In addition, more subtle sub-groupings of P. quinquefolius with respect to location were seen as compared to P. notoginseng. These differences are not reflected by the data in Table 2. However, an examination of the average of the residuals for each species (not shown) reveals that the values for P. ginseng are 2 to 5 times greater than those for P. quinquefolius, which in turn is approximately 2.5 times that of P. notoginseng. The average of the species residuals must be considered because the number of samples per species is not equal. Thus, the distinctive sub-groupings arising from the quality of P. ginseng and, to a lesser extent, the growing location of P. quinquefolius are observed with ANOVA in the form of greater variance of the species residuals around the mean.
UV Fingerprints
Not surprisingly, ANOVA of the full wavelength ranges of the derivatized UV spectra from both methods (UV-FI and UV-96WPR) were essentially identical (Table 2, columns 4 and 5). The biggest difference between the two methods was the larger variance between runs observed for UV-96WPR. In this study, duplicate plates were prepared (see Experimental section) and each plate was read 3 times. Using ANOVA, it was determined that the plate preparation contributed negligible variance (0.1%) while the difference between read cycles accounted for 2% of the total variance.
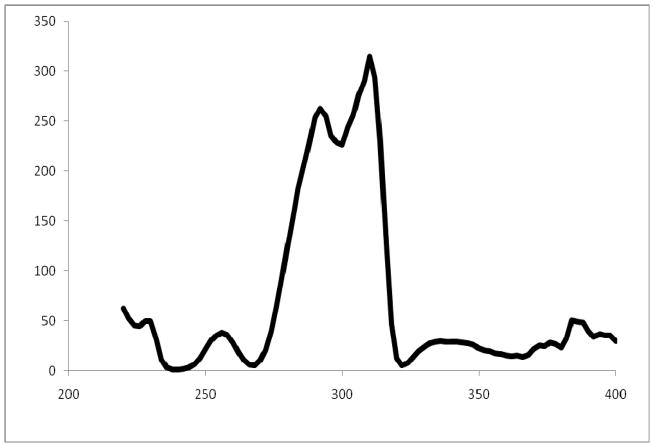
The ANOVA results reported above for the UV spectra were obtained using the entire spectrum, i.e. treating the entire spectrum as a single variable. However, an F statistic can be computed for each variable, providing an estimate of the significance of the data variance at each wavelength, in this case. Figure 8 is a plot of the F statistic computed for between species means for the UV-FI spectra. The region between 280 and 320 nm offers the maximum information for differentiating species and the region between 220 and 240 nm (omitted by the 96-well plate reader) makes little contribution. An identical plot (not shown) was obtained for the UV-96WPR spectra for wavelengths from 240–400 nm.
Figure 8.
F values as a function of wavelength for UV-FI spectra.
Figure 9 is the PCA object score plot of the data from the 302–316 nm region using UV-FI. The F value for P. notoginseng versus P. quinquefolius was greatest in the 302–316 nm range (not shown). Thus, this region was used to obtain maximum discrimination for all 3 species. Compared to Figures 4 and 5, where the full spectra were used, the smaller, but more optimum, wavelength region provides tighter clusters for P. quinquefolius and P. notoginseng and better separation of the clusters for the three species. This observation is supported by the ANOVA for the 280–320 nm region (columns 6 and 7). The between-species means variance increases to 82% (and between-sample means variance decreases to 17%) indicating greater variance between species and less spread within each species. The first two PCs in Figure 9 now account for more than 99% of the variance.
Figure 9.
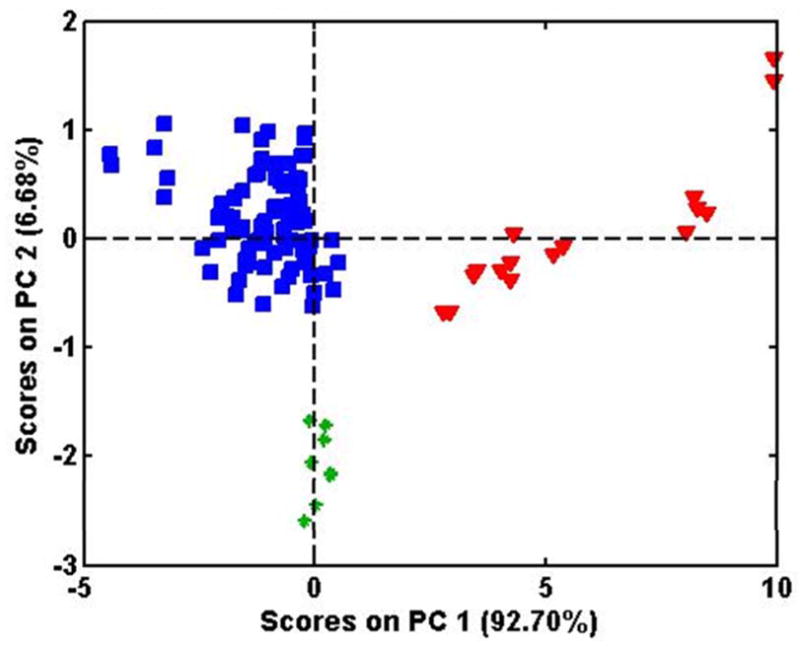
PCA score plots from UV-FI spectra for all three Panax species using wavelengths 302–316 nm.
The P. ginseng samples in Figure 9 still exhibit the sub-groupings previously observed in Figures 1, 2, and 7. ANOVA indicated that the average residuals around the species means are 2 to 40 times greater for P. ginseng than for P. quinquefolius (not shown). Thus, the sub-groupings of the P. ginseng leads to increased within species residuals.
MS Fingerprints
The ANOVA results for MS-EX spectra were almost identical to those for both UV systems using the full spectra. Variances associated with species and samples were 60% and 30%, respectively. In all three cases, the sum of the between run variance and analytical uncertainty fell between 0.6% and 2.5%. For the MS-LCQ spectra, the sum of the last two values was much larger, totaling 22%, and reduced the between species variance to 41%. For both the MS-EX and the MS-LCQ spectra, the average residuals around the species means were 2 to 6 times greater for P. ginseng than for P. notogenseng or P. quinquefolius.
Classification Methods
Three different classification methods (SIMCA, PLS-DA, and FuRES) were applied to the Panax data. The models employed either 3 classes (red P. ginseng, P. notoginseng, and P. quinquefolius) or 4 classes, depending on whether the Canadian grown P. quinquefolius was considered as a separate class. In each case, white P. ginseng was omitted since there were insufficient samples to permit validation. Data were preprocessed in the same manner as described for PCA and described in the Methods and Development section. For the UV spectra, a wavelength range of 302–316 nm was selected. A wavenumber range of 4300–4700 cm−1 was used for the NIR data set. This smaller range (compared to the 4000–10000 range of the full spectrum) was used because it was faster to process, provided the same results (Table 2), and eliminated any concern that the water bands contributed to the classification.
SIMCA
This supervised modeling method fits a separate PCA model to each of the specified classes of samples and then measures the distances between the objects and their projections onto the subspace defined by the PCA model. Table 3 presents the accuracy of the results obtained for modeling of 3 and 4 classes. The percent accuracy summarizes the sensitivity (percent of positives correctly identified, e.g., the percent of P. notoginseng correctly classified as P. notoginseng) and specificity (percent of negatives correctly identified, e.g.. percent of non-P. notoginseng samples correctly classified as non-P. notoginseng). The same samples were analyzed by each method, but the number of replicates varied from 2 (UV-FI) to 3 (NIR, MS-EX, and MS-LCQ) to 6 (UV-96WPR).
Table 3.
Accuracy of classification methods
| Method | N | SIMCA | PLS-DA | FuRES |
|---|---|---|---|---|
| 3 Classes | ||||
| NIR | 168 | 19.0% ± 1.2% | 99.0% ± 0.5% | 100.0% ± 0.0% |
| MS-EX | 168 | 77.4% ± 1.8% | 100.0% ± 0.0% | 100.0% ± 0.0% |
| MS-LCQ | 168 | 88.1% ± 1.2% | 100.0% ± 0.0% | 99.9% ± 0.3% |
| UV-Fi | 112 | 84.8% ± 1.8% | 94.6% ± 0.8% | 99.1% ± 0.2% |
| UV-96WPR | 336 | 87.5% ± 0.6% | 97.9% ± 0.0% | 98.0% ± 0.1% |
| 4 Classes | ||||
| NIR | 168 | 25.6% ± 1.8% | 99.2% ± 0.5% | 99.9% ± 0.1% |
| MS-EX | 168 | 45.8% ± 1.2% | 94.6% ± 1.2% | 95.8% ± 0.6% |
| MS-LCQ | 168 | 75.0% ± 1.8% | 100.0% ± 0.0% | 99.7% ± 0.4% |
| UV-Fi | 112 | 61.6% ± 2.7% | 91.1% ± 0.9% | 89.3% ± 2.7% |
| UV-96WPR | 336 | 45.8% ± 2.1% | 97.9% ± 0.0% | 98.1% ± 0.1% |
SIMCA provided accuracies of 77% to 88% for UV and MS when the samples were partitioned into 3 classes. The accuracy for NIR was only 19%. The PCA models in Figures 1, 4, and 7 are based on the attributes of all the samples. With SIMCA, each PCA model is based on only the attributes of a specific class. Thus, the vectors (based on a single PC) for each model of the 3 classes were not well separated. Partitioning into 4 classes provided even worse performance for UV and MS and the improvement for NIR was negligible.
The two sets of UV data presented a unique opportunity to evaluate the robustness of the analytical method. Using the UV-FI samples as a training set, classification of the UV-96WPR samples had an accuracy of 97.6%. Using the UV-96WPR samples as a training set, classification of the UV-FI samples had an accuracy of 95.0%. It must be remembered that the samples analyzed by the two methods were from separate extractions and dilutions and were run months apart on different instruments. These results attest to the stability of the instrumentation and the repeatability of the UV method.
PLS-DA and FuRES
Two additional supervised classification methods were applied to the data from the five analytical methods (20,21). Both methods used the principal component transform as a lossless form of data compression. FuRES (21) has an inherent advantage over SIMCA and PLS-DA in that there is no parameter such as the number of latent variables to optimize. As explained in more detail in the Materials and Methods section, the results reported in Table 3 were obtained from 10 bootstraps of 3 Latin partitions (22,23). The replicates for each sample were never split between prediction and training sets. The prediction results were pooled and the classifications were averaged across the 10 bootstraps. This approach gives a much more general estimate of the prediction accuracy than building a single model from the entire data.
The results in Table 3 for the prediction accuracy for PLS-DA and FuRES were excellent. With 3 classes of samples, the worst accuracy was 95% (PLS-DA for UV-FI). The other methods were 98% or better. Selection of 4 classes made little difference in the accuracy of NIR, MS-LCQ, or UV-96WPR. For MS-EX, the average accuracy decreased from 100% to 95% while UV-FI decreased to 91% and 89% for PLS-DA and FuRES, respectively. These results suggest that the spectral differences for Canadian and American grown P. quinquefolius obtained from UV-FI were not as substantive as NIR and MS. The data in Table 2 suggest that the greater accuracy for UV-96WPR may come from the reduced analytical uncertainty. However, the accuracy of the results obtained from the MS-LCQ were equal to or better than those for the MS-EX despite the much greater analytical uncertainty of the former.
Discussion
Methods Comparison
Each of the five methods employed in this study have advantages and disadvantages with regards to characterizing the ginseng samples. NIR reflectance spectrometry provides the spectrum of the chemical components of finely powdered samples without any interference from solvent bands thus providing a more chemically comprehensive perspective. However, this sampling method can also be a disadvantage because the spectral contribution of the high concentration components can overwhelm the characteristic bands from components of lower concentration.
MS and UV can only provide characterization of those constituents present in the extract. An advantage is that the extraction solvent can be selected to target specific families (or polarities) of compounds. The disadvantage is that an extract will never represent the full chemical constituency of the sample. MS provides extensive specific ion information that, even without separation by column chromatography, can be used to identify specific compounds. UV provides the least specific information, but has a higher precision that allows subtle differences in the broad spectral profiles to be statistically significant.
It might be expected that NIR is more sensitive to the macro components of the plant chemistry associated with growth and energy metabolism and less sensitive to chemical differences arising from environmental factors. The latter components would be most useful in determining the influence of growing conditions (e.g., year, harvest, and location). Thus, MS and UV analysis of a methanol-water extract (used in this study) would be more sensitive to environmental factors. The clearly separated clusters in Figures 1, 4, and 7 demonstrate that all three methods can discriminate between the three species. MS appears to have an advantage (greater separation of species), most likely as a result of the higher information content. A comparison of Figures 4 and 9 shows that, with UV, separation of the species can be improved using ANOVA to select wavelength regions that optimize the signal-to-noise ratio. Similar improvements would be expected for NIR and MS, although those operations were not carried out in this study.
All five methods would appear to have the ability to discriminate between Asian ginseng with respect to treatment (red versus white) and quality (different ratings of Kirin and Shih Chu). In the latter case, the acquisition of many more samples and the use of multivariate calibration methods may allow modeling of the quality of the Asian ginseng.
The ability of the five methods to discriminate between P. quinquefolius samples from the US, Canada, and China varies. Both UV and MS included most of the Canadian and Chinese samples with the US samples in the SIMCA, PLS-DA, and FuRES models. The most striking result was the ability of NIR to clearly distinguish between the P. quinquefolius samples grown in the US and Canada. None of the other methods provided this level of discrimination with respect to growing site. The data presented here suggest that additional samples, with better representation of each of the classes, are necessary for a valid evaluation of the ability of the different methods to discriminate with respect to growing location. Data fusion among the different methods could further enhance the prediction accuracies of the ginseng classes.
Classification
The results reported in this study demonstrate that spectral fingerprinting, combined with pattern recognition methods, is sensitive to the differences among samples that arise from species, growing location, quality (their numerical rating by the supplier), and processing. Initially, we focused on comparing samples of the three species. However, the sub- groupings of P. quinquefolius samples with respect to growing site and P. ginseng samples with respect to quality brought added complexity to the study. To accurately discriminate between samples of different sites and qualities, the samples can no longer be simply documented with respect to species. They must now be documented with respect to the additional factors that influence the sample composition.
The real challenge now appears to be not the methodology, but the collection of sufficient numbers of authentic samples with known provenance. Defining “authentic” will be project-dependent, that is, dependent on the goals of the investigators. Thus, species, plant age, growing site, growing year, plant part, treatment, or a number of other variables may influence the defining of an “authentic” material. The method and the authentic samples must be fit for the purpose of the analysis.
Documented, authentic samples will be expensive and it will be desirable to use them as infrequently as possible. Consequently, the use of archived spectra as a basis for comparison is very attractive. Archived spectra, however, would not be useful unless the analytical methodology is stable and the spectra are reproducible. The levels of variance between runs and the analytical uncertainty given in Table 2 suggest that all three methods used in this study are suitable. However, previous research suggests that MS data acquired by electrospray ionization varies considerably between instruments (different manufacturers and designs), between instruments of the same design, and between experiments on the same instrument (15,25). NMR, NIR, and UV are all less sensitive than MS but provide greater reproducibility making them more attractive instruments for the archiving of spectra. UV provides the best documented precision of any of the instrumental methods considered here. It is generally accepted that relative precisions of 0.3% can be achieved with good laboratory technique. Recent reports have shown that NMR can provide reproducible spectra at the 1% level between a number of different platforms (26,27). NIR spectra are vey reproducible and catalogs of NIR spectra are routinely used to identify unknown compounds. Certainly, more research is needed to determine the best instrumentation for archiving data.
CONCLUSIONS
MS, NIR, and UV, used in conjunction with PCA, are capable of distinguishing between P. quinquefolius L., P. ginseng, and P. notoginseng. Initial data suggests that any of these methods might be capable of distinguishing between red and white P. ginseng and the different qualities (age or size). Initial data also suggests that any of these methods might be able to distinguish between P. quinquefolius grown in the U.S., Canada, and China. PLS-DA and FuRES were excellent classification methods for identifying the 3 Panax species. More samples with known provenances are necessary prior to developing validated methods to identify growing location, quality (age), or post-harvest treatment.
Acknowledgments
This research is supported by the Agricultural Research Service of the U.S. Department of Agriculture and an Interagency Agreement with the Office of Dietary Supplements of the National Institutes of Health.
References
- 1.Ren G, Chen F. Simultaneous Quantification of Ginsenosides in American Ginseng (Panax quinquefolius) Root Powder by Visible/Near-Infrared Reflectance Spectroscopy. J Agric Food Chem. 1999;47:2771–2775. doi: 10.1021/jf9812477. [DOI] [PubMed] [Google Scholar]
- 2.Li W, Gu C, Zhang H, Awang DVC, Fitzlof JF, Fong HHS, van Breeman RB. Use of High-Performance Liquid Chromatography-Tandem Mass Spectrometry to Distinguish Panax ginseng C.A Meyer (Asian Ginseng) and Panax quinquefolius L (North American Ginseng) Anal Chem. 2000;75:5417–5422. doi: 10.1021/ac000650l. [DOI] [PubMed] [Google Scholar]
- 3.Assinewe VA, Baum BR, Gagnon D, Arnason J. Thor. Phytochemistry of Wild Populations of Panax quinquefolius L. (North American Ginseng) J Agric Food Chem. 2003;51:4549–4553. doi: 10.1021/jf030042h. [DOI] [PubMed] [Google Scholar]
- 4.Dong TTX, Cui XM, Song ZH, Zhao KJ, Ji Zn, Lo CK, Tsim KWK. Chemical Assessment of Roots of Panax notoginseng in China: Regional and Seasonal Variations in Its Active Constitutents. J Agric Food Chem. 2003;61:4617–4623. doi: 10.1021/jf034229k. [DOI] [PubMed] [Google Scholar]
- 5.Corbit RM, Ferreira JFS, Ebbs SD, Murphy LL. Simplified Extraction of Ginsenosides from American Ginseng (Panax quinquefolius L.) for High-Performance Liquid Chromatography-Ultraviolet Analysis. J Agric Food Chem. 2005;53:9867–9873. doi: 10.1021/jf051504p. [DOI] [PubMed] [Google Scholar]
- 6.Lim W, Mudge KW, Vermeylen F. Effects of Population, Age, and Cultivation Methods on Ginsenoside Content of Wild American Ginseng (Panax quinquefolius) J Agric Food Chem. 2005;53:8498–8505. doi: 10.1021/jf051070y. [DOI] [PubMed] [Google Scholar]
- 7.Hong DYQ, Lau AJ, Yeo CL, Liu XK, Yang CR, Koh HL, Hong Y. Genetic Diversity and Variation of Saponin Content in Panax notoginseng Roots from a Single Farm. J Agric Food Chem. 2005;53:8460–8467. doi: 10.1021/jf051248g. [DOI] [PubMed] [Google Scholar]
- 8.Wang CZ, Ni M, Sun S, Li XL, He H, Mehendale SR, Yuan CS. Detection of Adulteration of Notoginseng Root Extract with Other Panax Species by Quantitative HPLC Coupled with PCA. J Agric Food Chem. 2009;57:2363–2367. doi: 10.1021/jf803320d. [DOI] [PMC free article] [PubMed] [Google Scholar]
- 9.Xie P, Chen S, Liang YZ, Wang X, Tian R, Upton R. Chromatographic Fingerprints Analysis – a Rational approach for quality assessment of traditional Chinese herbal medicine. J Chromatogr A. 2006;1112:171–180. doi: 10.1016/j.chroma.2005.12.091. [DOI] [PubMed] [Google Scholar]
- 10.Wan JB, Li SP, Chen JM, Wang YT. Chemical characteristics of three medicinal plants of the Panax genus determined by HPLC-ELSD. J Sep Sci. 2007;30:825–832. doi: 10.1002/jssc.200600359. [DOI] [PubMed] [Google Scholar]
- 11.Raman
- 12.CBOL Plant Working Group. A DNA barcode for land plants. Proc Natl Acad Sci USA. 2009;106:12794–12797. doi: 10.1073/pnas.0905845106. [DOI] [PMC free article] [PubMed] [Google Scholar]
- 13.Smith RG, Caswell D, Carriere A, Zielke B. Variation in the ginsenoside content of American ginseng, Panax quinquefolius L. roots. Can J Bot. 1996;74:1616–1620. [Google Scholar]
- 14.Luthria DL, Mukhopadhyay S, Finley J, Banuelos GS, Robbins R, Harnly JM. UV spectral fingerprinting and analysis of variance-principal components analysis: a tool for characterizing sources of variance in plant materials. J Ag Food Chem. 2008;56:5457–5462. doi: 10.1021/jf0734572. [DOI] [PMC free article] [PubMed] [Google Scholar]
- 15.Luthria DL, Lin LZ, Robbins RJ, Finley JW, Banuelos GS, Harnly JM. Discriminating between cultivars and treatments of broccoli using mass spectral fingerprinting and analysis of variance principal component analysis. J Ag Food Chem. 2008;56:9819–9827. doi: 10.1021/jf801606x. [DOI] [PubMed] [Google Scholar]
- 16.Harnly JM, Pastor-Corrales MS, Luthria DL. Variance in the chemical composition of dry beans determined from UV spectral fingerprints. J Ag Food Chem. 2009;57:8705–8710. doi: 10.1021/jf900852y. [DOI] [PubMed] [Google Scholar]
- 17.Chen P, Harnly JM, Lester GE. Flow Injection Mass Spectral Fingerprints Demonstrate Chemical Differences in Rio Red Grapefruit with Respect to Year, Harvest Time, and Conventional versus Organic Farming. J Ag Food Chem. 2010;58:4545–4553. doi: 10.1021/jf904324c. [DOI] [PMC free article] [PubMed] [Google Scholar]
- 18.Chen P, Harnly JM, Harrington PdeB. A Rapid Method for Differentiation between Panax quinquefolius, P. ginseng, and P. notoginseng using Flow Injection Mass Spectroscopic Fingerprinting. J AOAC Intl. (submitted) [Google Scholar]
- 19.Jackson JE, Mudholkar GS. Control Procedures for Residuals Associated with Principal Component Analysis. Technometrics. 1979;21:341–349. [Google Scholar]
- 20.Harrington PD, Kister J, Artaud J, Dupuy N. Automated Principal Component- Based Orthogonal Signal Correction Applied to Fused Near Infrared-Mid-infrared Spectra of French Olive Oils. Analytical Chemistry. 2009;81:7160–7169. doi: 10.1021/ac900538n. [DOI] [PubMed] [Google Scholar]
- 21.Harrington PdeB. Fuzzy Multivariate Rule-Building Expert Systems - Minimal Neural Networks. J Chemometrics. 1991;5:467–486. [Google Scholar]
- 22.Wan CH, Harrington PdeB. Analytica Chimica Acta. 2000;408:1–12. [Google Scholar]
- 23.Harrington PdeB. Trac-Trends in Analytical Chemistry. 2006;25:1112–1124. [Google Scholar]
- 24.Candalfi A, Massart DL, Heuerding S. Investigation of sources of variance which contribute to NIR-spectroscopic measurement of pharmaceutical formulation. Anal Chim Acta. 1997;345:185–196. [Google Scholar]
- 25.Bristow AWT, Nichols WF, Webb KS, Conway B. Evaluation of protocols for reproducible electrospray in-source collisionally induced dissociation on various liquid chromatography/mass spectrometry instruments and the development of spectral libraries. Rapid Comm Mass Spectrom. 2002;16:2374–2386. doi: 10.1002/rcm.843. [DOI] [PubMed] [Google Scholar]
- 26.Verpoorte R, Choi YH, Kim HK. NMR-based metabolomics at work in phytochemistry. Phytochem Rev. 2006;6:3–14. [Google Scholar]
- 27.Colson K. NMR based screening tool for quality control of botanical dietary supplements. Paper S-14, 9th Annual Oxford International Conference on the Science of Botanicals; Oxford, MS. April 12–15, 2010. [Google Scholar]


