Abstract
Background
The aim of this study was to evaluate the effect of sleeve gastrectomy (SG) and duodenal-jejunal bypass (DJB) on glucose homeostasis and to evaluate the utility of positron emission tomography (PET) scanning for assessing β-cell mass.
Methods
Goto-Kakizaki rats were divided into 4 groups: control, sham, SG, or DJB. Oral glucose tolerance, insulin, and glucagon-like peptide-1 (GLP-1) were measured before and after surgery. Before and 90 days after treatment, [11C] DTBZ micro PET scanning was performed.
Results
The control and sham animals gained more weight compared with SG and DJB animals (P ≤ .05). Compared with control animals, the glucose area under the curve was lower in DJB animals 30 and 45 days after operations (P ≤ .05). At killing, GLP-1 levels were greater in the DJB group compared with sham and SG (P ≤ .05), whereas insulin levels were greater in both DJB and SG compared with sham (P ≤ .05). With PET scanning, the 90-day posttreatment mean vesicular monoamine transporter type 2 binding index was greatest in the DJB animals (2.45) compared with SG (1.17), both of which were greater than baseline control animals (0.81).
Conclusion
In type 2 diabetic rodents, DJB leads to improved glucose homeostasis and an increase in VMAT2 density as measured by PET scanning.
Obesity is a worldwide epidemic of unparalleled proportions, contributing to a public health care crisis in developed and developing countries alike. It is now estimated that 1.1 billion of the world’s population is overweight with 312 million people being considered obese.1 In the United States, 62% of adults age ≥20 years are now classified as overweight (body mass index >25 m/kg2) and 30% are considered obese (body mass index >30 m/kg2).2 Obesity is a major risk factor for metabolic derangements such as diabetes, hypertension, hyperlipidemia, certain types of cancer. and premature death.3,4 It is estimated that by 2025, 420 million people worldwide will have impaired glucose intolerance, a trend that parallels the increased prevalence of obesity.1
Bariatric surgery is the most effective long-term treatment for obesity and leads not only to durable weight loss, but a significant improvement in obesity-related comorbidities, such as type 2 diabetes mellitus (T2DM).5 Bariatric surgery procedures are divided into 3 categories based on their mechanism of action: restrictive procedures (gastric banding and sleeve gastrectomy [SG]), malabsorptive procedures (biliopancreatic diversion), and hybrid procedures that utilize both restriction and malabsorption (gastric bypass, duodenal switch). Restrictive procedures induce weight loss by limiting caloric intake, whereas malabsorptive procedures decrease the intestinal absorption of calories and nutrients. Approximately 40% of patients undergoing laparoscopic gastric banding experience resolution of T2DM, whereas in patients undergoing gastric bypass, 80–90% of patients experience remission of T2DM, often before substantial weight loss has occurred.3,6-10 This observation raises the strong possibility that bypassing the foregut is a key event in ameliorating T2DM, although the exact mechanism of action is poorly understood. Given these varying results, it seems that different mechanisms influence insulin resistance, such as decreased caloric intake, the rate and total amount of weight loss, and amount of intestine bypassed.
T2DM represents a progressive increase in insulin resistance and β-cell dysfunction culminating in β-cell death. Current measurements of β-cell mass, however, are quite limited. Recently, we identified a biomarker of β-cell mass that is quantifiable by positron emission tomography (PET). Vesicular monoamine transporter type 2 (VMAT2) is expressed highly in human and rodent β-cells relative to other endocrine and exocrine pancreas cells as well as adjacent organs. The radioligand [11C] dihydrotetrabenazine (DTBZ) has a high affinity for VMAT2 and has been used to measure β-cell mass in animal models of type 1 diabetes.11,12 The primary aim of this study was to assess the effect of 2 different weight loss procedures—SG and duodenal–jejunal bypass—on glucose homeostasis in nonobese rodents with T2DM. The secondary aim was to evaluate the relationship between VMAT2 measurements performed by [11C]-DTBZ PET and other metrics of the diabetic phenotype in the Goto-Kakizaki (GK) model of T2DM.
METHODS
This study was approved by the Institutional Animal Care and Use Committee of the College of Physicians and Surgeons of Columbia University.
Animals
Male GK rats (Taconic Laboratory, Hudson, NY), 10–12 weeks old and weighing 290–320 g, were housed 2 per cage in a 12-hour dark/light cycle room at 26°C. The animals were allowed to acclimate for 7 days before starting the protocol and were offered ad libitum house water and diabetic rat chow Purina 5008 (Purina Mills, MO). The animals were weighed weekly for the duration of the project.
Surgery
The rats were divided randomly into 4 groups: control, sham, SG, or duodenal-jejunal bypass (DJB). Control animals did not undergo surgery and were subjected to oral glucose tolerance testing (OGTT) and gut peptide testing only. Sham animals underwent laparotomy, which included 20 minutes of small bowel manipulation. SG rodents underwent vertical gastrectomy using 2 loads of white 60–2.5 mm cartridges (Covidien Healthcare, Norwalk, CT) taking great care not to narrow the gastroesophageal lumen. DJB was performed by dividing the duodenum immediately distal to the pylorus and creating a Roux-en-Y configuration with a 20-cm alimentary limb of jejunum and 5-cm biliopancreatic limb.13
OGTT
OGTT was performed in non-sedated rodents before surgery and at 15, 30, and 45 days postoperatively (2 animals from each group). Oral gavage with 1.5 g/kg of glucose was performed followed by glucose testing at baseline (before the gavage) and 20, 60, and 90 minutes after the gavage as described by Conybeare and Leslie.14 A drop of blood was then obtained from the tip of the tail and glucose was measured using a glucometer on site (True Track Smart System; Home Diagnostic Inc., Fort Lauderdale, FL).
Peptide hormone measurement
Blood was obtained for peptide analysis before operation and 13 weeks after operations (at killing) in nonfasted animals. Blood was drawn from either the tail vein or orbital venous plexus; however, at killing blood was collected using a transthoracic cardiac puncture. The blood was collected in an EDTA 4-mL tube and centrifuged at 4°C for 20 minutes at 3,000 rpm/min. Once the plasma was separated, it was collected and stored at −80°C until processed. Rat insulin and total GLP-1 concentrations were measured by radioimmunoassay (Linco Research, St. Charles, MO). The mean pre-operative value for all the animals was compared with the 13 week mean value for each of the 4 groups.
Radioligand
Micro-PET scanning was performed before and 90 days after operation in a subset of animals. The stereochemically resolved (+)-9-O-desmethyl-alpha-DTBZ precursor of [11C] DTBZ was obtained from ABX Advanced Biochemical Compounds (Radeberg, Germany). (+)-α-[11C] DTBZ was synthesized by [11C] methylation of the appropriate precursor and the product purified by HPLC. The radioligand, [11C] DTBZ, has a high affinity for VMAT2 that are expressed on β-cells in the pancreas. β-Cell mass can be estimated by measuring VMAT2.
PET scan study protocol
Rats were sedated for the imaging study with isoflurane 2% and oxygen 2.5 L/min. After a transmission scan of the area of interest had been acquired, the radioligand [11C] DTBZ was administered (0.5–1.0 μCi/g) in saline as bolus injection via the penile vein. PET scans of the animals were acquired dynamically from 0 to 90 minutes postinjection on a Concorde microPET-R4 (CTI Molecular Imaging, Knoxville, TN) as previously described.11,12 Rats were scanned maintaining body temperature at 37.5–38.5°C with a heating pad. The scanner provided a 100- × 80-mm field of view with a reconstructed resolution of 2.25 mm in the central 40 mm of the field of view. PET data were processed using an attenuation correction matrix obtained by the transmission scans; images were reconstructed using Fourier rebinning, followed by 2-dimensional, filtered back-projection using microPET manager software (CTI Molecular Imaging).
PET data analysis and interpretation
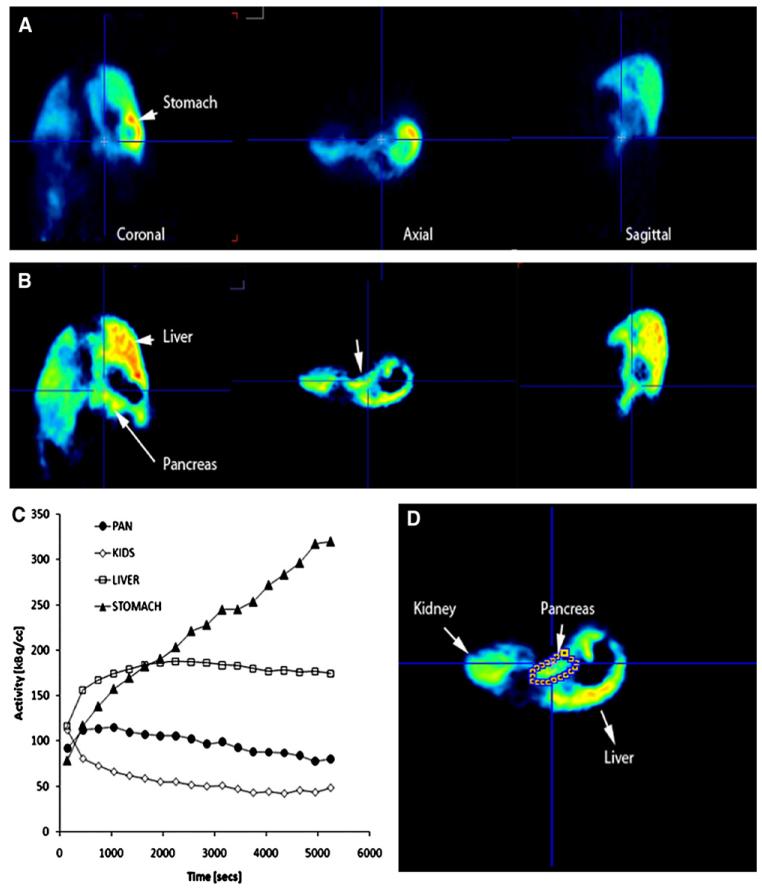
Region of interest analysis and image reconstruction were performed with AsiPro software (Concorde Microsystems, Knoxville, TN). Visual analysis was performed by an individual experienced in PET interpretation using coronal, transverse, and sagittal reconstructions and who was blinded to the treatment group. Reconstructed PET images with a slice thickness of 5 mm were used to identify and measure radioligand activity within each organ of interest (Fig 1, A). As an aid to organ segmentation, a voxel wise analysis of the radioligand kinetics was performed and parametric images based on the magnitude of the slope and y-intercepts of each pixels time–active curve profile were prepared (PMOD technologies, Zurich, Switzerland; Fig 1, B). Because radioligand uptake and washout are distinct for many abdominal organs, particularly, the pancreas, liver, stomach and kidneys (Fig 1, C), the definition of pancreatic regions of interests was facilitated (Fig 1, D). Regions of interest were placed across parametric image planes manually, using known landmarks (eg, liver and kidney), and then used for the determination of average time-activity curves (Fig 1, C) for each organ of interest. The renal cortex does not accumulate the radioligand to any great extent (Fig 1, C) and therefore provides a reference region. Decay-corrected time–activity curves for [11C] DTBZ uptake in the regions of interest were obtained from the tissues of interest (ie, pancreas, right hepatic lobe and kidney, renal cortices, and the abdominal wall) and were based on sampling of approximately equal volumes of tissue throughout the study. The comparison of pancreatic [11C] DTBZ uptake among all animals studied was performed by calculating a binding index using the following equation: BI = (AUC pan – AUC kidney)/AUC kidney (Fig 1).
Fig 1.
Representative images from reconstructed PET scans with [11C] DTBZ in the GK rat. (A) Representative coronal, axial, and sagittal abdominal planes of a GK rat. The pancreas, stomach and liver are identified with arrows. Reconstructed images represent the PET data at the mid point of the entire scanning period. (B) Voxel-wise analysis of the radioligand kinetic history and parametric maps of the y-intercept values of each voxels time activity curve. Notice the disappearance of the stomach because of the lower y-intercept values of the average time activity curve. (C) Average time–activity curves (TAC) within the region of interest for [11C] DTBZ uptake during the study. The amount of [11C] DTBZ in kBq/cc versus the duration of the PET scan in seconds are plotted on the y and x axes, respectively. Solid triangles represent activity in the stomach, the open squares represents activity in the liver, solid circles represents the activity in the pancreas and open diamonds the activity in the cortex of the kidneys. (D) Region of interest definition of pancreas on an axial slice based on parametric maps (B) and anatomic location.
Pancreatic tissue analysis
At necropsy, rat pancreata were dissected, fixed in 10% formalin, and embedded in paraffin blocks for preservation. Five-micrometer sections were cut from the blocks, deparaffinized, and stained with hematoxylin and eosin. Additionally, pancreas sections were stained with guinea pig anti-bovine insulin antibodies (Sigma-Aldrich, St. Louis, MO). Images were generated from the pancreatic head and tail of control (n = 2), SG (n = 3), and DJB (n = 2) animals and recorded with an optical Leica Microsystems DM E Microscope fitted with a Pentax digital camera. Pancreatic tissue area, islet area, insulin-positive cell area, and islet number were determined using ImageJ software (version 1.34; National Institutes of Health), which was calibrated with a stage micrometer from TedPella Inc. (2 μm/division × 50 divisions). Total insulin staining area as a percent of total pancreatic area was calculated from the ratio of insulin-positive areas to the total areas of the tissue sections analyzed. The mean islet diameters were calculated by averaging all islet diameters observed in the tissue analyzed.
Statistical analysis
Statistical difference between groups was measured by the Student t test, and the percent change in weight was determined with the 1-way analysis of variance test. The mean values ± standard error of the mean are reported. P ≤ .05 was considered significant.
RESULTS
As previously reported, the DJB procedure has an associated mortality of approximately 60%.15 Owing to the high mortality in the DJB cohort, the final recruitment of GK rodents for this study was as follows: control (n = 6), sham (n = 6), SG (n = 10), and DJB (n = 5).
Animal weight
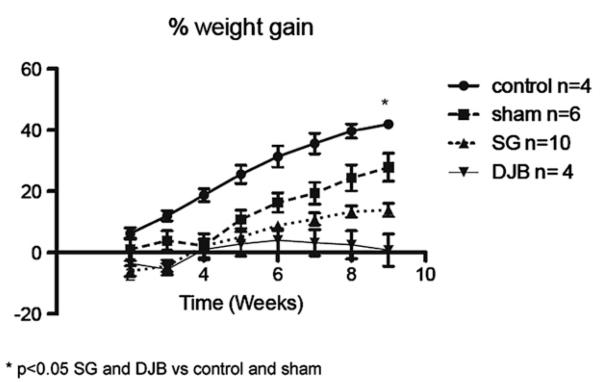
There was no difference in initial weight between groups (Fig 2). Nine weeks after operation, SG and DJB animals showed less weight gain compared with nonoperated control and sham animals (P < .05), but there was no difference in weight between SG and DJB animals.
Fig 2.
Percent weight gain. *P < .05 SG and DJB versus control and sham.
OGTT
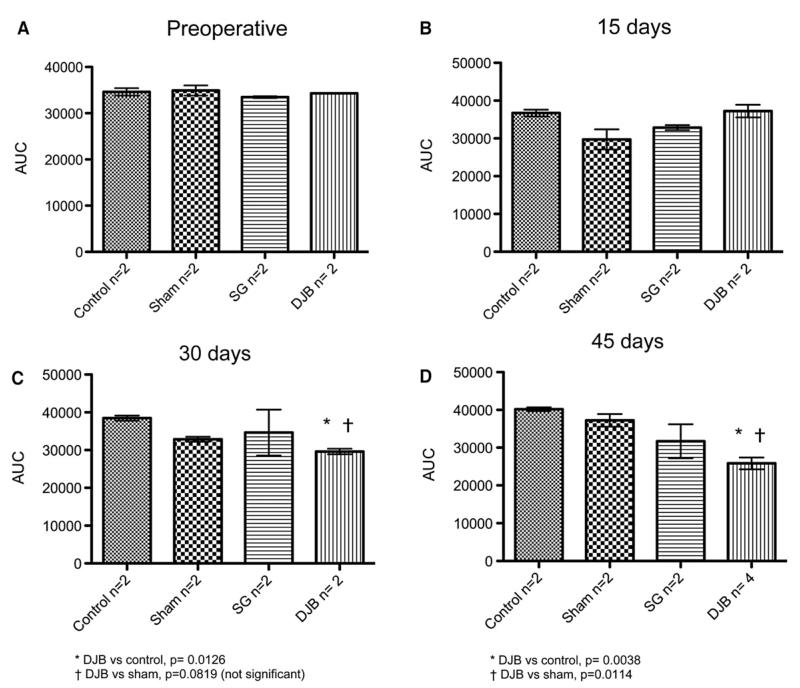
Figure 3 shows the area under the curve (AUC) for each group at baseline and at 15, 30, and 45 days after operation. At 30 days, the AUC was lesser in DJB animals compared with control animals (P ≤ .05) and had a trend toward lesser AUC compared with the sham group (P = .0819). At 45 days, DJB animals had a lesser AUC compared with both control and sham animals (P ≤ .05).
Fig 3.
Evolution of OGTT. (A) Pre-operative. (B) 15 days. (C) 30 days. *DJB versus control, P = .0126. †DJB versus sham, P = .0819 (not significant). (D) 45 days. *DJB versus control, P = .0038. †DJB versus sham, P = 0.0114.
Peptide hormones
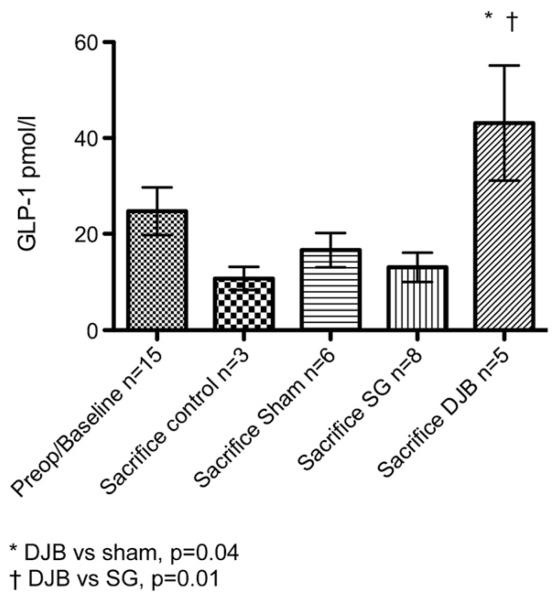
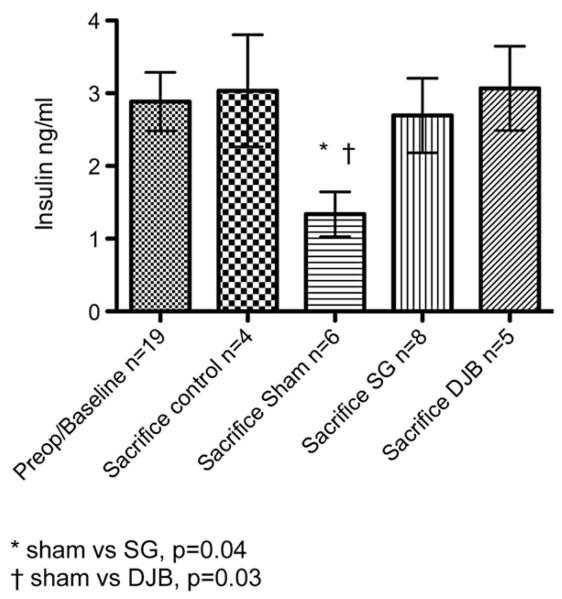
The mean pre-operative value of GLP-1 was 24.7 ± 5.0 pmol/L. At killing, the GLP-1 levels were 10.7 ± 2.4, 16.6 ± 3.6, 13.0 ± 3.1 and 43.1 ± 12.0 pmol/L for the control, sham, SG and DJB groups, respectively. The DJB group had a significant increase in GLP-1 at sacrifice compared with sham and SG animals (P ≤ .05; Fig 4). The mean pre-operative value for insulin was not different from the values obtained at sacrifice (2.9 ± 0.4 ng/mL compared with 1.7 ± 0.3, 1.3 ± 0.3, 2.7 ± 0.5 and 3.1 ± 0.6 for the control, sham, SG and DJB groups, respectively). At sacrifice, SG and DJB insulin levels were greater than sham insulin levels (P ≤ .05; Fig 5).
Fig 4.
Hormone levels before operation and at sacrifice 13 weeks after operation. *DJB versus sham, P = .04. †DJB versus SG, P = .01.
Fig 5.
Insulin levels before operation and at sacrifice 13 weeks after operation. *Sham versus SG, P = .04; †Sham versus DJB, P = .03.
PET scanning
VMAT2 binding index results are presented in the Table. Because animals undergoing DJB had high peri-operative mortality, no preoperative PET scanning data are available for the DJB animals nor 90 day data for the control animals (some of the control animals were redirected to the DJB group). For the animals that died after DJB, the pre-operative VMAT2 binding index data are included with the control group, which increased the control cohort to 6 animals. The mean baseline VMAT2 binding index was 0.81 for control animals. At 90 days, the mean VMAT2 binding index was greatest in the DJB group (2.45) compared with SG animals (1.17), both of which are greater than the baseline control values.
Table.
Measurement of b-cell mass: average concentration (range) of VMAT2 in pancreas region of interest expressed as specific binding index
| Baseline | 90 days postop | |
|---|---|---|
| Control | 0.81 (0.33–1.34) (n = 6) |
NA |
| SG | NA | 1.17 (0.93–1.40) (n = 2) |
| DJB | NA | 2.45 (2.30–2.67) (n = 3) |
NA, Not available.
Pancreatic tissue analysis
Insulin staining was performed on the pancreatic head and tail of control (n = 2), SG (n = 3), and DJB (n = 2) GK rats. Insulin area were less for DJB compared with control rats (0.31% vs 0.81%; P = .019). Insulin to pancreatic area ratio as well as mean islet cell diameter were not significantly different between groups. Insulin to islet ratio staining was no different between groups, further demonstrating similar islet composition between groupings.
DISCUSSION
In this study, DJB led to improved glucose tolerance as demonstrated by a decrease in the AUC compared with control and sham animals. These findings support the results of other investigators who have demonstrated that bypassing the foregut greatly improves glucose homeostasis in rodent models of T2DM.13,16,17 The significant increase in GLP-1 levels in the DJB group supports the theory that the hindgut is a major contributor to improved β-cell performance. In addition to PYY(3-36), GLP-1 is produced by the L cells in the ileum and colon. GLP-1 increases rapidly after eating and stimulates insulin secretion by engaging the G-protein–coupled receptors on β-cells and on peripheral tissues.18 Bypassing the foregut leads to an earlier delivery of nutrients to the hindgut, which in turn leads to an increase in GLP-1 after meal ingestion. This phenomenon has also been demonstrated in humans, in whom postprandial secretion of GLP-1 is exaggerated after gastric bypass.19 Recently, SG has been shown to increase gastric emptying and transit time of nutrients in the small intestine.20 Interestingly in this study, GLP-1 levels in the SG group were not increased at killing as with the DJB rodents, indicating that perhaps other mechanisms are also at play.
The concept of functional imaging is not new to the endocrine surgeon. Functional imaging studies have been used in the diagnosis, localization, and management of pheochromocytoma for years and have been shown to be valuable in monitoring disease burden during treatment for metastatic pheochromocytoma.21 PET scanning is an imaging technique, which allows for noninvasive measurements of radioligand uptake and washout and can yield accurate measurements of receptor concentration. For β-cell estimates, we have identified VMAT2 as a biomarker and [11C] DTBZ as the transporter’s ligand. Pancreatic VMAT2 concentration, as determined by PET, has been shown to correlate with histological β-cell mass in 2 rodent models.11,12
In this study, DJB led to a marked increase in the VMAT2 binding index when compared with pre-operative controls and postoperative SG rodents. Because VMAT2 concentration correlates with β-cell mass, these findings demonstrate that β-cell mass is increased after bypass of the foregut, a finding that may be mediated in part by GLP-1. Other investigators have demonstrated that in GK rodents β-cell mass can be expanded pharmaceutically.22 Interestingly, immunohistochemical staining of pancreatic tissue showed that insulin area was less for DJB animals compared with controls, a finding that was quite puzzling given the increase in the VMAT2 binding index. One possible explanation is that the islet cells of GK rodents are abnormal to begin with. Starting at the age of 14 weeks, the islet cells of GK rodents begin to display histopathologic changes characterized by irregular shape and weakened immunoreaction against anti-insulin.23 Moreover, studies using electron microscopy have shown that the number of β-granules is decreased in GK rodents, a change that becomes more pronounced with advancing age.23 Thus, it is feasible that in GK rodents insulin staining is not a reliable indicator of β-cell performance.
There are numerous limitations to the current study. First, the animals were not pair fed, which may have influenced glucose homeostasis between groups. The greatest limitation was the high perioperative mortality experienced in the DJB arm of the study. The fact that many of the DJB animals died immediately after operation made it necessary to combine the pre-operative peptide hormone data into 1 mean data point, which possibly diluted our statistical analysis. Moreover, no pre-operative VMAT2 data are available for the DJB animals owing to the high mortality (the DJB animals that did undergo pre-operative PET scanning died; thus, PET scanning data are available on only the survivors). The high DJB mortality could introduce selection bias to the findings on PET scanning, as perhaps the DJB survivors had a β-cell profile that led to enhanced survival compared with those that died.
In conclusion, DJB and SG led to improved glucose homeostasis in the GK rodent model of T2DM. After DJB, [11C] DTBZ PET scanning demonstrated increased VMAT2 concentrations, which paralleled the improvement in glucose homeostasis but did not correlate with insulin staining. PET scanning may provide a useful, noninvasive measure of β-cell function.
Acknowledgments
Funded by a Covidien Healthcare research grant, Columbia University Department of Surgery Research grant.
The research was performed while Dr Inabnet was affiliated with Columbia University, New York, NY.
Footnotes
Presented at the 2009 meeting of the Society of University Surgeons.
REFERENCES
- 1.Hossain P, Kawar B, El Nahas M. Obesity and diabetes in the developing world–a growing challenge. N Engl J Med. 2007;356:213–5. doi: 10.1056/NEJMp068177. [DOI] [PubMed] [Google Scholar]
- 2.Flegal KM, Carroll MD, Kuczmarski RJ, Johnson CL. Overweight and obesity in the United States: prevalence and trends, 1960-1994. Int J Obes Relat Metab Disord. 1998;22:39–47. doi: 10.1038/sj.ijo.0800541. [DOI] [PubMed] [Google Scholar]
- 3.Kral JG. Morbidity of severe obesity. Surg Clin North Am. 2001;81:1039–61. doi: 10.1016/s0039-6109(05)70183-3. [DOI] [PubMed] [Google Scholar]
- 4.Adams TD, Gress RE, Smith SC, et al. Long-term mortality after gastric bypass surgery. N Engl J Med. 2007;357:753–61. doi: 10.1056/NEJMoa066603. [DOI] [PubMed] [Google Scholar]
- 5.Pories WJ, Swanson MS, MacDonald KG, et al. Who would have thought it? An operation proves to be the most effective therapy for adult-onset diabetes mellitus. Ann Surg. 1995;222:339–50. doi: 10.1097/00000658-199509000-00011. [DOI] [PMC free article] [PubMed] [Google Scholar]
- 6.Ponce J, Haynes B, Paynter S, et al. Effect of Lap-Band-induced weight loss on type 2 diabetes mellitus and hypertension. Obes Surg. 2004;14:1335–42. doi: 10.1381/0960892042583932. [DOI] [PubMed] [Google Scholar]
- 7.Torquati A, Lutfi R, Abumrad N, Richards WO. Is Roux-en-Y gastric bypass surgery the most effective treatment for type 2 diabetes mellitus in morbidly obese patients? J Gastrointest Surg. 2005;9:1112–6. doi: 10.1016/j.gassur.2005.07.016. [DOI] [PubMed] [Google Scholar]
- 8.Buchwald H, Avidor Y, Braunwald E, et al. Bariatric surgery: a systematic review and meta-analysis. JAMA. 2004;292:1724–37. doi: 10.1001/jama.292.14.1724. [DOI] [PubMed] [Google Scholar]
- 9.Dixon JB, O’Brien PE, Playfair J, et al. Adjustable gastric banding and conventional therapy for type 2 diabetes: a randomized controlled trial. JAMA. 2008;299:316–23. doi: 10.1001/jama.299.3.316. [DOI] [PubMed] [Google Scholar]
- 10.Schauer PR, Burguera B, Ikramuddin S, et al. Effect of laparoscopic Roux-en Y gastric bypass on type 2 diabetes mellitus. Ann Surg. 2003;238:467–84. doi: 10.1097/01.sla.0000089851.41115.1b. [DOI] [PMC free article] [PubMed] [Google Scholar]
- 11.Simpson NR, Souza F, Witkowski P, et al. Visualizing pancreatic beta-cell mass with [11C]DTBZ. Nucl Med Biol. 2006;33:855–64. doi: 10.1016/j.nucmedbio.2006.07.002. [DOI] [PMC free article] [PubMed] [Google Scholar]
- 12.Souza F, Simpson N, Raffo A, et al. Longitudinal noninvasive PET-based beta cell mass estimates in a spontaneous diabetes rat model. J Clin Invest. 2006;116:1506–13. doi: 10.1172/JCI27645. [DOI] [PMC free article] [PubMed] [Google Scholar]
- 13.Rubino F, Marescaux J. Effect of duodenal-jejunal exclusion in a non-obese animal model of type 2 diabetes: a new perspective for an old disease. Ann Surg. 2004;239:1–11. doi: 10.1097/01.sla.0000102989.54824.fc. [DOI] [PMC free article] [PubMed] [Google Scholar]
- 14.Conybeare G, Leslie GB. Improved oral dosing technique for rats. J Pharmacol Methods. 1988;19:109–16. doi: 10.1016/0160-5402(88)90031-9. [DOI] [PubMed] [Google Scholar]
- 15.Inabnet WB, III, Milone L, Korner J, et al. A rodent model of metabolic surgery for study of type 2 diabetes and positron emission tomography scanning of beta cell mass. Surg Obes Relat Dis. 2009;5:212–7. doi: 10.1016/j.soard.2008.09.007. [DOI] [PMC free article] [PubMed] [Google Scholar]
- 16.Pacheco D, de Luis DA, Romero A, et al. The effects of duodenal-jejunal exclusion on hormonal regulation of glucose metabolism in Goto-Kakizaki rats. Am J Surg. 2007;194:221–4. doi: 10.1016/j.amjsurg.2006.11.015. [DOI] [PubMed] [Google Scholar]
- 17.Rubino F, Forgione A, Cummings DE, et al. The mechanism of diabetes control after gastrointestinal bypass surgery reveals a role of the proximal small intestine in the pathophysiology of type 2 diabetes. Ann Surg. 2006;244:741–9. doi: 10.1097/01.sla.0000224726.61448.1b. [DOI] [PMC free article] [PubMed] [Google Scholar]
- 18.Drucker DJ, Nauck MA. The incretin system: glucagon-like peptide-1 receptor agonists and dipeptidyl peptidase-4 inhibitors in type 2 diabetes. Lancet. 2006;368:1696–705. doi: 10.1016/S0140-6736(06)69705-5. [DOI] [PubMed] [Google Scholar]
- 19.Korner J, Bessler M, Inabnet W, et al. Exaggerated glucagon-like peptide-1 and blunted glucose-dependent insulinotropic peptide secretion are associated with Roux-en-Y gastric bypass but not adjustable gastric banding. Surg Obes Relat Dis. 2007;3:597–601. doi: 10.1016/j.soard.2007.08.004. [DOI] [PMC free article] [PubMed] [Google Scholar]
- 20.Melissas J, Koukouraki S, Askoxylakis J, et al. Sleeve gastrectomy: a restrictive procedure? Obes Surg. 2007;17:57–62. doi: 10.1007/s11695-007-9006-5. [DOI] [PubMed] [Google Scholar]
- 21.Ilias I, Chen CC, Carrasquillo JA, et al. Comparison of 6-18F-fluorodopamine PET with 123I-metaiodobenzylguanidine and 111In-pentetreotide scintigraphy in localization of non-metastatic and metastatic pheochromocytoma. J Nucl Med. 2008;49:1613–9. doi: 10.2967/jnumed.108.052373. [DOI] [PMC free article] [PubMed] [Google Scholar]
- 22.Movassat J, Calderari S, Fernandez E, et al. Type 2 diabetes–a matter of failing beta-cell neogenesis? Clues from the GK rat model. Diabetes Obes Metab. 2007;9(Suppl 2):187–95. doi: 10.1111/j.1463-1326.2007.00786.x. [DOI] [PubMed] [Google Scholar]
- 23.Momose K, Nunomiya S, Nakata M, et al. Immunohistochemical and electron-microscopic observation of beta-cells in pancreatic islets of spontaneously diabetic Goto-Kakizaki rats. Med Mol Morphol. 2006;39:146–53. doi: 10.1007/s00795-006-0324-9. [DOI] [PubMed] [Google Scholar]


