

Abstract
Myeloperoxidase (MPO) is a target antigen for antineutrophil cytoplasmic autoantibodies (ANCA). There is evidence that MPO-ANCA cause necrotizing and crescentic glomerulonephritis (NCGN) and vasculitis. NCGN severity varies among patients with ANCA disease, and genetic factors influence disease severity. The role of genetics in MPO-ANCA NCGN severity was investigated using 13 inbred mouse strains, F1 and F2 hybrids, bone marrow chimeras, and neutrophil function assays. Mouse strains include founders of the Collaborative Cross. Intravenous injection of anti-MPO IgG induced glomerular crescents in >60% of glomeruli in 129S6/SvEv and CAST/EiJ mice, but <1% in A/J, DBA/1J, DBA/2J, NOD/LtJ, and PWK/PhJ mice. C57BL6J, 129S1/SvImJ, LP/J, WSB/EiJ, NZO/HILtJ, and C3H mice had intermediate severity. High-density genotypes at 542,190 single nucleotide polymorphisms were used to identify candidate loci for disease severity by identifying genomic regions that are different between 129S6/SvEv and 129S1/SvImJ mice, which are genetically similar but phenotypically distinct. C57BL/6 × 129S6 F2 mice were genotyped at 76 SNPs to capture quantitative trait loci for disease severity. The absence of a dominant quantitative trait locus suggests that differences in severity are the result of multiple gene interactions. In vivo studies using bone marrow chimeric mice and in vitro studies of neutrophil activation by anti-MPO IgG indicated that severity of NCGN is mediated by genetically determined differences in the function of neutrophils.
Anti-neutrophil cytoplasmic autoantibodies (ANCA), including ANCA specific for myeloperoxidase (MPO-ANCA), are associated with systemic vasculitis and pauci-immune necrotizing crescentic glomerulonephritis (NCGN), and there is strong evidence that MPO-ANCA are pathogenic.1 NCGN is induced in mice by injecting anti-MPO IgG,2–5 and is mediated by neutrophils, enhanced by neutrophil priming, modulated by Fc gamma receptor engagement, and requires alternative complement pathway activation.2–7
Patients with ANCA disease have varied NCGN severity, ranging from 100% to <5% crescents (average, 50%),8 and a minority of patients have systemic small vessel vasculitis with no glomerulonephritis.1 Evidence for genetic influence on ANCA-associated disease includes familial occurrences,9–13 greater frequency in first-degree relatives,14 differences in racial incidence,14–17 association between disease severity and polymorphisms in genes that influence immune responses and inflammation,18–28 and a genome-wide association study that indicates genetically determined differences between disease associated with MPO-ANCA versus proteinase 3–specific ANCA (PR3-ANCA).29
Intravenous injection of anti-MPO IgG into C57BL/6 (B6) mice induces NCGN with crescent formation in approximately 5% to 10% of glomeruli in 100% of mice.2–7 To investigate the effect of genetic backgrounds on disease severity, anti-MPO IgG was injected into 12 additional mouse strains, which demonstrated substantial differences in disease susceptibility and severity. High-density genotyping was used to identify candidate loci for disease severity by identifying genomic regions that are different between genetically similar, but phenotypically distinct, sister strains. F2 mice from a cross between low-severity B6 mice and high-severity 129S6/SvEv (129S6) mice were genotyped to identify quantitative trait loci (QTL) for disease severity. In vivo studies using bone marrow (BM) chimeric mice and in vitro studies of neutrophil activation by anti-MPO IgG demonstrated that NCGN severity is mediated by genetically determined differences in neutrophil function.
Materials and Methods
Mice
C57B6/6J (B6), 129S6/SvEv (129S6), 129S1/SvImJ (129S1), LP/J (LP), WSB/EiJ (WSB), NZO/H1LtJ (NZO), PWK/PhJ (PWK), NOD/LtJ (NOD), DBA1, DBA2, AJ, C3H, and CAST/Ei (CAST), C57BL/6J (B6) and LP/J (LP) mice were purchased from Jackson Laboratories (Bar Harbor, ME). 129S6/SvEv (129S6), 129S1, Rag2 knockout with B6.SJL background (Rag2−/−B6), and Rag2 knockout with 129S6/SvEv background (Rag2−/−129S6) mice were purchased from Taconic Farms (Germantown, NY). NOD/LtJ, NZO/H1LtJ, PWK/PhJ, and WSB/EiJ were obtained from the University of North Carolina Department of Genetics. MPO knockout (Mpo−/−) mice were initially generated by Aratani and colleagues.30 B6, 129S1, NOD, NZO, PWK, WSB, CAST, and A/J strains are founders of the Collaborative Cross31,32 and capture 90% of the genetic diversity among laboratory mice. F1 mice were generated by B6 backcross with 129S6 mice, and 100 F2 mice were generated by (B6X129S6) F1 intercross. Mice were maintained by University of North Carolina Division of Laboratory Animal Medicine in adherence to the 2011 NIH Guide for Care and Use of Laboratory Animals.
Preparation of Pathogenic Mouse Anti-Murine MPO IgG
Purification of native mouse MPO and immunization of Mpo−/− mice were performed as described.2 Mpo−/− mice 8 to 10 weeks old were immunized intraperitoneally with 20 μg of purified murine MPO in complete Freund’s adjuvant and boosted twice with 10 μg of MPO in incomplete Freund’s adjuvant. Anti-MPO was monitored by enzyme-linked immunosorbent assay. Anti-MPO IgG was isolated from serum of Mpo−/− mice immunized with MPO by 50% ammonium sulfate precipitation and protein G affinity chromatography.2 Purity of antibodies was confirmed by SDS-PAGE electrophoresis, and protein concentrations determined by Coomassie protein assay (Pierce, Rockford, IL).
Induction of Glomerulonephritis with Anti-MPO IgG
Mice were injected intravenously with 50 μg/g bodyweight mouse anti-mouse MPO IgG.2 After 6 days, mice were sacrificed and kidneys examined by light microscopy for NCGN. For BM transplantation experiments, 6 weeks after BM transfer, Rag2−/− mice were injected intravenously with 50 μg/g body weight of anti-MPO IgG and sacrificed 6 days later.
Pathological Evaluation
Kidneys were collected at the time of sacrifice and fixed in 10% formalin, embedded in paraffin, sectioned at 4 μm, stained with H&E and periodic acid Schiff, and then evaluated by light microscopy. The extent of glomerular crescents and necrosis were expressed as mean % glomeruli with crescents or necrosis by counting all glomeruli in cross sections of both kidneys, which averaged approximately 80 per mouse. Glomerular leukocytes in kidneys from BM chimeric mice were evaluated by immunohistochemistry on paraffin sections.
BM Chimeras
BM cells were harvested from femurs and tibia of B6 and 129S6 mice, and erythrocytes removed by hypotonic lysis.7 Age-matched Rag2−/−B6 and Rag2−/−129S6 recipient mice were kept under sterile conditions and given acidified water with 0.2% neomycin at least 1 week before irradiation. Recipients were lethally γ-irradiated with 900 rad, and 12 to 24 hours later were reconstituted intravenously with 1.5 × 10⁷ donor BM cells: 129/S6 donor cells into Rag2−/−B6 recipients (129S6 → Rag2−/−B6 chimeras), B6 donor cells into Rag2−/−129S6 recipients (B6 → Rag2−/−129S6 chimeras). Successful transplantation was confirmed by flow cytometry measuring CD45.1 and CD45.2 (BD Pharmingen, San Jose, CA), which distinguish leukocytes from recipients and donors.
In Vitro Neutrophil Activation by Anti-MPO IgG
Superoxide dismutase (SOD)-inhibitable reduction of ferricytochrome C was used to measure neutrophil oxidative activity. Neutrophils were suspended at 1 × 10⁷ in HBSS buffer and pretreated with 5 μg/mL cytochalasin B for 15 minutes at 4°C. Neutrophils (5 × 10⁵, in HBSS) were prewarmed with 50 μmol/L ferricytochrome with or without 300 U/mL SOD for 15 minutes at 37°C and then primed with 2 ng/mL tumor necrosis factor-alpha (TNF-α) for 15 minutes at 37°C. Primed neutrophils were incubated with 250 μg/mL anti-mouse MPO IgG at 37°C, and absorption of samples was scanned at 550 nm every 5 minutes for 60 minutes using a Microplate Autoreader (Molecular Devices, Sunnyvale, CA).
Comparative Genomic Evaluation
Genetic variation among mouse strains was determined by comparing publically available high-density genotypes at 542,190 single nucleotide polymorphisms (SNPs) using a mouse diversity array.33–36 Genomic clustering of identical genotypes was performed to identify regions identical by descent (IBD). IBD was performed by counting the number of identical SNPs in 100 SNP windows. Windows with 98% genotype similarity were declared IBD.36
QTL Mapping
B6 × 129S6 F2 intercross was used to associate genetic variants with NCGN phenotypes. Genomic DNA was isolated from tails with a proteinase K/SDS lysis solution followed by phenol-chloroform extraction. Ninety-nine female F2 mice were genotyped at 76 SNPs using Sequenom iPEX MassARRAY (Sequenom, San Diego, CA) (1 of 108 samples was inadequate). The genetic map was estimated using the R/qtl est.map function (R software; http://www.r-project.org/)37,38 assuming genotyping error of 0.001. Single-QTL interval mapping (IM) was performed using the R/qtl scanone function on % crescents and log % crescents. Log % crescents was distributed normally and IM was performed using a normal model. % crescents was mapped with a nonparametric IM model. A two-QTL model was used for log % crescents using the R/qtl scantwo function. Thresholds for both single- and two-QTL models were determined by 1000 permutations.39
Statistical Analysis
Tukey’s multiple comparison test was used for evaluating differences in mean percent crescents between groups.
Results
Survey of Mouse Strains Demonstrates Genetic Basis of Severity of Anti-MPO NCGN
Mean % crescents induced by anti-MPO varied from 0% to >60% in 13 mouse strains including 8 Collaborative Cross founders that include 90% of the genetic diversity among laboratory mice31,32 (Table 1 and Figures 1 and 2). 129S6/SvEv (129S6) mice had 47 to 90% (mean 63.7%) compared to 4 to 23% in B6 (mean 9.5%) (P < 0.001). 129S1 mice developed an average of 21% crescents, which was a significant reduction (P < 0.001) compared to 129S6. LP/J mice were included because they share ancestry with 129 mice33 and were found to have severity similar to 129S1 rather than 129S6. DBA1, DBA2, and C3H were included because they have susceptibility to vasculitis in other models. As shown in Figure 2 and Table 1, anti-MPO IgG induced NCGN in WSB and C3H mice, similar to B6 mice. CAST mice developed severe NCGN similar to 129S6. NZO mice developed <5% crescents. Only a minority of PWK and DBA1 mice developed crescents, affecting <1% of glomeruli. NOD, AJ, and DBA2 mice were resistant to NCGN induction.
Table 1.
Anti-MPO IgG–Induced Glomerular Lesions in Different Strains of Mice
| Strains | Mouse numbers, n | Mice with crescents, n | Mean % crescents when present | Mice with necrosis, n | Mean % necrosis when present |
|---|---|---|---|---|---|
| B6 | 27 | 27 | 9.5 | 27 | 4.0 |
| 129S6 | 24 | 24 | 63.7∗ | 24 | 22.4∗ |
| 129S1 | 22 | 22 | 21.1† | 21 | 7.3† |
| LP | 8 | 8 | 19.8 | 8 | 5.9 |
| WSB | 4 | 4 | 9.0 | 4 | 2.8 |
| NZO | 4 | 4 | 2.8 | 4 | 2.8 |
| PWK | 5 | 1 | 0.7 | 0 | NA |
| NOD | 4 | 0 | NA | 0 | NA |
| DBA1 | 5 | 2 | 0.9 | 0 | NA |
| DBA2 | 5 | 0 | NA | 0 | NA |
| AJ | 4 | 0 | NA | 0 | NA |
| C3H | 5 | 5 | 5.2 | 4 | 2.3 |
| CAST | 5 | 5 | 61.2 | 5 | 35.6 |
NA, not applicable; no crescents or necrosis was observed.
P < 0.001 versus B6 and 129S1 mice.
P > 0.4 versus LP mice.
Figure 1.
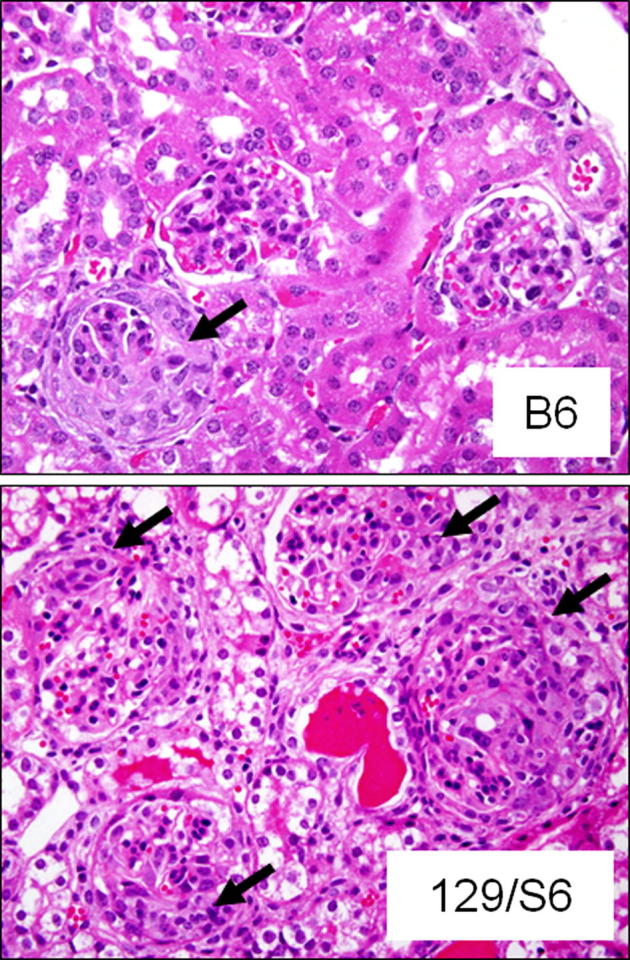
Photomicrographs demonstrating less severe NCGN caused by anti-MPO IgG in a B6 mouse, with an arrow showing one of three glomeruli with a crescent, compared to a 129S6 mouse, with arrows pointing to crescents in four of four glomeruli and a background of secondary tubulointerstitial changes (H&E stains).
Figure 2.

Severity of NCGN in 13 strains of mice and in B6 × 129S6 F1 and F2 mice, represented as the % of glomeruli with crescents. The two groups of B6 mice received different antibody preparations.
Comparative Genome Analysis of 129S6, 129S1, B6, and LP Strains
129S6 and 129S1 have a significantly different fraction of glomeruli affected but are closely related, with most genetic differences clustered.34,35 High-density genotypes were compared between 129S6 and 129S1 strains (Table 2 and 3). B6 and LP strains were also evaluated. The mouse diversity array36,40 used for genotyping contains 542,190 SNPs. Of these, 137,378 SNPs (25.34%) segregated among the four strains. B6 differs from the other three strains at over 20% of SNPs, LP differs from 129 at 7% to 8%, and the 129 substrains differ from each other at <1% (Table 3).
Table 2.
SNP Genotypes in IBD and Non-IBD Regions between 129S1 and 129S6
| IBD | Non-IDB | |
|---|---|---|
| Total mismatches | 460 | 4048 |
| Fraction of mismatches | 10.20% | 89.80% |
| Fraction of genome | 96.69% | 3.31% |
| Frequency of mismatches | 0.09% | 22.85% |
Table 3.
Comparative Genotype Analysis Using the Mouse Diversity Array
| 129S6 vs B6 | 129S6 vs 129 S1 | 129S6 vs LP/J | 129S1 vs LP/J | 129S1 vs B6 | B6 vs LP/J | |
|---|---|---|---|---|---|---|
| Genome wide | ||||||
| Number of mismatches | 115,069 | 4508 | 41,949 | 38,908 | 114,567 | 116,926 |
| Percentage of mismatches | 21.22% | 0.83% | 7.74% | 7.18% | 21.13% | 21.57% |
| Percentage of matches | 78.78% | 99.17% | 92.26% | 92.82% | 78.87% | 78.43% |
| Percentage of IBD∗ | 27.42% | 96.69% | 72.16% | 74.43% | 28.04% | 27.99% |
| 129S6 and 129S1 non-IBD† | ||||||
| Number of mismatches | 4075 | 4048 | 3931 | 1100 | 3641 | 3481 |
| Percentage of mismatches | 23.01% | 22.85% | 22.19% | 6.21% | 20.56% | 19.56% |
Six pairwise genotype comparisons of four inbred mouse strains were performed at 542,190 SNPs distributed across the genome to assess the extent of genetic relatedness.
The fraction of the genome that was defined as identical by descent (IBD) between any two strains was determined by calculating the percentage of those two genomes with 98% or greater identity over windows of 100 SNPs.
The regions of the genome that were non-IBD between 129 S6 and 129 S1 contained 17,713 SNPs of the Mouse Diversity Array. Pairwise genotype comparisons of the four inbred mouse strains were performed at these 17,713 SNPs to assess the genetic relatedness within the 129 S6 and 129 S1 non-IBD regions.
We determined that the B6 strain is IBD with each of the other three strains over 28% of the genome. The remaining 72% is a likely location of alleles associated with reduced severity of NCGN. However, the IBD regions cannot be eliminated as candidate regions that influence NCGN phenotypes because genes within an IBD region could interact with genes in non-IBD regions to influence disease. More recent separation of the LP strain from the 129 substrains resulted in a greater IBD fraction than for B6 (72% to 74%). The high degree of genetic similarity between 129S1 and 129S6 (>99% SNP matches) contrasted with striking differences in NCGN severity. 129S1 and 129S6 are IBD at 96.7% of the genome (Table 2 and 3). The 3.3% non-IBD fraction is confined to 15 regions over 90.8 Mb on nine chromosomes (Figure 3). These non-IBD regions contain 90% of mismatches between 129S1 and 129S6 (Table 2). In these regions, the 129 substrains are as different from each other as 129S6 is from B6 or LP, and 129S1 is from B6 (Table 3). 129S1 is IBD to LP across 8 of 15 regions (1, 2, 3, 5, 6, 11, 12, and 15; 56.0 Mb). Shared alleles in these regions probably explain the similar phenotypes. 129S1 is IBD to B6 in region 10 (1.0 Mb) and is nearly identical in regions 6 (11.7 Mb) and 1a (3.3 Mb). By contrast, 129S6 is identical to B6 and LP only in regions 14 (1.2 Mb) and 4 (2.9 Mb) and is completely divergent across other regions. These 15 regions (Figure 3), which contain 761 known genes (Supplemental Table S1), are candidates for loci mediating differences in NCGN between 129 substrains.
Figure 3.

The 3.3% non-IBD fraction is confined to 15 regions over 90.8 Mb on nine chromosomes. In the regions in which 129S1 and 129S6 are genetically identical, the blue and red lines are close together, whereas in divergent regions, they are farther apart.
Linkage Analysis of C57BL/6 × 129S6 F2 Intercross
Female F1 mice produced by crossing B6 and 129S6 mice, and female F2 mice produced by intercrossing F1 mice, were injected with anti-MPO IgG. F1 mice (n = 9) developed an average of 13.6% crescents, and F2 mice (n = 100) developed a wide range of NCGN severity with clustering at lesser severity, more like B6 than 129S6 (Figure 2).
The F2 intercross population was genotyped at 76 SNPs to capture quantitative trait loci (QTL) for disease severity. Suggestive QTL peaks were observed for log-transformed % crescents on Chromosomes 4, 5, 7, 9, and 10; however, no QTL peaks reached sufficient genome-wide significance, as calculated for 5% and 10% error thresholds. Suggestive QTL on Chromosome 4 and Chromosome 9 do not include 129S6-129S1 non-IBD regions, thus these regions may contain alleles that explain differences between B6 and 129S6. The suggestive QTL on Chromosome 5, 7, and 10 each span regions that have significant divergence between 129 substrains. Based on this linkage analysis, differences in disease severity are likely to result from multiple gene interactions, and may involve epistasis.
BM–Derived Cells Mediate Genetic Differences in Severity between Strains
To determine whether differences in NCGN severity between B6 and 129S6 resulted from differences in function of BM-derived cells, BM chimeric mice were produced. Rag2−/− B6 or Rag2−/− 129S6 mice were lethally irradiated followed by intravenous injection of 129S6 or B6 BM, respectively, resulting in chimeras that had B6 bodies with 129S6 BM, or 129S6 bodies with B6 BM. Engraftment of hematopoietic cells was confirmed by flow cytometric measurement of % recipient common leukocyte antigen (CD45.1 or CD45.2) positive peripheral blood leukocytes (PBL) and % donor CD45 positive PBL. Four weeks after irradiation and transplantation, >95% of PBL were donor derived. Anti-MPO was administrated intravenously 4 weeks after BM transfer, and 6 days later, NCGN was assessed. Rag2−/− B6 mice (n = 4) transplanted with 129S6 BM developed 79% crescents (69% to 85%), which is similar to Rag2−/− 129S6 mice (Figure 4). Rag2−/−129S6 mice (n = 6) that received BM from B6 mice had 17% crescents (9% to 22%) similar to Rag2−/− B6. Immunohistochemical staining for neutrophils and macrophages demonstrated more neutrophils in glomeruli of B6 mice with 129S6 BM compared to 129S6 mice with B6 BM, although there was no difference in macrophages (Table 4). Thus, genetically determined characteristics of BM-derived cells are responsible for the marked differences in disease between B6 and 129S6 mice, and this is associated with glomerular neutrophil infiltration.
Figure 4.

BM chimeric mice were created by transplanting (Tx) 129S6 or B6 BM into lethally irradiated Rag2−/− B6 or Rag2−/− 129S6 mice, respectively. The severity of glomerulonephritis induced by anti-MPO IgG was determined in the BM chimeras and the corresponding nonchimeric donor strains. The severity of crescent formation corresponded with the BM genotype, not the somatic genotype.
Table 4.
Pathologic Features in Bone Marrow Chimeric Mice That Received Anti-MPO IgG.
| 129S6 BM in B6 body | B6 BM in 129S6 body | |
|---|---|---|
| % Gloms with crescents | 79.29 ± 7.14% | 17.00 ± 4.77% |
| % Gloms with neutrophils | 84.13 ± 4.17% | 21.5 ± 8.95% |
| Neutrophils per glom | 3.15 ± 0.30 | 0.38 ± 0.17 |
| % Gloms with macrophages | 6.25 ± 1.89% | 5.0 ± 1.63% |
| Macrophages per glom | 0.07 ± 0.03 | 0.05 ± 0.02 |
Neutrophils and macrophages were detected by immunohistochemistry.
Gloms, glomeruli.
Genetically Determined Differences in Activation of Neutrophils by Anti-MPO
Neutrophils were primed with TNF-α, incubated with anti-MPO IgG, and superoxide generation was then measured. Anti-MPO IgG caused more activation of neutrophils from 129S6 compared to neutrophils from B6 or 129S1 mice (Figure 5), which correlated with NCGN severity in these strains (Table 1 and Figure 2), and demonstrated that genetic differences influence neutrophil activation by anti-MPO.
Figure 5.

In vitro activation by anti-MPO IgG of neutrophils. Neutrophils from B6 (black circles), 129S6 (black triangles), and 129S1 (black squares) mice were primed with TNF-α, incubated with murine anti-MPO IgG, and superoxide generation was measured as an indicator of neutrophil activation. Negative control experiments included neutrophils from B6 (white circles), 129S6 (white triangles), and 129S1 (white squares), all treated with TNF-α, but no anti-MPO IgG.
Discussion
Differences in severity of NCGN induced by anti-MPO IgG among mouse strains indicate that severity is genetically determined and that there are either protective alleles in less affected strains, or severity alleles in more severely affected strains. Because 129S6 × B6 F1 mice exhibit less severe NCGN than 129S6, either some or all B6 alleles are protective and have a dominant mode of inheritance, or 129S6 severity alleles are recessive. NCGN phenotypes in 129S6 × B6 F2 mice span the extremes seen in 129S6 and B6 strains, suggesting that NCGN induced by anti-MPO is a polygenic trait.
Comparative genome analysis using the mouse diversity array revealed differences in genomic architecture underlying differences in NCGN phenotypes among four inbred strains. This comparison demonstrated that genomes of 129 substrains do not contain uniformly distributed de novo mutations acquired since the strains split; instead, their genomes are highly divergent over discrete regions. Genes responsible for difference in NCGN phenotype between the 129 substrains may be in the 90.8 Mb that differs between these substrains. However, it is also possible that genetic interactions between loci in IBD and non-IBD regions influence disease severity. Linkage analysis planned for the future in an F2 population between 129S6 and 129S1 mice could address this possibility; moreover, linkage analysis of an S6–S1 F2 intercross, or backcross, would simplify genetic architecture within the mapping population and increase the power to detect variants associated with NCGN in the 15 candidate regions. De novo mutation could account for differences between 129S1 and 129S6; however, de novo mutation could not be assessed without 129S6 genomic sequence.
Several of these 761 known genes in the non-IBD fraction of 129S1 and 129S6 (Supplemental Table S1) are particularly interesting based on previous studies on the pathogenesis of ANCA disease,1-7 including genes involved in antibody–cell surface interaction, epigenetic gene regulation, complement activation, Fc receptor engagement, and cell signaling. Given the evidence for an important role for FcγR in the pathogenesis of ANCA disease,41–47 it is interesting that there are multiple Fc receptor genes in the 129S6/129S1 non-IBD regions: Fc gamma receptor 1 gene (Fcgr1) in region 2 on Chromosome 3, and Fc receptor-like 5 (Fcrl5), Fc receptor-like 1 (Fcrl1), and Fc receptor-like scavenger (Fcrls) in region 2 on Chromosome 3.
F2 intercross between B6 and 129S6 was used to investigate genetic factors affecting NCGN severity. The NCGN phenotypes in 129S6 × B6 F2 mice span the range seen in 129S6 and B6, suggesting that NCGN induced by anti-MPO IgG is a polygenic trait. A significant QTL was not detected, suggesting complex genetic architecture, possibly involving epistasis. However, multiple suggestive peaks were observed, three of which spanned non-IBD regions between the 129 substrains. Suggestive QTL peaks were observed for log-transformed % crescents on Chromosomes 4, 5, 7, 9, and 10; however, no QTL peaks reached sufficient genome-wide significance, as calculated for 5% and 10% error thresholds. The suggestive regions on Chromosome 5 and Chromosome 7 are the second and third largest genomic regions of divergence, spanning 26 Mb. Two genes involved in epigenetic histone modifications reside on Chromosome 7: Eed, a component of the Polycomb repressive complex 2 (PRC2) that methylates H3K27, and Mll4, an H3K4 methyltransferase. Dysregulated expression of ANCA autoantigen genes occurs in neutrophils of ANCA disease patients,48–50 and is associated with disrupted epigenetic silencing via histone methylation of autoantigen genes.50 This overlap between a non-IBD region, a suggestive QTL, and a transcriptional regulatory mechanism for ANCA autoantigen genes is intriguing and will be studied further.
The absence of a significant QTL for NCGN severity in our model differs from the identification of QTL in other rodent models of crescentic glomerulonephritis.51,52 An important distinction is that these studies investigated disease susceptibility, whereas our study investigated severity. More importantly, both of these models have either a more complex interplay of multiple pathogenic processes in addition to ANCA-mediated injury51 or a different pathogenic process that does not involve ANCA.52 The most relevant model to ours is induced in Wistar Kyoto (WKY) rats by immunization with human MPO, which results in anti-MPO antibodies that cross-react with rat MPO and cause NCGN.53 Unlike WKY rats, Lewis, Wistar Furth, and Brown Norway rats immunized with human MPO do not develop NCGN, even though they develop comparable levels of anti-MPO to WKY rats. We hypothesized that this strain difference was more likely caused by genetically determined differences in the innate immune response rather than a difference in the adaptive immune response. This is in agreement with the findings in our study that show that identical injections of anti-MPO IgG into different mouse strains induce very different degrees of NCGN, thus implicating difference in innate immunity rather than adaptive immunity as the basis for the differences in pathogenesis.
Conclusion
The severity of anti-MPO–induced NCGN in this mouse model is genetically modulated, and this genetic influence acts through modulation of responsivity of neutrophils to activation by ANCA. Linkage analysis suggests that this is a complex polygenic trait. Additional studies will be required to identify the genes and regulatory mechanisms responsible for this modulation. These genes and gene products may have important roles in pathogenesis of human ANCA disease, and could be markers of disease activity and outcome, as well as targets for therapy.
Acknowledgments
We thank Yichun Hu (UNC Kidney Center, Chapel Hill, NC) for statistical analysis.
Footnotes
Supported by NIH NIDDK grant 2-P01-DK058335-11 (H.X., P.H., R.J.F., and J.C.J.).
H.X. and D.C. contributed equally to this work.
Supplemental Data
References
- 1.Falk R.J., Jennette J.C. ANCA disease: where is this field going? J Am Soc Nephrol. 2010;21:745–752. doi: 10.1681/ASN.2009121238. [DOI] [PubMed] [Google Scholar]
- 2.Xiao H., Heeringa P., Hu P., Liu Z., Zhao M., Aratani Y., Maeda N., Falk R.J., Jennette J.C. Antineutrophil cytoplasmic autoantibodies specific for myeloperoxidase cause glomerulonephritis and vasculitis in mice. J Clin Invest. 2002;110:955–963. doi: 10.1172/JCI15918. [DOI] [PMC free article] [PubMed] [Google Scholar]
- 3.Xiao H., Heeringa P., Liu Z., Huugen D., Hu P., Falk R.J., Jennette J.C. A major role for neutrophils in anti-myeloperoxidase antibody induced necrotizing and crescentic glomerulonephritis. Am J Pathol. 2005;167:39–45. doi: 10.1016/S0002-9440(10)62951-3. [DOI] [PMC free article] [PubMed] [Google Scholar]
- 4.Xiao H., Schreiber A., Heeringa P., Falk R.J., Jennette J.C. Alternative complement pathway in the pathogenesis of disease mediated by antineutrophil cytoplasmic autoantibodies. Am J Pathol. 2007;170:52–64. doi: 10.2353/ajpath.2007.060573. [DOI] [PMC free article] [PubMed] [Google Scholar]
- 5.Jennette J.C., Xiao H., Falk R., Gasim A.M. Experimental models of vasculitis and glomerulonephritis induced by antineutrophil cytoplasmic autoantibodies. Contrib Nephrol. 2011;169:211–220. doi: 10.1159/000314776. [DOI] [PMC free article] [PubMed] [Google Scholar]
- 6.Schreiber A., Xiao H., Falk R.J., Jennette J.C. Bone marrow-derived cells are sufficient and necessary targets to mediate glomerulonephritis and vasculitis induced by anti-myeloperoxidase antibodies. J Am Soc Nephrol. 2006;17:3355–3364. doi: 10.1681/ASN.2006070718. [DOI] [PubMed] [Google Scholar]
- 7.Schreiber A., Xiao H., Jennette J.C., Schneider W., Luft F.C., Kettritz R. C5a receptor mediates neutrophil activation and ANCA-induced glomerulonephritis. J Am Soc Nephrol. 2009;20:289–298. doi: 10.1681/ASN.2008050497. [DOI] [PMC free article] [PubMed] [Google Scholar]
- 8.Jennette J.C. Rapidly progressive and crescentic glomerulonephritis. Kidney Int. 2003;63:1164–1172. doi: 10.1046/j.1523-1755.2003.00843.x. [DOI] [PubMed] [Google Scholar]
- 9.Hay E.M., Beaman M., Ralston A.J., Ackrill P., Bernstein R.M., Holt P.J. Wegener’s granulomatosis occurring in siblings. Br J Rheumatol. 1991;30:144–145. doi: 10.1093/rheumatology/30.2.144. [DOI] [PubMed] [Google Scholar]
- 10.Muniain M.A., Moreno J.C., Gonzalez Campora R. Wegener’s granulomatosis in two sisters. Ann Rheum Dis. 1986;45:417–421. doi: 10.1136/ard.45.5.417. [DOI] [PMC free article] [PubMed] [Google Scholar]
- 11.Nowack R., Lehmann H., Flores-Suarez L.F., Nanhou A., van der Woude F.J. Familial occurrence of systemic vasculitis and rapidly progressive glomerulonephritis. Am J Kidney Dis. 1999;34:364–373. doi: 10.1016/s0272-6386(99)70371-9. [DOI] [PubMed] [Google Scholar]
- 12.Brener Z., Cohen L., Goldberg S.J., Kaufman A.M. ANCA-associated vasculitis in Greek siblings with chronic exposure to silica. Am J Kidney Dis. 2001;38:E28. doi: 10.1053/ajkd.2001.28625. [DOI] [PubMed] [Google Scholar]
- 13.Manganelli P., Giacosa R., Fietta P., Zanetti A., Neri T.M. Familial vasculitides: churg-Strauss syndrome and Wegener’s granulomatosis in 2 first-degree relatives. J Rheumatol. 2003;30:618–621. [PubMed] [Google Scholar]
- 14.Knight A., Sandin S., Askling J. Risks and relative risks of Wegener’s granulomatosis among close relatives of patients with the disease. Arthritis Rheum. 2008;58:302–307. doi: 10.1002/art.23157. [DOI] [PubMed] [Google Scholar]
- 15.O’Donnell J.L., Stevanovic V.R., Frampton C., Stamp L.K., Chapman P.T. Wegener’s granulomatosis in New Zealand: evidence for a latitude dependent incidence gradient. Intern Med J. 2007;37:242–246. doi: 10.1111/j.1445-5994.2006.01297.x. [DOI] [PubMed] [Google Scholar]
- 16.Mahr A., Guillevin L., Poissonnet M., Ayme S. Prevalences of polyarteritis nodosa, microscopic polyangiitis, Wegener’s granulomatosis, and Churg-Strauss syndrome in a French urban multiethnic population in 2000: a capture-recapture estimate. Arthritis Rheum. 2004;51:92–99. doi: 10.1002/art.20077. [DOI] [PubMed] [Google Scholar]
- 17.Hogan S.L., Falk R.J., Chin H., Cai J., Jennette C.E., Jennette J.C., Nachman P.H. Predictors of relapse and treatment resistance in antineutrophil cytoplasmic antibody-associated small-vessel vasculitis. Ann Intern Med. 2005;143:621–631. doi: 10.7326/0003-4819-143-9-200511010-00005. [DOI] [PubMed] [Google Scholar]
- 18.Spencer S.J., Burns A., Gaskin G., Pusey C.D., Rees A.J. HLA class II specificities in vasculitis with antibodies to neutrophil cytoplasmic antigens. Kidney Int. 1992;41:1059–1063. doi: 10.1038/ki.1992.161. [DOI] [PubMed] [Google Scholar]
- 19.Esnault V.L., Testa A., Audrain M., Rogé C., Barrier J.H., Sesboüé R., Martin J.P., Lesavre P. Alpha 1-antitrypsin genetic polymorphism in ANCA positive systemic vasculitis. Kidney Int. 1993;43:1329–1332. doi: 10.1038/ki.1993.186. [DOI] [PubMed] [Google Scholar]
- 20.Griffith M.E., Lovegrove J.U., Gaskin G., Whitehouse D.B., Pusey C.D. C-antineutrophil cytoplasmic antibody positivity in vasculitis patients is associated with the Z allele of alpha-1-antitrypsin, and P-antineutrophil cytoplasmic antibody positivity with the S allele. Nephrol Dial Transplant. 1996;11:438–443. [PubMed] [Google Scholar]
- 21.Jagiello P., Gencik M., Arning L., Wieczorek S., Kunstmann E., Csernok E., Gross W.L., Epplen J.T. New genomic region for Wegener’s granulomatosis as revealed by an extended association screen with 202 apoptosis-related genes. Hum Genet. 2004;114:468–477. doi: 10.1007/s00439-004-1092-z. [DOI] [PubMed] [Google Scholar]
- 22.Heckmann M., Holle J.U., Arning L., Knaup S., Hellmich B., Nothnagel M., Jagiello P., Gross W.L., Epplen J.T., Wieczorek S. The Wegener’s granulomatosis quantitative trait locus on chromosome 6p21.3 as characterised by tagSNP genotyping. Ann Rheum Dis. 2008;67:972–979. doi: 10.1136/ard.2007.077693. [DOI] [PubMed] [Google Scholar]
- 23.Carr E.J., Clatworthy M.R., Lowe C.E., Todd J.A., Wong A., Vyse T.J., Kamesh L., Watts R.A., Lyons P.A., Smith K.G. Contrasting genetic association of IL2RA with SLE and ANCA-associated vasculitis. BMC Med Genet. 2009;10:22. doi: 10.1186/1471-2350-10-22. [DOI] [PMC free article] [PubMed] [Google Scholar]
- 24.Carr E.J., Niederer H.A., Williams J., Harper L., Watts R.A., Lyons P.A., Smith K.G. Confirmation of the genetic association of CTLA4 and PTPN22 with ANCA-associated vasculitis. BMC Med Genet. 2009;10:121. doi: 10.1186/1471-2350-10-121. [DOI] [PMC free article] [PubMed] [Google Scholar]
- 25.Kamesh L., Heward J.M., Williams J.M., Gough S.C., Chavele K.M., Salama A., Pusey C., Savage C.O., Harper L. CT60 and _49 polymorphisms of CTLA 4 are associated with ANCA-positive small vessel vasculitis. Rheumatology (Oxford) 2009;48:1502–1505. doi: 10.1093/rheumatology/kep280. [DOI] [PubMed] [Google Scholar]
- 26.Stassen P.M., Cohen-Tervaert J.W., Lems S.P., Hepkema B.G., Kallenberg C.G., Stegeman C.A. HLA-DR4. DR13(6) and the ancestral haplotype A1B8DR3 are associated with ANCA-associated vasculitis and Wegener’s granulomatosis. Rheumatology (Oxford) 2009;48:622–625. doi: 10.1093/rheumatology/kep057. [DOI] [PubMed] [Google Scholar]
- 27.Willcocks L.C., Lyons P.A., Rees A.J., Smith K.G. The contribution of genetic variation and infection to the pathogenesis of ANCA associated systemic vasculitis. Arthritis Res Ther. 2010;12:202. doi: 10.1186/ar2928. [DOI] [PMC free article] [PubMed] [Google Scholar]
- 28.Cao Y., Schmitz J.L., Yang J., Hogan S.L., Bunch D., Hu Y., Jennette C.E., Berg E.A., Arnett F.C., Jr., Jennette J.C., Falk R.J., Preston G.A. DRB1*15 allele is a risk factor for PR3-ANCA disease in African Americans. J Am Soc Nephrol. 2011;122:1161–1167. doi: 10.1681/ASN.2010101058. [DOI] [PMC free article] [PubMed] [Google Scholar]
- 29.Lyons P.A., Rayner T.F., Trivedi S., Holle J.U., Watts R.A., Jayne D.R. Genetically distinct subsets within ANCA-associated vasculitis. N Engl J Med. 2012;367:214–223. doi: 10.1056/NEJMoa1108735. [DOI] [PMC free article] [PubMed] [Google Scholar]
- 30.Aratani Y., Koyama H., Nyui S., Suzuki K., Kura F., Maeda N. Severe impairment in early host defense against Candida albicans in mice deficient in myeloperoxidase. Infect Immun. 1999;67:1828–1836. doi: 10.1128/iai.67.4.1828-1836.1999. [DOI] [PMC free article] [PubMed] [Google Scholar]
- 31.Churchill G.A., Airey D.C., Allayee H., Angel J.M., Attie A.D., Beatty J. The Collaborative Cross, a community resource for the genetic analysis of complex traits. Nat Genet. 2004;36:1133–1137. doi: 10.1038/ng1104-1133. [DOI] [PubMed] [Google Scholar]
- 32.Aylor D.L., Valdar W., Foulds-Mathes W., Buus R.J., Verdugo R.A., Baric R.S. Genetic analysis of complex traits in the emerging Collaborative Cross. Genome Research. 2011;21:1213–1222. doi: 10.1101/gr.111310.110. [DOI] [PMC free article] [PubMed] [Google Scholar]
- 33.Beck J.A., Lloyd S., Hafezparast M., Lennon-Pierce M., Eppig J.T., Festing M.F., Fisher E.M. Genealogies of mouse inbred strains. Nat Genet. 2000;24:23–25. doi: 10.1038/71641. [DOI] [PubMed] [Google Scholar]
- 34.Simpson E.M., Linder C.C., Sargent E.E., Davisson M.T., Mobraaten L.E., Sharp J.J. Genetic variation among 129 substrains and its importance for targeted mutagenesis in mice. Nat Genet. 1997;16:19–27. doi: 10.1038/ng0597-19. [DOI] [PubMed] [Google Scholar]
- 35.Threadgill D.W., Yee D., Matin A., Nadeau J.H., Magnuson T. Genealogy of the 129 inbred strains: 129/SvJ is a contaminated inbred strain. Mamm Genome. 1997;8:390–393. doi: 10.1007/s003359900453. [DOI] [PubMed] [Google Scholar]
- 36.Yang H., Ding Y., Hutchins L.N., Szatkiewicz J., Bell T.A., Paigen B.J., Graber J.H., de Villena F.P., Churchill G.A. A customized and versatile high-density genotyping array for the mouse. Nat Methods. 2009;6:663–666. doi: 10.1038/nmeth.1359. [DOI] [PMC free article] [PubMed] [Google Scholar]
- 37.Broman K.W., Wu H., Sen S., Churchill G.A. QTL mapping in experimental crosses. Bioinformatics. 2003;19:889–890. doi: 10.1093/bioinformatics/btg112. [DOI] [PubMed] [Google Scholar]
- 38.Sen S., Johannes F., Broman K.W. Selective genotyping and phenotyping strategies in a complex trait context. Genetics. 2009;181:1613–1626. doi: 10.1534/genetics.108.094607. [DOI] [PMC free article] [PubMed] [Google Scholar]
- 39.Churchill G.A., Doerge R.W. Empirical threshold values for quantitative trait mapping. Genetics. 1994;138:963–971. doi: 10.1093/genetics/138.3.963. [DOI] [PMC free article] [PubMed] [Google Scholar]
- 40.Yang H., Wang J.R., Didion J.P., Buus R.J., Bell T.A., Welsh C.E., Bonhomme F., Yu A.H., Nachman M.W., Pialek J., Tucker P., Boursot P., McMillan L., Churchill G.A., de Villena F.P. Subspecific origin and haplotype diversity in the laboratory mouse. Nat Genet. 2011;43:648–655. doi: 10.1038/ng.847. [DOI] [PMC free article] [PubMed] [Google Scholar]
- 41.Porges A.J., Redecha P.B., Kimberly W.T., Csernok E., Gross W.L., Kimberly R.P. Anti-neutrophil cytoplasmic antibodies engage and activate human neutrophils via Fc gamma RIIa. J Immunol. 1994;153:1271–1280. [PubMed] [Google Scholar]
- 42.Mulder A.H., Heeringa P., Brouwer E., Limburg P.C., Kallenberg C.G. Activation of granulocytes by anti-neutrophil cytoplasmic antibodies (ANCA): a Fc gamma RII-dependent process. Clin Exp Immunol. 1994;98:270–278. doi: 10.1111/j.1365-2249.1994.tb06137.x. [DOI] [PMC free article] [PubMed] [Google Scholar]
- 43.Reumaux D., Vossebeld P.J., Roos D., Verhoeven A.J. Effect of tumor necrosis factor-induced integrin activation on Fc gamma receptor II-mediated signal transduction: relevance for activation of neutrophils by anti-proteinase 3 or anti-myeloperoxidase antibodies. Blood. 1995;86:3189–3195. [PubMed] [Google Scholar]
- 44.Nolan S.L., Kalia N., Nash G.B., Kamel D., Heeringa P., Savage C.O. Mechanisms of ANCA-mediated leukocyte-endothelial cell interactions in vivo. J Am Soc Nephrol. 2008;19:973–984. doi: 10.1681/ASN.2007111166. [DOI] [PMC free article] [PubMed] [Google Scholar]
- 45.Kelley J.M., Monach P.A., Ji C., Zhou Y., Wu J., Tanaka S., Mahr A.D., Johnson S., McAlear C., Cuthbertson D., Carette S., Davis J.C., Jr., Dellaripa P.F., Hoffman G.S., Khalidi N., Langford C.A., Seo P., St Clair E.W., Specks U., Stone J.H., Spiera R.F., Ytterberg S.R., Merkel P.A., Edberg J.C., Kimberly R.P. IgA and IgG antineutrophil cytoplasmic antibody engagement of Fc receptor genetic variants influences granulomatosis with polyangiitis. Proc Natl Acad Sci U S A. 2011;108:20736–20741. doi: 10.1073/pnas.1109227109. [DOI] [PMC free article] [PubMed] [Google Scholar]
- 46.Edberg J.C., Wainstein E., Wu J., Csernok E., Sneller M.C., Hoffman G.S., Keystone E.C., Gross W.L., Kimberly R.P. Analysis of Fc gamma RII gene polymorphisms in Wegener’s granulomatosis. Exp Clin Immunogenet. 1997;14:183–195. [PubMed] [Google Scholar]
- 47.Nester C., Lionaki S., Hyunsook C., Edberg J., Kimberly R., Wilhelmsen K., Jennette J.C., Falk R. Polymorphisms aassociated with the pulmonary phenotype of antineutrophil cytoplasmic autoantibody vasculitis [Abstract] J Am Soc Nephrol. 2007;18:784A. [Google Scholar]
- 48.Yang J.J., Pendergraft W.F., Alcorta D.A., Nachman P.H., Hogan S.L., Thomas R., Sullivan P., Jennette J.C., Falk R.J., Preston G. Circumvention of normal constraints on granule protein gene expression in peripheral blood neutrophils and monocytes of patients with antineutrophil cytoplasmic autoantibody-associated glomerulonephritis. J Am Soc Nephrol. 2000;15:2103–2114. doi: 10.1097/01.ASN.0000135058.46193.72. [DOI] [PubMed] [Google Scholar]
- 49.Ohlsson S., Hellmark T., Pieters K., Sturfelt G., Wieslander J., Segelmark M. Increased monocyte transcription of the proteinase 3 gene in small vessel vasculitis. Clin Exp Immunol. 2005;141:174–182. doi: 10.1111/j.1365-2249.2005.02819.x. [DOI] [PMC free article] [PubMed] [Google Scholar]
- 50.Ciavatta D.J., Yang J., Preston G.A., Badhwar A.K., Xiao H., Hewins P., Nester C.M., Pendergraft W.F., 3rd, Magnuson T., Jennette J.C., Falk R.J. Epigenetic basis for aberrant upregulation of autoantigen genes in humans with ANCA vasculitis. J Clin Invest. 2010;120:3209–3219. doi: 10.1172/JCI40034. [DOI] [PMC free article] [PubMed] [Google Scholar]
- 51.Hamano Y., Tsukamoto K., Abe M., Sun G.D., Zhang D., Fujii H., Matsuoka S., Tanaka M., Ishida-Okawara A., Tachikawa H., Nishimura H., Tokunaka K., Hirose S., Suzuki K. Genetic dissection of vasculitis, myeloperoxidase-specific antineutrophil cytoplasmic autoantibody production, and related traits in spontaneous crescentic glomerulonephritis-forming/Kinjoh mice. J Immunol. 2006;176:3662–3673. doi: 10.4049/jimmunol.176.6.3662. [DOI] [PubMed] [Google Scholar]
- 52.Reynolds J., Cook P.R., Behmoaras J., Smith J., Bhangal G., Tadros S., Tee J., Salama A.D., Evans D.J., Aitman T.J., Cook H.T., Pusey C.D. Genetic susceptibility to experimental autoimmune glomerulonephritis in the Wistar Kyoto rat. Am J Pathol. 2012;180:1843–1851. doi: 10.1016/j.ajpath.2012.01.029. [DOI] [PMC free article] [PubMed] [Google Scholar]
- 53.Little M.A., Smyth L., Salama A.D., Mukherjee S., Smith J., Haskard D., Nourshargh S., Cook H.T., Pusey C.D. Experimental autoimmune vasculitis: an animal model of anti-neutrophil cytoplasmic autoantibody-associated systemic vasculitis. Am J Pathol. 2009;174:1212–1220. doi: 10.2353/ajpath.2009.080458. [DOI] [PMC free article] [PubMed] [Google Scholar]
Associated Data
This section collects any data citations, data availability statements, or supplementary materials included in this article.