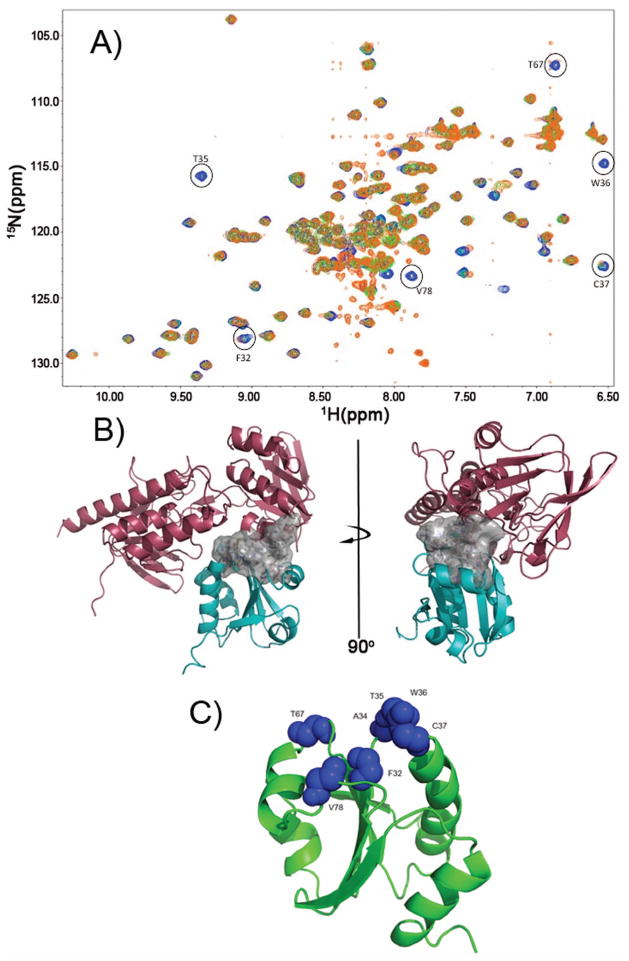
Figure 4.
Definition of the TrxR/TrxC interface using chemical shift perturbation studies. (a) Several HSQC spectra were overlaid, with blue crosspeaks corresponding to free reduced TrxC (in presence of 1 mM DTT). Green crosspeaks correspond to a ~1:1 complex between TrxC/TrxR at 250 μM (TrxC in slight excess over TrxR), with a fourfold excess of NADPH added. In cases where there was exchange broadening due to TrxR binding to TrxC, green peaks are no longer visible; so, the presence of blue identifies residues that are likely to be at the TrxC/TrxR interface. Orange crosspeaks correspond also to the complex between TrxC/TrxR at 250 μM, but now with a four-fold excess of NADP+ added in addition to 1 mM DTT. The exact match between green and orange crosspeaks suggests these two ternary complexes are similar, if not identical, and would correspond somewhat to intermediate F (but possibly with the mixed disulfide reduced) in Fig. 3. All spectra were acquired at pH 7.0. (b) Interface residues, which are largely hydrophobic, are shown as a surface rendering (white). This is the interface that forms when TrxR binds to and reduces an oxidized TrxC, and includes F142 and F143 on TrxR. (c) Residues on TrxC that show chemical shift perturbations or line broadening (from panel (a)) upon binding to TrxR have been mapped on the TrxC solution structure as blue Van der Waals spheres. These residues define the binding interface with TrxR (in panel (b)).

