

Abstract
Systems pharmacology approaches can be used to identify and predict drug-induced adverse events. Disease-centered networks within the human interactome allow us to predict which drugs may produce a similar pathophysiology. Such predictions can be tested in animal models.
Keywords: systems pharmacology, network biology, personalized medicine
Introduction
Current knowledge of cell biological processes indicates that many, if not most, pathways within mammalian cells are interconnected to form networks.1,2 This has led to a reevaluation of the reductionist view of drug actions, which assumes that a drug's therapeutic and adverse effects arise from the interaction with different proteins in separate pathways. It seems likely that both therapeutic and adverse effects of drugs may be dependent on effectors that are part of the same cellular networks that can also contain multiple targets for the drug (Fig. 1). The cell is now thought to be a complex network of interacting proteins, lipids, genes, and other cellular components. A drug's interaction with different components, most often proteins that have different positions and locations in the same overall cellular network, explains its final effects.3 Pathways for therapeutic and adverse effects may sometimes share some components and often intersect. Sometimes the therapeutic or adverse effects of the drug arise from the same pathway that is operative in different cell types.4 Currently, about 400–600 proteins of the presumed 100,000 functionally distinct proteins in the human interactome are targeted by about 1,200 FDA-approved drugs. This indicates there are likely to be a large number of potential drug targets that need to be identified.
Figure 1.
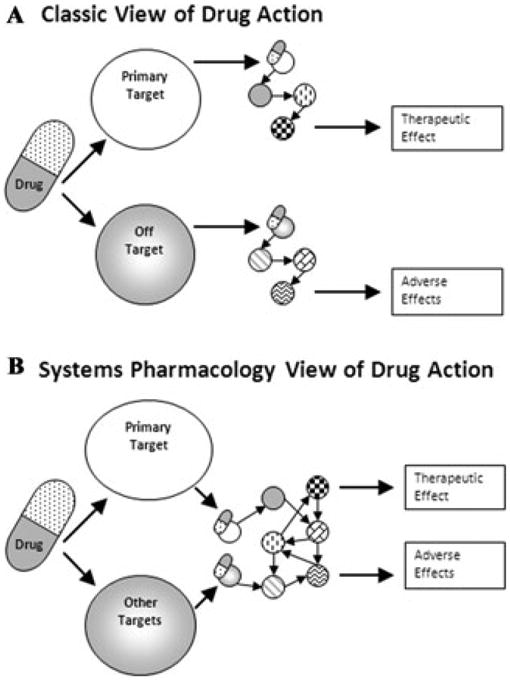
Multiple views of drug action. (A) In pharmacology, the classical view of drug action was that most often drugs had their side effects (adverse events) by interacting with off targets that are part of an effector pathway distinct from the one mediating the therapeutic effect. However, with our increased understanding of cellular regulatory networks (B), both the primary (intended) target and the other targets are part of cellular networks that control both therapeutic and adverse event effectors (reproduced with permission from Bioinformatics, Ref. 3).
Both therapeutic outcomes and adverse events induced by drugs show considerable variability between patients. Clinical experience with treatments for cancer, hypertension, stroke, and heart failure shows that treatment success and failure differs significantly between individuals. Sometimes this is based on specific mutations in the drug target as has been shown in lung cancer.5 However, most clinical practices are still based on empirical trial-and-error approaches that treat an average patient. The rapid progress in sequencing technologies promises to provide patient-specific information, such as genomic variations including single nucleotide polymorphisms (SNPs) and epigenomic changes. Incorporating such genomic information into the treatment decision-making process is a necessary step toward more personalized medicine. On the basis of the mutations in the individual patient's genome, a certain drug could be more or less suited to treat a disease successfully6 and have a higher or lower risk of an adverse side effect.7 But a simple empirically obtained statistical correlation between observed genotypes and drug action might not be sufficient to accurately predict a patient's drug response. The drug responses, both therapeutic and adverse, are likely to be affected by the topology of the cellular networks in the cell types in which the drug has its action; therefore, a more network-based systems biological approach is needed. In predicting adverse events, one useful approach is to understand the relationship of disease genes that cause the same pathophysiology and drugs' target genes within cell biological networks.
A common network of disease genes and drug targets in the long-QT syndrome
A well-characterized syndrome on the molecular level, the long-QT syndrome (LQTS), offered the opportunity to test whether a protein interaction network–based approach can be used to predict arrhythmic side effects of FDA approved drugs.7 LQTS, characterized by a prolonged QT-interval in the electrocardiogram, is a congenital or drug-induced change in electrical activity of the heart. The long QT-interval is associated with an increased risk of potentially fatal ventricular arrhythmias like Torsades de pointes (TdP) tachycardia. Twelve genes with known causative mutations for LQTS have been characterized, and most of them code for ion channels or proteins interacting with ion channels. One gene (ALG10) is annotated as possessing reduced susceptibility to LQTS.
We used disease-associated gene products as starting points (seed nodes) to identify a regulatory network within the human interactome. Such a disease-centric network can be hypothesized to regulate the ion channels involved in LQTS. To build the current version of the human interactome, we consolidated nine publicly available protein–protein interaction databases (Biogrid, HPRD, MINT, PDZbase, Reactome, DIP, Intact, Mips, and PhosphoELM) and used gene orthology (NCBI homologene and Jackson Labs) to merge nonhuman mammalian proteins and their human orthologs to generate a network of 12,372 nodes and 85,305 edges. Using the 13 known LQTS gene products as seed nodes, we identified a LQTS subnetwork (neighborhood) based on a mean first passage time (MFPT) algorithm. Starting with equal probability at any node in the network, the MFPT defines the average time a random walker needs to reach the node in question. Because equal distances between all the nodes are assumed, time is equal to the number of edges connecting the nodes. The algorithm calculates a module distance score for each protein of the protein–protein interaction network as the difference in average of the MFPTs to the node when starting on a nonseed node compared to starting on a seed node and normalized to the average MFPT when random nodes are chosen from all nodes reachable from the seed list. Any protein with a module distance score greater than zero implies that a node falls closer on average to the seed nodes than it does to the rest of the network, so we defined zero as the cutoff for a node belonging or not belonging to a “LQTS-neighborhood.” The resulting subnetwork comprised 1,629 nodes and 9,675 interactions. As a proof-of-principle, a “leave-one-out” cross-validation analysis was performed, that is, the score calculation was repeated after removing one of the seed nodes to determine the rank of the left out seed node. The left out seed nodes always achieved a positive score and were highly ranked. In eight cases where the excluded seed nodes directly interacted with another seed node, the node left out was ranked within the top 1% of the complete integrated mammalian protein–protein network, demonstrating the ability of this approach to accurately predict LQTS disease genes.
As a demonstration of the suitability of this network approach for the prediction and explanation of arrhythmic side effects of drugs, it could be shown that drugs causing LQTS or TdP tachycardia are enriched for protein targets in the LQTS neighborhood. Among 518 different proteins in the human interactome as targets of 951 FDA-approved drugs in DrugBank were 114 nodes targeted by 99 drugs listed on the Arizona CERT LQTS (AZCert QT) drug list. These 114 proteins were defined to be involved in QT-related side effects. Receiver operator characteristic (ROC) curves were used to determine if these 114 proteins ranked higher within the LQTS neighborhood than did the other drug target proteins that are not involved in QT-related side effects. For this purpose, the area under the curve (AUC) provides a simple measure. A random rank distribution will have an AUC of 0.5, the more QT-related drug targets are enriched in the LQTS neighborhood, the higher the AUC. This analysis gave an AUC of 0.67. Using the previously described nearest neighbor approach,8 the AUC was smaller (0.59). As further validation, random control networks were used as a classifier. The first one was based on 1,000 randomly generated seed lists containing 13 randomly chosen seed nodes from the global human interactome network, the second was based on 1,000 randomly generated seed lists containing 13 randomly chosen seed nodes with the same connectivity degree as the LQTS seed nodes, and the third was based on 2,500 randomly generated seed lists containing 13 seed nodes with the same distribution of gene ontology (GO) cellular component terms as those assigned to the LQTS seed list. The statistical significance of our 0.67 AUC was determined by counting the fraction of control neighborhoods, generated with the random seed lists, which had a higher AUC (P = 0.002 based on the GO-matched networks, which gave the next highest AUC-values). These results demonstrate that the LQTS neighborhood is selectively enriched for targets of drugs associated with LQTS.
The initial analysis was based on drugs documented to be associated with acquired LQTS or TdP as listed on the Arizona CERT LQTS. To go one step further, the FDR AERS database was used to investigate whether the LQTS neighborhood can predict a drug's basis for arrhythmic side effects. The AERS database contains reports of adverse events for patients and of all their medications at the time of the adverse event. We focused only on LQTS adverse events associated with monotherapies. Excluding the known QT-prolonging drugs, there were 654 drugs associated with monotherapy case reports, of which 363 had targets in the LQTS neighborhood. ROC analysis illustrates this enrichment with an AUC of 0.65 (P = 0.02 compared to GO-matched networks) (Fig. 2A). This enrichment indicates that we should consider subjecting drugs that have targets in this subnetwork to closer clinical investigation for a potential risk of causing LQTS. Among the unexpected predictions with QT event reports were oxcarbazepine, lamotrigine, loperamide, and dasatinib (Fig. 2B). To gain insight into the molecular pathways potentially explaining the arrhythmic side effects of these drugs the LQTR neighborhood can be used. For example, dasatinib, used to treat cancer, can be connected to the LQTR disease gene KCNQ1 through PRKACA, and SRC and loperamide used to treat severe diarrhea to KCNH2 through PRKACA and CALM 1(Fig. 2C). Thus, two drugs used to treat very different diseases, one (dasatinib) binding to its intended target, and the other (loperamide) binding to an unintended, can converge through network interactions on effector proteins that are part of the system that produces the same pathophysiology. These studies showed how systems level network analysis can be used to both understand and predict complex adverse events. The prediction of many new targets within the disease networks provides new hypotheses for determining the relationship between new drug targets and adverse events.
Figure 2.
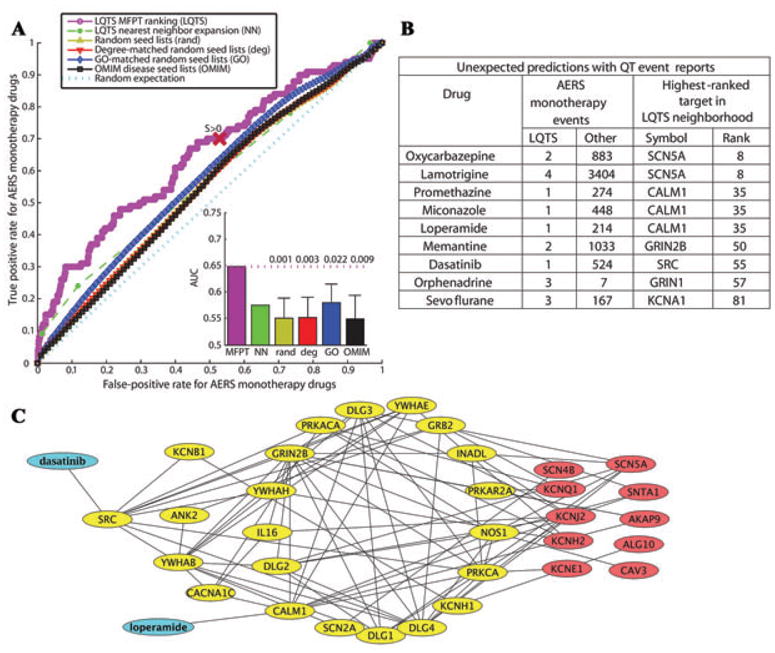
(A) ROC analysis shows that the LQTS neighborhood is more capable, as compared to random neighborhoods, to predict if a drug not previously reported to cause LQTS has the risk of the side effect. Inset shows the average AUC (area under the curve) of the random neighborhoods, and the P values show how often the AUCs of the random neighborhoods are above the AUC of the LQTS neighborhood. (B) Selected drugs not previously associated with side effect on QT interval, but with FDA AERS event reports. (C) The LQTS neighborhood subnetwork shows pathways connecting dasatinib's and loperamide's targets to LQTS disease genes (reproduced with permission from Science Signaling, Ref. 7).
Predicting mechanisms of drug–drug interactions
Network biology can also be used to predict and understand drug–drug interactions. In particular, we have been interested in understanding how drug combinations may mitigate adverse events caused by one of the drugs. For this, we analyzed the protein networks associated with the targets of rosiglitazone, an antidiabetic drug in the thiazolidinedione class of drugs, which are also called insulin sensitizers.9 They are thought to increase the cell's response to insulin by binding to the PPARγ receptors. Rosiglitazone usage causes serious adverse events and the drug has been withdrawn from the market. The FDA–AERS reports show rosiglitazone usage is associated with cerebrovascular adverse events, including myocardial infarction, congestive heart failure, cerebrovascular accidents, coronary artery disease, peripheral edema and myocardial ischemia. To build subnetworks associated with PPARγ and these side effects, we identified two sets of “terms of interest” related to cerebral vascular accidents in GO. The first set was used for fluid regulation, related to hypertensive stroke and consisted of the terms “multicellular organismal water homeostasis” and “water excretion.” The second set is related to ischemic or thrombotic stroke and used the term “regulation of blood coagulation.” For each set, a subnetwork connecting the proteins in each of these two sets with direct gene targets of PPARγ was generated. The fluid regulation network contained eight regulator proteins of the corresponding GO terms and the thrombosis network 18. Using FDA–AERS, we identified drugs that were used in combination with rosiglitazone more than 500 times and used a statistical test to identify drugs and their targets that increased or decreased the number of cerebrovascular events with rosiglitazone compared to rosiglitazone used alone or in combination with other drugs. Targets of the drugs that modified the rosiglitazone response were mapped onto both the “fluid regulation” and the “thrombosis” subnetworks. On the basis of these observations, we are developing algorithms to predict if two drugs affect the same pathway and whether they would potentiate their therapeutic or adverse effects. These predictions can be readily tested in animal models.
Perspective
Studies in our laboratory show that the human interactome is a useful base to predict drug targets and relationships for serious adverse events. Combining genes identified from genome-wide association studies with disease-centered subnetworks derived from the human interactome, we will develop the capability to predict distal relationships related to complex pathophysiologies. Because these predictions are based on network relationships between targets, drug–drug interactions for adverse events can also be predicted. These types of predictions can be used to generate hypotheses to create animal models with multiple gene knock-ins or knock-outs to study disease origins and progression, as well as to determine the therapeutic potential of targets of interest.
Acknowledgments
This work was supported by NIH Grants GM-54508 and 071558. Shan Zhao is supported by the NIGMS-funded Pharmacological Sciences Training Program T32-GM062754 and is a trainee in the NIGMS Medical Scientist Training Program.
Footnotes
Conflicts of interest: The authors declare no conflicts of interest.
References
- 1.Jordan JD, Landau EM, Iyengar R. Signaling networks: the origins of cellular multitasking. Cell. 2000;103:193–200. doi: 10.1016/s0092-8674(00)00112-4. [DOI] [PMC free article] [PubMed] [Google Scholar]
- 2.Ma'ayan A, Blitzer RD, Iyengar R. Toward predictive models of mammalian cells. Annu Rev Biophys Biomol Struct. 2005;34:319–349. doi: 10.1146/annurev.biophys.34.040204.144415. [DOI] [PMC free article] [PubMed] [Google Scholar]
- 3.Berger SI, Iyengar R. Network analyses in systems pharmacology. Bioinformatics. 2009;25:2466–2472. doi: 10.1093/bioinformatics/btp465. [DOI] [PMC free article] [PubMed] [Google Scholar]
- 4.Ma'ayan A, Jenkins SL, Goldfarb J, Iyengar R. Network analysis of FDA approved drugs and their targets. Mt Sinai J Med. 2007;74:27–32. doi: 10.1002/msj.20002. [DOI] [PMC free article] [PubMed] [Google Scholar]
- 5.Riely GJ, Politi KA, Miller VA, Pao W. Update on epidermal growth factor receptor mutations in non-small cell lung cancer. Clin Cancer Res. 2006;12:7232–7241. doi: 10.1158/1078-0432.CCR-06-0658. [DOI] [PubMed] [Google Scholar]
- 6.Evans WE, McLeod HL. Pharmacogenomics—drug disposition, drug targets, and side effects. N Engl J Med. 2003;348:538–549. doi: 10.1056/NEJMra020526. [DOI] [PubMed] [Google Scholar]
- 7.Berger SI, Ma'ayan A, Iyengar R. Systems pharmacology of arrhythmias. Sci Signal. 2010;3:8. doi: 10.1126/scisignal.2000723. [DOI] [PMC free article] [PubMed] [Google Scholar]
- 8.Chen JY, Shen C, Sivachenko AY. Mining Alzheimer disease relevant proteins from integrated protein interactome data. Pac Symp Biocomput. 2006;111:367–378. [PubMed] [Google Scholar]
- 9.Kaplan F, Al-Majali K, Betteridge DJ. PPARS, insulin resistance and type 2 diabetes. J Cardiovasc Risk. 2001;8:211–217. doi: 10.1177/174182670100800405. [DOI] [PubMed] [Google Scholar]