

Abstract
Background
Intra-individual variability in reaction times (RT variability) has garnered increasing interest as an indicator of cognitive and neurobiological dysfunction in children with Attention Deficit Hyperactivity Disorder (ADHD). Recent theory and research has emphasized specific low-frequency patterns of RT variability. However, whether group differences are specific to low frequencies is not well-examined.
Method
Two studies are presented. The first is a quantitative review of seven previously published studies that have examined patterns of RT variability in ADHD. The second provides new data from a substantially larger sample of children than in prior studies (NControl=42; NADHD=123). The children completed a choice RT task as part of a traditional go/stop task. Fast-Fourier transform analyses were applied to assess patterns of variability.
Results
Quantitative review of previous studies indicated that children with ADHD demonstrate more low-frequency variability than non-ADHD controls (Hedge’s g=.39; 95% CI: .16–.62) but an equivalent excess variability in a faster-frequency comparison band (g=.36; 95% CI: .03–.69), with a trivial and non-significant difference between ESs in each band. New data replicated results of the quantitative review with nearly identical effects in the low-frequency (g=.39; 95% CI: .05–.75) and faster-frequency comparison bands (g=.40; 95% CI: .04–.74) and no evidence of diagnosis × frequency interaction (p=.954).
Conclusions
Results suggest that theories of RT variability in ADHD that focus on low-frequency variability will need to be modified to account for the presence of variability at a broader range of frequencies.
Keywords: ADHD, intra-individual variability, reaction time variability, default network
Excess intra-individual variability in reaction times (hereafter: RT variability) is a prominent feature of cognitive performance for children with Attention Deficit Hyperactivity Disorder (ADHD), as well as other disorders. Effect sizes (ESs) seem large (Willcutt, Doyle, Nigg, Faraone, & Pennington, 2005) and neurobiological theories have emerged. RT variability may reflect integrity of key brain networks, pre-frontal cortex functioning, white matter integrity, and/or efficiency of dopamine neuromodulation (for review see MacDonald, Li, & Bäckman, 2009). The most well-developed neurobiological account in ADHD is the default-mode interference hypothesis, which suggests that RT variability reflects difficulty suppressing activity in neural networks typically associated with rest (Castellanos, Kelly, & Milham, 2009; Sonuga-Barke & Castellanos, 2007). The “default” network seems to show coherent oscillation at low frequencies (i.e. those <0.1 Hz, but strongest at <0.08 Hz, Cordes et al., 2001), which are roughly similar to the low-frequency patterns studied in ADHD RT variability data. This theory therefore proposes that low-frequency patterns (i.e. <0.10 Hz) will uniquely account for RT variability in ADHD. However, this prediction remains largely untested.
Consensus is lacking as to defining frequency bands in the RT data. Approaches have included: 1) features of the task employed (Johnson et al., 2008; Johnson et al., 2007a; Johnson et al., 2007b); 2) theory about physiologically important frequency divisions (Di Martino et al., 2008; Vaurio, Simmonds, & Mostofsky, 2009); or 3) data-driven approaches based on where variability best differentiates groups (Castellanos et al., 2005; Helps, Broyd, Bitsakou, & Sonuga-Barke, 2011). Figure 1 provides a visual depiction of the frequency bands under discussion, as well as the frequencies examined in prior studies. Early work using a data-driven approach identified group differences in a band centered around 0.05 Hz, which corresponds to a cycle about once every 20 seconds (Castellanos, et al., 2005, study not shown in Figure 1 because no comparison band was used). Studies using theoretically-driven frequency bands have found group differences in a range from 0.027–0.073 Hz (or every 13–37 seconds), called the “Slow-4” band (see Figure 1). Studies using task-driven approaches have similarly identified differences at frequencies less than 0.077 Hz. All of the definitions of “low” frequency have thereby emphasized the frequencies below 0.08 Hz.
Figure 1.
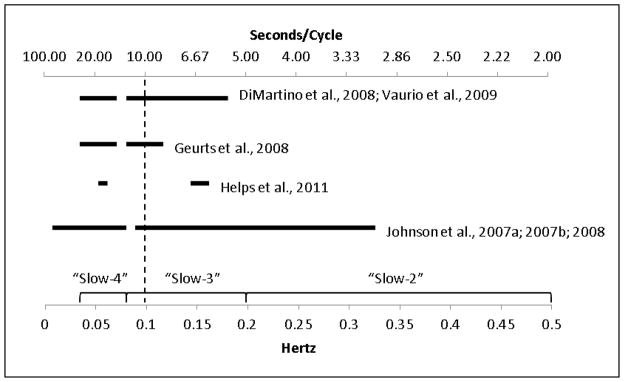
shows the “low” and comparison frequency bands used in studies of RT variability in ADHD. The ranges of the physiological “Slow-4,” “Slow-3,” and “Slow-2” bands are indicated along the bottom axis. Frequencies to the left of the dotted line (i.e. <0.10 Hz) are associated with default network activation. Slow-4 most clearly overlaps with default network activation, while task design has often precluded ADHD-control comparisons at frequencies in the Slow-2 range.
However, some studies also report ADHD-control group differences in faster frequencies using each of the preceding methods for defining bands (Helps, et al., 2011; Johnson, et al., 2008; Johnson, et al., 2007b; Vaurio, et al., 2009, all depicted on Figure 1 as well), suggesting that children with ADHD are more variable at a range of frequencies. These results seem to suggest a lack of specificity that would fail to support the basic hypothesis of frequency-domain-specific alterations in ADHD RT variability. However, the diagnosis × frequency interaction effect required to determine the relative strength of group differences was reported in only one study (the interaction was not significant, but the study’s power was low, Geurts et al., 2008). Thus, the relative strength of ADHD-related group differences at different frequencies is unclear.
Summary and Hypotheses
The characterization of intra-individual variability in ADHD is important to mechanistic theories of the disorder. Theories linking RT variability to possible underlying neural mechanisms have emphasized specific low-frequency patterns of variability. The current paper reports two studies that assess support for the low-frequency hypothesis. In Study 1, we conduct a quantitative review of published research that applied frequency-domain analyses to RT data to evaluate the pooled ESs for group differences in different frequency bands, including one in the range <0.08 Hz. Building on those results, in Study 2 we examine patterns of variability in a new sample of children with and without ADHD to evaluate replication of the quantitative review results.
Study 1: Quantitative Review
Method
Literature searches were conducted in PsychInfo and PubMed databases using combinations of the terms ADHD, RT variability, frequency domain, low frequency, and default-mode. Reference sections of identified papers were searched to identify other studies. To be included, studies were required to report data comparing children with ADHD to non-ADHD controls at two frequencies: (a) the low frequencies thought to be most strongly associated with the default-mode network and (b) at least one comparison band. Seven published studies (Ncontrol=313, NADHD=325) met inclusion criteria. (A list of included studies can be found in Table 1.) The first study in this domain, and one that helped launch this line of investigation (Castellanos, et al., 2005), reported results only for the low-frequency band and so was omitted from the pooled effect estimation (results did not differ materially when the study was included).
Table 1.
Quantitative Review of Studies for Study 1
| Study | Task Type(s) | Band (Hz) | NControl | NADHD (#H, #I, #C) | % Male | Age (years) | IQ | ES (g) | 95% CI |
|---|---|---|---|---|---|---|---|---|---|
|
| |||||||||
| Control/ADHD | |||||||||
| DiMartino et al., 2008 | Erikson Flanker | 26 | 29 (1, 16, 12) | 46/81 | 11.6/12.5 | 116/106 | |||
| Low frequency | 0.027–0.073 | 0.69 | 0.15–1.23 | ||||||
| Comparison frequency | 0.73–0.17 | 0.08 | −0.44–0.60 | ||||||
| Geurts et al., 2008 | Simple Forced-Choice RT | 85 | 53 (3, 16, 34) | 76/86 | 9.2/9.1 | 111/100 | |||
| Low frequency | 0.03–0.08 | 0.0 | −0.34–0.34 | ||||||
| Comparison frequency | 0.08–0.13 | 0.0 | −0.34–0.34 | ||||||
| Helps et al., 2011 | Simple Forced-Choice RT | 50 | 64 (0, 0, 64) | 66/84 | 12.2/12.1 | 101/93 | |||
| Low Frequency | 0.06–0.07 | 0.68 | 0.31–1.05 | ||||||
| Comparison frequency | 0.14–0.16 | 0.68 | 0.31–0.75 | ||||||
| Johnson et al, 2007a | Fixed-sequence SART | 29 | 63 (5, 6, 52) | 97/84 | 11.4/11.3 | 97/95 | |||
| Low frequency | 0.01–0.077 | 0.27 | −0.16–0.71 | ||||||
| Comparison frequency | 0.077–0.34 | 0.41 | −0.03–0.85 | ||||||
| Johnson et al., 2007b | Fixed-sequence SART Random-sequence SART |
18 | 23 (0, 1, 22) | 83/87 | 11.1/10.5 | 107/99 | |||
| Low frequency | 0.01–0.077 | 0.84 | 0.21–1.47 | ||||||
| Comparison frequency | 0.077–0.34 | 0.84 | 0.21–1.47 | ||||||
| Johnson et al., 2008 | Fixed-sequence SART | 22 | 31 (1, 7, 23) | 77/84 | 8.7/9.0 | 108/93 | |||
| Low frequency | 0.01–0.077 | 0.36 | 0.40–1.53 | ||||||
| Comparison frequency | 0.077–0.34 | 0.96 | −0.18–0.91 | ||||||
| Vaurio et al., 2009 | Simple Go/No-go Complex Go/No-go |
83 | 57 (0, 20, 37) | 48/60 | 11.0/10.9 | 116/111 | |||
| Low frequency | 0.027–0.074 | 0.22 | −0.12–0.56 | ||||||
| Comparison frequency | 0.074–0.202 | −0.19 | −0.54–0.14 | ||||||
| Pooled ES for previously published data | 313 | 325 | |||||||
| Low frequency | 0.39 | 0.16–0.62 | |||||||
| Comparison frequency | 0.36 | 0.03–0.69 | |||||||
For studies that included more than one task (Johnson, et al., 2007b; Vaurio, et al., 2009), results were pooled across tasks using a fixed effect model. Only data comparing ADHD to typically-developing children were included here. In studies for which multiple faster-frequency comparison bands were reported (Geurts, et al., 2008; Helps, et al., 2011), the band immediately faster than the low-frequency band was chosen because this resulted in the most similar comparison bands across studies. However, because of the data reported in Geurts et al. (2008), identical ES estimates would have been included regardless of band chosen, and so the selection of bands only affected one study. As noted, although synchronized activity in the default network may be strongest at frequencies <0.08 Hz, it is often characterized as extending up to 0.10 Hz. Only two studies reported data for a comparison frequency band that excluded all variability <0.10 Hz (Geurts, et al., 2008; Helps, et al., 2011) and so effects at frequencies above and below 0.10 Hz could not be strictly separated. However, in all studies, the faster-frequency comparison bands extended well into frequencies above those most commonly associated with default-mode activation.
A random effects model was used to compute pooled ESs for each frequency band across studies. The bias corrected ES Hedges’ g is reported (interpreted similarly to the familiar Cohen’s d). Calculations were completed using the software Comprehensive Meta-Analysis (Biostat Inc, Englewood, NJ). ES heterogeneity is described using the Q statistic, which provides a statistical test to determine whether heterogeneity is present, and the I2 statistic, which quantifies the amount of unexplained between-study variance (Huedo-Medina, Sanchez-Meca, Marin-Martinez, & Botella, 2006). A limited sensitivity analysis was conducted via a leave-one study-out procedure, in which ESs were recalculated with each study in turn removed. Additional sensitivity analyses, including file drawer effects, were omitted in interest of brevity.
Results
The studies included in the quantitative analysis are summarized in Table 1. The pooled ES for low-frequency variability was g=.39 (SE=.12; 95% Confidence Interval [CI]: .16–.62; p=.002), indicating a significant group difference with a small ES. The Q statistic indicated marginally significant between-study heterogeneity (Q=11.6, p=.072, I2=48.16). Leave-one-out sensitivity analyses indicated the effect was not driven by any single outlier study (with each study in turn removed, g ranged from .32 to .44, all p<.01). Further efforts to reduce heterogeneity were not pursued.
The pooled ES for the faster-frequency comparison band was nearly identical, with g=.36 (SE=.12; 95% CI: .03–.69; p=.033), a reliable, small ES. There was significant heterogeneity in the ESs between studies (Q=24.35, p=<.001, I2=75.36). Leave-one-out sensitivity analyses indicated that the effect remained significant regardless of which study was dropped (g ranged from .28 to .44, all p<.01). Further efforts to reduce heterogeneity were not pursued.
Although comparison across frequency bands is likely to underestimate differences due to a violation of independence, the pooled between-group effects at the two frequencies were nearly identical (g=.39 versus g=.36, with SE=.12 for each; Q=.02, p=.889). The leave-one-out-sensitivity analyses indicated that regardless of which study was dropped from the calculations, in no case did the ES for the low-frequency band differ from the ES for the comparison band by more than one standard error.
Brief Comment on Study 1
Children with ADHD differ from non-ADHD controls to a similar extent in both low-frequency patterns of activation (<0.08 Hz) and in a faster-frequency comparison band that extends from ~0.08 Hz to 0.33 Hz), failing to support the hypothesis that ADHD RT variability is driven by specific low-frequency patterns.
A caveat is that large I2 values for both the low- and comparison-frequency pooled ESs indicate substantial remaining unexplained non-random variance in the size of effects between studies. The few extant studies differ in several ways that could prove important over time, such as the type of task used, task difficulty, and frequency bands studied. Although no single study was driving the results, the small number of published studies precludes full evaluation of potential moderators. Given that we could not fully account for the unexplained variance between studies, there remains some question about the reliability of the population ES.
Therefore, we sought to confirm the results of the quantitative review in a new sample of children with ADHD that was nearly double the size of the largest previous sample, and with ample power to detect relevant interaction effects. We expected to find group differences with similar ESs in variability in multiple frequency bands. Further, we predicted that the 95% CI around the low-frequency ES in our sample would include .39 and that the 95% CI for the comparison band would include .36.
Study 2: New Data on Frequency Patterns of RT Variability in ADHD
Method
Participants and Diagnostic Assessment
Two hundred and eighteen children (NControl=48; NADHD=170) between the ages of 8 and 17 were recruited using a community-based recruitment strategy including public advertising and outreach. A parent or legal guardian provided written informed consent for each child. After an initial screening phone call, diagnoses were established via a multi-gate process. A parent/guardian and teacher completed standardized rating scales, including Child Behavior Checklist/Teacher Report Form (CBCL/TRF, Achenbach & Rescorla, 1991), Conners’ Rating Scales-Revised (CRS-R, Conners, 2003), and the ADHD Rating Scale (ADHD-RS, DuPaul, Power, Anastopoulos, & Reid, 1998). The parent/guardian also completed a semi-structured clinical interview administered by a Master’s-level clinician who had achieved research reliability (Kiddie Schedule for Affective Disorders and Schizophrenia, K-SADS, Kaufman et al., 1997). Child IQ was estimated based on a reliable and valid three-subtest short form of the WISC-IV (Vocabulary, Block Design, and Information, Wechsler, 2003). Final diagnosis was made by a clinical team that included board certified child psychiatrist and licensed clinical psychologist. Agreement ratings for ADHD diagnosis and subtype were acceptable (all kappa >.89 for all disorders with >5% base rate in the sample).
Children were excluded if they: were prescribed long-acting psychotropic medications; had neurological impairment/seizures, head injury with loss of consciousness, other major medical conditions, or substance abuse; had prior diagnosis of mental retardation, autism spectrum disorder, or psychosis; were currently experiencing a major depressive episode; or had estimated IQ <70. Children with ADHD prescribed stimulant medications (n=44) were required to be off medication for 24 to 48 hours prior to testing. Children with ADHD who were prescribed stimulant medications did not significantly differ from unmedicated ADHD children on any of the experimental outcome measures (go trial accuracy, mean RT, standard deviation of RT [SDRT], frequency patterns of variability, all p >.27). Further, neither covarying for stimulant medication use nor excluding children prescribed stimulant medications changed the effects reported below, and so children prescribed medication were retained for all analyses to maximize sample representativeness and maintain consistency with the methods in nearly all prior studies.
ADHD Subtypes
The ADHD group included children who met criteria for the DSM-IV combined subtype (n=64) as well as the DSM-IV primarily inattentive subtype (n=59). ADHD DSM-IV subtypes did not significantly differ on any of the experimental outcome measures (go trial accuracy, mean RT, SDRT), frequency patterns of variability, all p >.418), and so the ADHD groups were collapsed for comparison with non-ADHD controls in all analyses.
Assessment of RT Variability
For the evaluation of RT variability, we used data from a tracking version of the dual-task “Stopping Task” (described in detail in Logan, 1994; Nigg, 1999). This task embeds a choice RT task (go trials) and a stop task (stop trials). For each trial, a central fixation point appeared for 500 ms. An “X” or an “O” then appeared for 1000 ms. On 75% of trials (“go” trials), children were asked to indicate with a key press whether an “X” or an “O” had appeared. Children were given a total of 2000 ms to respond after which the next trial automatically commenced. On 25% of trials (“stop” trials), an auditory tone indicated that the child should not respond. After 32 practice trials, children completed 4 blocks of 64 experimental trials (only trials from the experimental blocks were included in analyses). For the current analyses, which were intended to characterize variability in the “go” process, all stop trials were interpolated as described below.
Data quality exclusions
Consistent with previous RT variability studies, children who had fewer than 80% correct hits were excluded from the final analyses because it could not be determined if they were adequately engaged with the task and because use of their RT series would have required interpolation of too many missing data points, leaving a final sample of Ncontrol=42 and NADHD=123. Excluded children in the control group were more variable than included children. In the ADHD group, excluded children were younger and had faster and more variable RTs. To evaluate whether results were affected by the exclusion of these children using the 80% rule, analyses were repeated using accuracy cut-offs of 75%, 70%, 65%, 60%, as well as including all children regardless of accuracy. The least rigorous accuracy criteria of 60% resulted in exclusion of only 2.1% of the control sample and 4.7% of the ADHD sample. In all cases, the ESs and p values for the between-group differences were similar to those obtained using the 80% accuracy cutoff. In addition, group effects were re-computed after deleting data for those below 80% accuracy and using a full information maximum likelihood model to handle the “missing” data in the full contingent of 218 children. Results were essentially identical to those reported below. For simplicity, then, results reported are using the 80% accuracy cutoff to maintain maximum comparability to current practices in the literature.
Statistical Analyses
Data Preparation
RTs (on correct trials) were submitted to fast-Fourier transform analyses after data processing that included: 1) log transformation to minimize effects of outliers; 2) replacing omissions and stop trials via mean of adjacent RTs; and 3) normalization (dividing by the SD of the series) to obtain frequency measurements independent of inter-individual differences in RT variability. The inter-stimulus interval of 2.5 seconds and block length of 160 seconds allowed examination of frequencies from 0.006–0.2 Hertz. For the primary analysis, the power spectrum was divided into two frequency bands: 0.027–0.073 Hz and 0.073–0.17. Frequencies were chosen to correspond to the physiologically meaningful Slow-4 (0.027–0.073) and Slow-3 (0.073–0.17) bands as described by Penttonen and Buzsaki (2003). The Slow-4 (low) frequency band corresponded to oscillations occurring between 13–37 seconds, theoretically reflecting activity in resting-state networks. The Slow-3 (comparison) band corresponded to oscillations occurring between 5–13 seconds, and provided a comparison band to test the specificity of low-frequency patterns. Estimates of power in both frequency bands were standardized to account for inequality of variances between the two variables and to provide centering for tests of interaction (Quinn & Keough, 2002). Group codes were also centered (at −1 and +1). (Note that standardizing necessarily eliminates any main effect of frequency, which was not of interest here.)
Data Analysis
ADHD and control groups differed in estimated IQ, gender, and proportion of children diagnosed with Oppositional Defiant Disorder (ODD; see Table 2). Covarying for characteristics that differ between groups but are representative of the underlying populations can violate statistical assumptions and result in comparison at levels of the covariate that do not exist in the underlying population (Dennis et al., 2009). Nonetheless, to be consistent with much of the previous literature, we initially included these along with age (which differed with marginal significance between-groups) as covariates when comparing groups on experimental measures. None of the covariates were significant and results were essentially the same as when covariates were omitted, thus results are reported without covariates.
Table 2.
Participant Demographic Information for Study 2
| Variable | Control (n=42) | ADHD (n=123) | F (1,163) | ES (d) |
|---|---|---|---|---|
| Gender (Male:Female) | 20:22 | 85:38 | χ2(1)=6.25* | |
| Race (% identifying as not White/Caucasian) | 27.6 | 16.7 | χ2(1)=2.02 | |
| Anxiety Disorder (% of sample) | 19 | 23.6 | χ2(1)=0.40 | |
| Oppositional Defiant Disorder (% of sample) | 2.4 | 30.1 | χ2(1)=15.01*** | |
| Conduct Disorder (% of sample) | 0 | 1 | χ2(1)=1.40 | |
| Annual Family Income ($) | $79,935 | $70,078 | 1.75 | 0.24 |
| Age (in years) | 10.3 (2.0) | 11.0 (2.3) | 3.09+ | 0.28 |
| Estimated IQ | 110.7 (14.4) | 104.7 (14.8) | 5.15* | 0.36 |
| Conners’ Cognitive Problems (T-score) | 48.8 (8.8) | 71.3 (10.3) | 160.71*** | 1.98 |
| Conners’ Hyperactivity (T-Score) | 50.7 (11.5) | 63.7 (14.6) | 29.39*** | 0.85 |
Note. Data reported as mean (SD). The Anxiety Disorder category included children who met criteria for any one of: Generalized Anxiety Disorder, Specific Phobia, Social Anxiety Disorder, or Obsessive Compulsive Disorder.
=p<.001,
=p<.05,
=p<.08
Within-subject differences in the frequency bands and the interaction of diagnosis x frequency were then compared using repeated-measures ANOVA. Power analyses with G*Power3 (Erdfelder, Faul, & Buchner, 1996) taking into account both the final sample size and the correlation between measures, indicated that the repeated-measures ANOVA had adequate power (power >.80) to detect small interaction effects (d >.20). We reasoned that interactions smaller than that would be of limited theoretical interest and that power was sufficient for the study aims.
Results
Sample Characteristics
Table 2 provides a summary of group demographic and clinical characteristics. Clinical scores were consistent with validity of the diagnostic group assignments. Between-group differences on mean RT and RT variability are reported in Table 2 for descriptive purposes.
Frequency Bands Analysis
When comparing children with ADHD to non-ADHD controls on each frequency band separately, children with ADHD had more power in both the low frequency band (F[1,163]=4.83, p=.029, d=.39, 95% CI: .05–.75) and faster-frequency comparison band (F[1,163]=5.02, p=.026, d=.40, 95% CI: .04–.74). Consistent with the similar ESs for the between-group comparisons, 2(Frequency) × 2(Group) repeated-measures ANOVA indicated that the diagnosis × frequency interaction was trivial (F[1,163]=.003, p=.954).
Consistent with the results of the quantitative review, the 95% CI for the low-frequency band included .39, and 95% CI for the faster-frequency comparison band included .36. These results again failed to reject the null hypothesis that ADHD is associated with excess RT variability at a much broader range of frequencies than typically associated with “low” frequency variability or default-mode activation.
Sensitivity Analysis
To address concerns that results were an artifact of where we set our frequency bands, further sensitivity tests were conducted. The power spectrum was divided into seven equally-sized bands between 0.025–0.20 Hz. The 95% CIs for the between-group ESs all overlapped, suggesting no difference in the size of the effects. In addition, using repeated-measures ANOVA the linear diagnosis × frequency interaction effect was not significant (p=.592), indicating no change in ESs across bands (shown in Figure 2).
Figure 2.

shows the ADHD-control between-group ES (d) at each of seven equally-sized bands. There was no significant decrease in ES between low- and faster-frequency bands as indicated by the flat regression slope.
Composite Quantitative Summary
To provide an overall summary, we pooled our data with Study 1 data and re-computed the pooled ESs. The pooled ES for the low-frequency between-group difference remained unchanged with a slightly narrower CI, g= .39 (SE=.10; 95% CI=.19–.58). There was no significant heterogeneity across studies (Q=11.6, p=.114, I2=39.67). The pooled effect for the faster-frequency comparison band also remained unchanged with a narrower CI, g=.36 (SE=.14; 95% CI=.08–.64). Heterogeneity remained significant for the comparison band (Q=24.8, p=.001, I2=71.72). The ES estimates were not significantly different from each other. Leave-one-out sensitivity analyses indicated that results did not change regardless of which study was dropped from the calculation of ESs.
Brief Comment on Study 2
Children with ADHD demonstrated greater variability than non-ADHD controls in both the low-frequency band and a faster-frequency band. The diagnosis × frequency interaction effect was essentially zero. Estimates of ESs in both frequency bands were nearly identical to one another and to the ESs suggested by Study 1’s review, thus the Study 2 results replicated the Study 1 findings nearly perfectly.
General Discussion
RT variability is an important phenomenon to be understood as part of ADHD. A key question has been whether it can be decomposed into a specific effect at low frequencies (typically having been defined in the RT data as frequencies <0.08 Hz or variability in the Slow-4 band). The current results provide strong evidence from two studies (a mini-meta-analysis and a new, large-sample study) that RT variability in ADHD extends beyond the Slow-4 band to include at least the Slow-3 band. The high degree of similarity of the effect in these two bands was striking, suggesting no drop off in the ADHD effect as analysis moves from Slow-4 to Slow-3. It was also striking that in Study 2, where we introduced the largest single sample yet to look at ADHD frequency band variability, we observed a virtual point-replication of the ES from the quantitative review, providing some confidence in the conclusion that these two bands yield similar ADHD variability effects.
The finding of group differences across multiple frequency bands suggests that comprehensive theories linking variability to underlying cognitive dysfunction need to account for a broader range of patterns of variability than previously assumed. In particular, the default-mode interference hypothesis, one theory put forward to explain RT variability in relation to neural oscillations, suggests that low-frequency oscillations (<0.10 Hz) consistent with those that characterize activity in the default network should be the primary feature of RT variability. The present results do not support that supposition and indeed, provide rather compelling evidence that it is wrong.
Results suggest that RT variability in ADHD cannot be easily interpreted as reflecting patterns of neural activation based in current understanding of default-mode activation. However, in their review of the EEG literature, Banaschewski and Brandeis (2007) highlighted that clinical disorders are often characterized by alterations in multiple frequency bands, and it is quite possible that a neural oscillation account could be expanded to accommodate the wider range of RT frequency differences seen here. For example, an inability to suppress activity in the default network has been linked to dopaminergic functioning (Brown et al., 2011; Tomasi et al., 2009). However, in addition to its role in suppression of resting-state activity, dopamine is also critical to many aspects of information processing, such as creating and maintaining mental representations and maintaining an optimal signal-to-noise ratio on a trial-by-trial basis (Gamo & Arnsten, 2011; Li, Lindenberger, & Sikström, 2001; MacDonald, et al., 2009). Thus, abnormalities in dopaminergic function could contribute to RT variability in multiple frequency bands.
In addition, it may be incorrect that default-mode activation is limited to frequencies <0.10 Hz. After correcting for frequency patterns associated with the time course of the hemodynamic response, the default network may be equally active at frequencies as fast as 0.15 Hz (Cole, Smith, & Beckmann, 2010). Even if default network oscillations extend into faster frequencies than previously thought, sensitivity analyses in Study 2 did not detect a drop in ES at any point in the spectrum. Thus, at least in the behavioral data, ADHD does not appear to be characterized by a specific low-frequency pattern either <0.10 or 0.15 Hz.
The range of frequencies in which RT variability can be assessed is limited both by the task length (which limits the slowest frequency that can be examined) and the inter-stimulus interval (which limits the highest frequency that can be examined). Tasks requiring less complicated response decisions and therefore short inter-stimulus intervals have enabled comparisons at frequencies as high as 0.33 Hz. However, in that study it was actually at the high frequencies that the largest ADHD-related group differences were identified (Helps et al., 2011). In the current Study 2 we were able to examine frequencies up to 0.2 Hz. Sensitivity analyses in Study 2 were not able to identify any drop off or increase in the ADHD effect as we moved up the frequency range. However, our task precluded looking at frequencies as high as those identified by Helps et al. (2011).
While ES estimates from the summary that pools our new results with our Study 1 data indicate tolerable levels of between-study variability in the size of the low-frequency effect, the summary continues to shows substantial unexplained variability in the effect for the comparison band. This draws into question the reliability of the population ES estimate for these faster frequencies. As previously described, the studies differ in ways that could not be modeled; it remains possible that a specific low-frequency effect does occur on some tasks. Replicated evidence of such an effect would be of interest. For example, meta-analysis suggests that RT variability is more prominent on tasks with high working memory load (Martinussen, Hayden, Hogg-Johnson, & Tannock, 2005), and the ESs for the study with possibly the highest working memory load (Di Martino, et al., 2008) did demonstrate qualitatively larger difference in the low- than the fast-frequency band; however, sample size was small and confidence intervals considerably overlap, so the interaction effect would be non-significant. In general, more focused examination of task differences may be helpful in future studies.
Additionally, all studies examining frequency patterns to-date have relied on inhibition or forced-choice paradigms that require interpolation of error trials and missing data points. Post-error slowing, which may differ between ADHD and non-ADHD groups, is well-documented (Schachar et al., 2004; Verbruggen, Logan, Liefooghe, & Vandierendonck, 2008). It is unclear how interpolation of missing values using surrounding data points, particularly surrounding errors, affects frequency patterns or whether these effects differ by group. One limitation of frequency-domain approaches in general is that they do not directly take into account error rates. Future work applying other neurally-plausible RT models that directly take into account response accuracy may be informative (Bogacz, Wagenmakers, Forstmann, & Nieuwenhuis, 2009).
Finally, each of the studies included in the quantitative review required children with ADHD stop stimulant medication treatment 24–48 hours prior to testing, which is standard practice in the ADHD literature. Withdrawal effects on these tasks at that time interval are considered to be unlikely. However, the possible cognitive effects of long-term stimulant use that may persist even after medication washout remain poorly understood. There is conflicting evidence both within and between studies as to whether long-term stimulant treatment has lasting effects on cognitive task performance or patterns of brain activation (Konrad, Neufang, Fink, & Herpertz-Dahlmann, 2007; Pliszka et al., 2006; Rubia, Smith, Brammer, Toone, & Taylor, 2005; Semrud-Clikeman, Pliszka, & Liotti, 2008). In Study 2, children on washout and unmedicated children with ADHD did not differ on any of the experimental measures (including comparison at different frequency bands). This finding argues against withdrawal or long-term medication effects; however, data do not speak fully to the issue of long-term effects because children were not randomly assigned to medication treatment and the length of treatment they received was not able to be directly considered. Characterizing the long-term cognitive effects of stimulant treatment remains needed in relation to these measures.
Conclusion
A quantitative summary of existing literature and new data analysis in a large sample indicated that RT variability in ADHD is not characterized by a specific low frequency pattern, and that the ESs for frequency patterns of RT variability in ADHD are in the small range (.36–.39). One conclusion might be that RT variability in ADHD should not be interpreted in terms of specific frequency patterns, but rather using other methods. If future studies on RT variability patterns in ADHD are pursued, researchers will need to carefully consider task design, report interaction effects between task types (i.e., significant task differences in group effect size), and consider how the selection of frequency bands affects the specificity of group differences. For now, the most parsimonious conclusion is that RT variability in ADHD extends through the Slow-4 and Slow-3 bands (from ~0.03 to 0.2 Hz and probably higher) and that RT variability in ADHD is not specific to low frequencies (<0.10 Hz or < 0.15 Hz). Interpretations of RT variability related to neuroscience models will need to be modified or expanded to account for this lack of specificity to low frequency bands.
Table 3.
Experimental Task Results for Study 2
| Experimental Measure | Control (n=42) | ADHD (n=123) | F (1,164) | ES (d) |
|---|---|---|---|---|
| Accuracy (%) | 92.1 (0.05) | 90.0 (0.05) | 8.55** | 0.46 |
| MRT (ms) | 546.53 (57.71) | 532.89 (50.36) | 1.68 | 0.20 |
| SDRT (ms) | 194.43 (49.86) | 206.84 (41.36) | 3.75+ | 0.31 |
| Slow-3 Power (ms2) | 434.44 (197.59) | 535.66 (268.85) | 5.02** | 0.40 |
| Slow-4 Power (ms2) | 900.93 (548.13) | 1150.68 (662.52) | 4.83** | 0.39 |
Note. Data reported as mean (SD); Accuracy, Mean Reaction Time of Hits (MRT) and Standard Deviation of MRT (SDRT) compared using between-groups ANCOVA with age as a covariate; Slow-3 and Slow-4 Power obtained through fast-Fourier transform analyses with group comparison using between-groups ANOVA.
=p<.01,
=p<.05,
=p<.08
Key Points.
Children with ADHD demonstrate more RT variability than same-age peers.
RT variability in ADHD is not characterized by a specific low-frequency pattern. Group differences extend through the Slow-4 and Slow-3 bands (from ~0.03 to 0.2 Hz and probably higher).
Interpretations of RT variability related to neuroscience models may need to be expanded to account for this lack of specificity.
Future studies on RT variability patterns should consider task design, interaction effects, and how the selection of frequency bands affects the specificity of group differences.
Acknowledgments
Funding support for this project was provided by grant number MH059105 (PI: J.T. Nigg) from the National Institute of Mental Health. The authors have no conflicts of interest to declare.
Footnotes
Conflict of Interest Statement: No conflicts declared.
References
- Achenbach TM, Rescorla LA. Manual for the aseba school-age forms & profiles. Burlington, VT: Research Center for Children, Youth, & Families; 1991. [Google Scholar]
- Banaschewski T, Brandeis D. Annotation: What electrical brain activity tells us about brain function that other techniques cannot tell us-- a child psychiatric perspective. Journal of Child Psychology and Psychiatry. 2007;48(5):415–435. doi: 10.1111/j.1469-7610.2006.01681.x. [DOI] [PubMed] [Google Scholar]
- Bogacz R, Wagenmakers EJ, Forstmann B, Nieuwenhuis S. The neural basis of the speed-accuracy tradeoff. Trends in Neurosciences. 2009;33(1):10. doi: 10.1016/j.tins.2009.09.002. [DOI] [PubMed] [Google Scholar]
- Brown AB, Biederman J, Valera E, Makris N, Doyle A, Whitfield-Gabrieli S, et al. Relationship of dat1 and adult adhd to task-positive and task-negative working memory networks. Psychiatry Research: Neuroimaging. 2011;193(1):7–16. doi: 10.1016/j.pscychresns.2011.01.006. [DOI] [PMC free article] [PubMed] [Google Scholar]
- Castellanos FX, Kelly C, Milham MP. The restless brain: Attention-deficit hyperactivity disorder, resting-state functional connectivity, and intrasubject variability. Canadian Journal of Psychiatry-Revue Canadienne De Psychiatrie. 2009;54(10):665–672. doi: 10.1177/070674370905401003. [DOI] [PMC free article] [PubMed] [Google Scholar]
- Castellanos FX, Sonuga-Barke EJS, Scheres A, Di Martino A, Hyde C, Walters JR. Varieties of attention-deficit/hyperactivity disorder-related intra-individual variability. Biological Psychiatry. 2005;57(11):1416–1423. doi: 10.1016/j.biopsych.2004.12.005. [DOI] [PMC free article] [PubMed] [Google Scholar]
- Cole DM, Smith SM, Beckmann CF. Advances and pitfalls in the analysis and interpretation of resting-state fmri data. Frontiers in Systems Neuroscience. 2010;4(8):1–15. doi: 10.3389/fnsys.2010.00008. [DOI] [PMC free article] [PubMed] [Google Scholar]
- Conners CK. Conners’ rating scales: Revised technical manual. New York, NY: Multi-Health Systems; 2003. [Google Scholar]
- Cordes D, Haughton VM, Arfanakis K, Carew JD, Turski PA, Moritz CH, et al. Frequencies contributing to functional connectivity in the cerebral cortex in ‘resting-state’ data. American Journal of Neuroradiology. 2001;22:1326–1333. [PMC free article] [PubMed] [Google Scholar]
- Dennis M, Francis DJ, Cirino PT, Schachar R, Barnes MA, Fletcher JM. Why iq is not a covariate in cognitive studies of neurodevelopmental disorders. Journal of the International Neuropsychological Society. 2009;15(3):331–343. doi: 10.1017/S1355617709090481. [DOI] [PMC free article] [PubMed] [Google Scholar]
- Di Martino A, Ghaffari M, Curchack J, Reiss P, Hyde C, Vannucci M, et al. Decomposing intra-subject variability in children with attention-deficit/hyperactivity disorder. Biological Psychiatry. 2008;64(7):607–614. doi: 10.1016/j.biopsych.2008.03.008. [DOI] [PMC free article] [PubMed] [Google Scholar]
- DuPaul G, Power T, Anastopoulos A, Reid R. Adhd rating scale—iv: Checklists, norms, and clinical interpretation. NY, NY: Guilford Press; 1998. [Google Scholar]
- Erdfelder E, Faul F, Buchner A. Gpower: A general power analysis program. Behavior Research Methods, Instruments & Computers. 1996;28(1):1–11. [Google Scholar]
- Gamo NJ, Arnsten AFT. Molecular modulation of prefrontal cortex: Rational development of treatments for psychiatric disorders. Behavioral Neuroscience. 2011;125(3):282–296. doi: 10.1037/a0023165. [DOI] [PMC free article] [PubMed] [Google Scholar]
- Geurts HM, Grasman RPPP, Verté S, Oosterlaan J, Roeyers H, van Kammen SM, et al. Intra-individual variability in adhd, autism spectrum disorders and tourette’s syndrome. Neuropsychologia. 2008;46(13):3030–3041. doi: 10.1016/j.neuropsychologia.2008.06.013. [DOI] [PubMed] [Google Scholar]
- Helps SK, Broyd SJ, Bitsakou P, Sonuga-Barke EJS. Identifying a distinctive familial frequency band in reaction time fluctuations in adhd. Neuropsychology. 2011;25(6):711–719. doi: 10.1037/a0024479. [DOI] [PubMed] [Google Scholar]
- Huedo-Medina T, Sanchez-Meca J, Marin-Martinez F, Botella J. Assessing heterogeneity in meta-analysis: Qstatistic or i2 index? CHIP Documents, Paper. 2006;19 doi: 10.1037/1082-989X.11.2.193. http://digitalcommons.uconn.edu/chip_docs/19. [DOI] [PubMed] [Google Scholar]
- Johnson KA, Barry E, Bellgrove MA, Cox M, Kelly SP, Dáibhis A, et al. Dissociation in response to methylphenidate on response variability in a group of medication naïve children with adhd. Neuropsychologia. 2008;46(5):1532–1541. doi: 10.1016/j.neuropsychologia.2008.01.002. [DOI] [PubMed] [Google Scholar]
- Johnson KA, Kelly SP, Bellgrove MA, Barry E, Cox M, Gill M, et al. Response variability in attention deficit hyperactivity disorder: Evidence for neuropsychological heterogeneity. Neuropsychologia. 2007a;45(4):630–638. doi: 10.1016/j.neuropsychologia.2006.03.034. [DOI] [PubMed] [Google Scholar]
- Johnson KA, Robertson IH, Kelly SP, Silk TJ, Barry E, Dáibhis A, et al. Dissociation in performance of children with adhd and high-functioning autism on a task of sustained attention. Neuropsychologia. 2007b;45(10):2234–2245. doi: 10.1016/j.neuropsychologia.2007.02.019. [DOI] [PMC free article] [PubMed] [Google Scholar]
- Kaufman J, Birmaher B, Brent D, Rao U, Flynn C, Moreci P, et al. Schedule for affective disorders and schizophrenia for school-age children–present and lifetime version (k-sads-pl): Initial reliability and validity. Pittsburgh: Department of Psychiatry, University of Pittsburgh School of Medicine; 1997. [DOI] [PubMed] [Google Scholar]
- Konrad K, Neufang S, Fink GR, Herpertz-Dahlmann B. Long-term effects of methylphenidate on neural networks associated with executive attention in children with adhd: Results from a longitudinal functional mri study. Journal of the American Academy of Child and Adolescent Psychiatry. 2007;46(12):1633–1641. doi: 10.1097/chi.0b013e318157cb3b. [DOI] [PubMed] [Google Scholar]
- Li SC, Lindenberger U, Sikström S. Aging cognition: From neuromodulation to representation. Trends in Cognitive Sciences. 2001;5(11):479–486. doi: 10.1016/s1364-6613(00)01769-1. [DOI] [PubMed] [Google Scholar]
- Logan G. On the ability to inhibit thought and action: A users’ guide to the stop signal paradigm. In: Dagenbach D, Carr TH, editors. Inhibitory processes in attention, memory, and language. San Diego, CA: Academic Press; 1994. pp. 189–239. [Google Scholar]
- MacDonald SWS, Li SC, Bäckman L. Neural underpinnings of within-person variability in cognitive functioning. Psychology and Aging. 2009;24(4):792–808. doi: 10.1037/a0017798. [DOI] [PubMed] [Google Scholar]
- Martinussen R, Hayden J, Hogg-Johnson S, Tannock R. A meta-analysis of working memory impairments in children with attention-deficit/hyperactivity disorder. Journal of the American Academy of Child & Adolescent Psychiatry. 2005;44(4):377–384. doi: 10.1097/01.chi.0000153228.72591.73. [DOI] [PubMed] [Google Scholar]
- Nigg JT. The adhd response-inhibition deficit as measured by the stop task: Replication with dsm-iv combined type, extension, and qualification. Journal of Abnormal Child Psychology. 1999;27(5):393–402. doi: 10.1023/a:1021980002473. [DOI] [PubMed] [Google Scholar]
- Penttonen M, Buzsaki G. Natural logarithmic relationship between brain oscillators. Thalamus & Related Systems. 2003;2:145–152. [Google Scholar]
- Pliszka SR, Glahn DC, Semrud-Clikeman M, Franklin C, Perez R, Xiong J, et al. Neuroimaging of inhibitory control areas in children with attention deficit hyperactivity disorder who were treatment naive or in long-term treatment. American Journal of Psychiatry. 2006;163:1052–1060. doi: 10.1176/ajp.2006.163.6.1052. [DOI] [PubMed] [Google Scholar]
- Rubia K, Smith AB, Brammer MJ, Toone B, Taylor E. Abnormal brain activation during inhibition and error detection in medication-naive adolescents with adhd. American Journal of Psychiatry. 2005;162:1067–1075. doi: 10.1176/appi.ajp.162.6.1067. [DOI] [PubMed] [Google Scholar]
- Schachar R, Chen S, Logan G, Ornstein TJ, Crosbie J, Ickowicz A, et al. Evidence for an error monitoring deficit in attention deficit hyperactivity disorder. Journal of Abnormal Child Psychology. 2004;32(3):285–293. doi: 10.1023/b:jacp.0000026142.11217.f2. [DOI] [PubMed] [Google Scholar]
- Semrud-Clikeman M, Pliszka S, Liotti M. Executive functioning in children with attention-deficit/hyperactivity disorder: Combined type with and without a stimulant medication history. Neuropsychology. 2008;22(3):329–340. doi: 10.1037/0894-4105.22.3.329. [DOI] [PubMed] [Google Scholar]
- Sonuga-Barke E, Castellanos FX. Spontaneous attentional fluctuations in impaired states and pathological conditions: A neurobiological hypothesis. Neuroscience & Biobehavioral Reviews. 2007;31(7):977–986. doi: 10.1016/j.neubiorev.2007.02.005. [DOI] [PubMed] [Google Scholar]
- Tomasi D, Volkow ND, Wang R, Telang F, Wang GJ, Chang L, et al. Dopamine transporters in striatum correlate with deactivation in the default mode network during visuospatial attention. PloS One. 2009;4(6):e6102. doi: 10.1371/journal.pone.0006102. [DOI] [PMC free article] [PubMed] [Google Scholar]
- Vaurio RG, Simmonds DJ, Mostofsky SH. Increased intra-individual reaction time variability in attention-deficit/hyperactivity disorder across response inhibition tasks with different cognitive demands. Neuropsychologia. 2009;47(12):2389–2396. doi: 10.1016/j.neuropsychologia.2009.01.022. [DOI] [PMC free article] [PubMed] [Google Scholar]
- Verbruggen F, Logan G, Liefooghe B, Vandierendonck A. Short-term aftereffects of response inhibition: Repetition priming or between-trial control adjustments. Journal of Experimental Psychology of Human Performance. 2008;34(2):413–426. doi: 10.1037/0096-1523.34.2.413. [DOI] [PubMed] [Google Scholar]
- Wechsler D. Wechsler intelligence scale for children, 4th ed (wisc-iv) technical and interpretive manual. San Antonio: Harcourt Brace; 2003. [Google Scholar]
- Willcutt EG, Doyle A, Nigg JT, Faraone SV, Pennington BF. Validity of the executive function theory of attention-deficit/hyperactivity disorder: A meta-analytic review. Biological Psychiatry. 2005;57(11):1336–1346. doi: 10.1016/j.biopsych.2005.02.006. [DOI] [PubMed] [Google Scholar]