

Abstract
Purpose
Poor sleep and heavy use of caffeinated beverages have been implicated as risk factors for a number of adverse health outcomes. Caffeine consumption and use of other stimulants are common among college students globally. However, to our knowledge, no studies have examined the influence of caffeinated beverages on sleep quality of college students in Southeast Asian populations. We conducted this study to evaluate the patterns of sleep quality; and to examine the extent to which poor sleep quality is associated with consumption of energy drinks, caffeinated beverages and other stimulants among 2,854 Thai college students.
Methods
A questionnaire was administered to ascertain demographic and behavioral characteristics. The Pittsburgh Sleep Quality Index (PSQI) was used to assess sleep habits and quality. Chi-square tests and multivariate logistic regression models were used to identify statistically significant associations.
Results
Overall, the prevalence of poor sleep quality was found to be 48.1%. A significant percent of students used stimulant beverages (58.0%). Stimulant use (OR 1.50; 95%CI 1.28-1.77) was found to be statistically significant and positively associated with poor sleep quality. Alcohol consumption (OR 3.10; 95% CI 1.72-5.59) and cigarette smoking (OR 1.43; 95% CI 1.02-1.98) also had statistically significant association with increased daytime dysfunction. In conclusion, stimulant use is common among Thai college students and is associated with several indices of poor sleep quality.
Conclusion
Our findings underscore the need to educate students on the importance of sleep and the influences of dietary and lifestyle choices on their sleep quality and overall health.
Keywords: Sleep, Energy Drinks, Alcohol, Caffeine, Students, Cigarettes
Introduction
Sleep is physiologically essential for maintaining overall well-being [1]. Sleep research has led to the discovery of a plethora of adverse health conditions associated with poor sleep. The immediate effects of sleep problems—decreases in the ability to perform tasks, daytime sleepiness, and fatigue—are commonly recognized and experienced [2]. Additionally, poor sleep has been shown to be associated with serious cardiometabolic and psychiatric conditions including type 2 diabetes, hypertension, obesity, as well as higher frequencies of depression, anxiety, eating disorders, and dementia [2-5].
Measures of poor sleep in the literature include both indices of sleep duration and sleep quality. Though both are found to be important to subjective well-being, health and wellness indices are found to be better correlated to sleep quality which encompasses measures of depth of sleep, how the individual feels upon waking, and general satisfaction with sleep [6]. Patterns and disparities in sleep quality have been found to vary by race, ethnicity, gender, and age [7, 8].
Up to this point, however, not much epidemiological data on the sleep patterns and sleep quality of older adolescents/young adults can be found in the literature and data are particularly limited for college students [9]. Moreover, available studies on sleep patterns and quality of college students are not representative of all nationalities and ethnicities; most examine Western populations with the U.S. being most represented. It is important that researchers contribute to knowledge in this area as this is the age interval when sleep patterns change due to biological factors such as changes in circadian timing, behavioral factors such as changes in social and educational demands, and dietary modifications such as changes in the pattern of consumption of caffeinated beverages [10].
Energy drinks, especially, are targeted to young adult consumers [11]. According to a self-report survey, energy drinks are consumed by 30 - 50 % of young adults and adolescents in the United States [12]. Another survey of US college students found that 51% of those surveyed regularly consumed more than one energy drink per month, and the majority of students reported regular consumption of energy drinks several times per week [11]. Surveyed college students reported using energy drinks for insufficient sleep, when energy was needed in general, when studying for an exam or completing a major course project, and to mix with alcohol for partying [11].
Moderate caffeine consumption is associated with common symptoms including jitteriness and anxiety. On the other hand high-dose caffeine use is associated with insomnia, palpitations and arrhythmias, seizures, and stroke [12]. In Germany, Ireland, and New Zealand, where energy drink-related toxicity incidents are kept on record, cases of liver damage, kidney failure, heart failure, and death have been found to be associated with energy drink consumption [12]. The most common adverse effects implicated in caffeine use in adults are chest discomfort, heart rhythm irregularities, increased blood pressure, electrolyte disturbances, nausea and vomiting, and anxiety [13]. In children, caffeine consumption was found to increase blood pressure and complaints of sleep disturbances [13] whilst energy drink consumption may lead to increased body mass index (BMI), diabetes, and the incidence of dental caries [12].
Currently, few studies have examined sleep patterns and quality in Asian populations [14-17]. Moreover, to the best of our knowledge, very few studies have examined the influence of caffeinated beverages on the sleep quality and sleep patterns of college students [18, 19]. As Thailand leads the world in the consumption of energy drinks per person [20], it is a fitting setting to examine such an association. The present study aims to augment the understanding of sleep among Thai college students by evaluating reports of sleep hygiene and sleep quality in relation to stimulant use and other behavioral risk factors. Given prior studies [21, 22] we hypothesized that those students who use stimulants were more likely than non-users to report poor sleep quality and that this relationship may vary by sex and age.
METHODS
Study Setting and Sample
This cross-sectional study was conducted between December 2010 and February 2011 at seven colleges (Chulalongkorn University, Thammasat University, Dhurakij Pundit University, Rangsit University, Kasetsart University, University of the Thai Chamber of Commerce, and Walailak University) in Thailand; 56.3% of our data were collected from Chulalongkorn University and Walailak University. Chulalongkorn University in Thailand has more than eighteen faculties and a number of schools and institutes. Currently, the University has more than 36,000 full time students. Walailak University, which is located in Nakhon Si Thammarat Province in Southern Thailand. It has more than 3,500 undergraduate students.
Recruitment
Flyers were posted in each campus to invite participants to the study. Students who expressed an interest in participating were asked to meet in a large classroom or an auditorium where they were informed about the purpose of the study. Students consenting to participate were asked to complete a self-administered individual survey. Vision impaired students and those who could not read the consent and questionnaire forms were not eligible to participate. Those enrolled in correspondence, extension, or night school programs were not included as well since their experience might be different from regular time students. A total of 3,000 undergraduate students participated in the study. For the analysis described here, we excluded subjects with incomplete questionnaires and missing sleep quality scores (n=146). The final analyzed sample included 2,854 students (930 male and 1,924 female). All the completed questionnaires were anonymous, and no personal identifiers were collected. All study procedures were approved by the institutional review boards of the Faculty of Medicine Chulalongkorn University, Walailak University and the University of Washington, USA. The Harvard School of Public Health Office of Human Research Administration, USA, granted approval to use the de-identified data set for analysis.
Data Collection and Variables
Demographics
A self-administered questionnaire was used to collect information for this study. The questionnaire ascertained demographic information including age, sex, and education level. Questions also included regarding behavioral risk factors such as smoking, energy drinks, caffeinated beverages, physical activity, and alcohol consumption. Measurements of the student’s height, weight, waist, and hip circumference were also collected by research nurses after the questionnaire was administered.
Use of energy or stimulant beverages
Energy drinks are a group of beverages used to provide an extra boost in energy, promote wakefulness, and provide cognitive and mood enhancement[23]. They are often referred as stimulant beverages. Hence in this study, we will be using the terms energy drinks and stimulant beverages interchangeably. Participants were first asked if they consumed more than one stimulant or energy drink per week during the current academic semester/quarter. Those who responded affirmatively were further asked to identify the specific type of energy drinks. To provide a frame of reference regarding what constituted an energy drink, we included examples of energy drinks that were popular on the campus and in social establishments in the immediate geographic region where the survey was administered. These included international and local brands such as: Red Bull, M100, M150, Carabao Daeng, Lipovitan-D or Lipo, Wrangyer, and Sharks. For the purpose of this analysis we grouped the less commonly used (i.e., Carabao Daeng, Lipovitan-D or Lipo, Wrangyer, and Shark) energy drinks together and hereinafter refer to this group as “other energy drinks.” Consumption of caffeine-containing beverages included coffee, black tea, and stimulant beverages [colas such as Coke and Pepsi were each categorized as dichotomous variables (no vs. yes)]. Participants were also asked to specify whether they consumed sugar-containing and/or sugar-free caffeinated beverages. We then summed each of the drinks to estimate the number different types of energy drinks or stimulants used per week.
Pittsburgh Sleep Quality Index (PSQI)
Sleep quality was assessed using the previously validated Pittsburgh Sleep Quality Index (PSQI) [24]. The PSQI instrument has been widely used among college students globally including Southeast Asia [16]. The PSQI is a 19-item self-reported questionnaire that evaluates sleep quality within the past month. The PSQI consists of seven sleep components related to sleep habits including duration of sleep, sleep disturbance, sleep latency, habitual sleep efficiency, use of sleep medicine, daytime dysfunction and overall sleep quality. The sleep components yield a score ranging from 0 to 3, with three indicating the greatest dysfunction [24]. The sleep component scores are summed to yield a total score ranging from 0 to 21 with higher total scores (referred to as global scores) indicating poor sleep quality. Based on prior literature [24], participants with a global score of greater than 5 were classified as poor sleepers. Those with a score of 5 or less were classified as good sleepers.
For sleep quality component subscales, namely subjective sleep efficiency, sleep latency, sleep medication use, and daytime dysfunction due to sleepiness, we computed dichotomous variables of optimal and suboptimal sleep quality. Specific categories were long sleep latency (≥30 minutes vs. < 30 minutes), poor sleep efficiency (<85% vs. ≥85%), daytime dysfunction due to sleep (< once a week vs. ≥ once per week), and use of sleep medication during the past month (< once per week vs. ≥ once per week). Sleep duration was assessed using the PSQI questionnaire that queried participants about how many hours of actual sleep the participants got at night during the previous month. Given the lack of prior data on cutoffs for defining “short sleep duration” among college students, we used quartiles. The following quartiles were used to define sleep duration: ≤6.0 hours, 6.1-7.0 hours, 7.1-8.0 hours, and ≥ 8.1 hours. The group with the lowest quartile of sleep duration (≤6 hours) was classified as short duration sleepers.
Other Covariates
We defined alcohol consumption as low (< 1 alcoholic beverage a week), moderate (1 19 alcoholic beverages a week), and high to excessive consumption (> 19 alcoholic beverages a week) [25, 26]. Other covariates were categorized as follows: age (years), sex, cigarette smoking history (never, former, current), and participation in moderate or vigorous physical activity (no vs. yes), BMI was calculated as weight (kg)/height squared (m2). BMI thresholds were set according to the World Health Organization (WHO) protocol (underweight: <18.5 kg/m2; normal: 18.5–24.9 kg/m2; overweight: 25.0–29.9 kg/ m2; and obese ≥30 kg/m2)[27].
Data Analysis
We first examined frequency distributions of socio-demographic and behavioral characteristics of study participants. Characteristics were summarized using means (± standard deviation) for continuous variables and counts and percentages for categorical variables. Chi-square test and Student’s t-test were used to determine bivariate differences for categorical and continuous variables, respectively. Next, we calculated the distribution of poor sleep quality across demographic and behavioral groups. The distributions of PSQI scores among male and female students, as well as the sex-specific prevalence of poor sleep quality across age groups were also estimated. To examine the association between sleep quality and energy drinks, we compared the distribution of overall poor sleep quality according to any energy drink use and specific type studied. Prevalence estimates were also determined for suboptimal dichotomous sleep quality subscales in relation to consumption of stimulant drinks and other lifestyle characteristics. Forward logistic regression modeling procedures combined with the change-in-estimate approach were used to calculate odds ratios (OR) and 95% confidence intervals (95% CI) for the associations between poor sleep quality and socio-demographic and behavioral factors [28]. Variables of a priori interest (e.g., age and sex) were forced into final models. All analyses were performed using IBM’s SPSS Statistical Software for Windows (IBM SPSS Version 20, Chicago, Illinois, USA). All reported p-values are two-sided and deemed statistically significant at α=0.05.
RESULTS
Of the 2,854 college students who completed the survey and met participant guidelines, 67.4% were females and the average reported age was 20.3 (±1.3) years. Overall, a total of 1,373 (48.1%) students had poor sleep quality (PSQI > 5). The mean PSQI total score across all participants was 5.76 ± 2.50 (5.80±2.49 for females and 5.67±2.52 for males). The distributions of PSQI scores for males and females were similar (Fig. 1).
Figure 1.
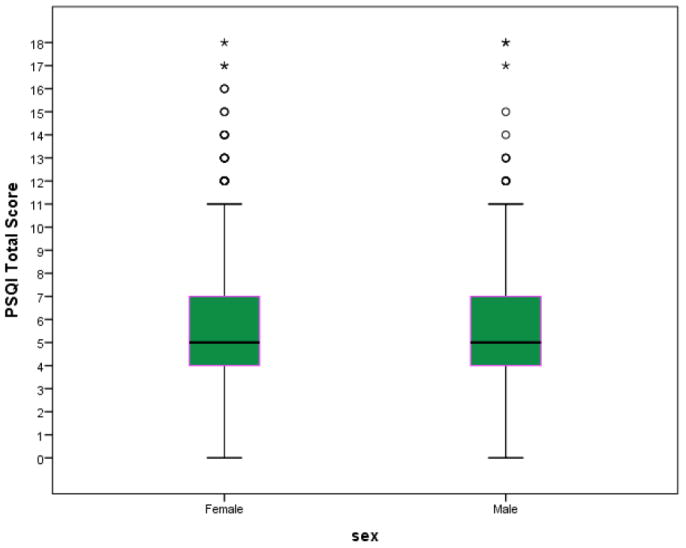
Distributions of Pittsburgh Sleep Quality Scores by Sex
The behavioral and demographic characteristics of the study samples in relation to sleep quality are reported in Table 1. A total of 34.1% of the students reported consuming at least 1 alcoholic drink per month whilst current smoking was reported by approximately 7% of participants. More than two-thirds (68.6%) of participants were found to be of normal BMI (18.5–24.9), 71.2% were of normal health, and 77.9% were physically active. Overall there were no statistically significant associations between sleep quality and demographic or lifestyle characteristics, except for alcohol consumption. Those who reported consuming at least 1 alcoholic drink per month were more likely to report poor sleep quality than non-drinkers (p-value= 0.02).
Table 1.
Characteristics of study sample
| Characteristic | All N=2,854 | Poor Sleep Quality N=1,373 | Good Sleep Quality N=1,481 | P-value |
|---|---|---|---|---|
|
| ||||
| n (%) | n (%) | n (%) | ||
| Age (Mean± SD) | 20.3±1.3 | 20.4± 1.3 | 20.3 ±1.3 | 0.242 |
| Age (years) | ||||
| 18 | 153 (5.4) | 66 (4.8) | 87 (5.9) | 0.49 |
| 19 | 663 (23.5) | 307 (22.4) | 356 (24.0) | |
| 20 | 823 (28.8) | 403 (29.3) | 420 (28.4) | |
| 21 | 669 (24.5) | 351 (25.6) | 348 (23.5) | |
| 22 and older | 516 (18.2) | 246 (17.9) | 270 (18.2) | |
| Sex | ||||
| Male | 930 (32.6) | 435 (31.7) | 495 (33.4) | 0.321 |
| Female | 1,924 (67.4) | 938 (68.3) | 986 (66.6) | |
| Cigarette smoking status | ||||
| Never | 2,603 (91.2) | 1,237 (90.1) | 1,366 (92.2) | 0.131 |
| Former | 55 (1.9) | 30 (2.2) | 25 (1.7) | |
| Current | 196 (6.9) | 106 (7.7) | 90 (6.1) | |
| Alcohol consumption | ||||
| <1 drink/month | 1879 (65.8) | 877 (63.9) | 1002 (67.7) | 0.02 |
| 1-19 drinks/month | 928 (32.5) | 466 (33.9) | 462 (31.2) | |
| ≥ 20 drinks/month | 47 (1.6) | 30 (2.2) | 17 (1.1) | |
| Body mass index (kg/m2) | ||||
| Underweight (<18.5) | 476(16.7) | 241 (17.5) | 235 (15.9) | 0.082 |
| Normal (18.5–24.9) | 1,957(68.6) | 947 (69.0) | 1010 (68.2) | |
| Overweight (25.0–29.9) | 288 (10.1) | 119 (8.7) | 169 (11.4) | |
| Obese (≥30.0) | 133(4.6) | 66 (4.8) | 67 (4.5) | |
| Any physical activity | ||||
| No | 629 (22.1) | 300 (22.0) | 329 (22.3) | 0.848 |
| Yes | 2,215 (77.9) | 1,066 (78.0) | 1,149 (77.7) | |
Table 2 shows the distribution of PSQI sleep components subscales across male and female students. Notably, 38.9% of our study samples reported sleeping ≤ 6 hours per day. Approximately 26% of the study samples reported longer sleep latency (≥ 30 minutes), and 25.3% reported having daytime dysfunction due sleepiness at least once per week. A total of 25.1% were classified as having poor sleep efficiency (< 85%), and 2.0% reported using sleep medicine at least once per week. There were no significant associations between any of the sleep components reported in Table 2 and sex, though slightly more females reported having poor sleep as compared to males (48.7% compared to 46.8% respectively), and females were more likely to report daytime dysfunction due to sleepiness (17.5% of males reported never having daytime dysfunction due to sleepiness compared to 14.5% of females). The prevalence of poor sleep quality in relation to age and sex is illustrated in Figure 2. The highest prevalence of poor sleep was reported by 21-year old males and females ≥ 22 year of age.
Table 2.
Pittsburgh Sleep Quality Index components by sex
| Characteristic | All N=2,854 | Female N=1,924 | Male N=930 | P-value |
|---|---|---|---|---|
|
| ||||
| n (%) | n (%) | n (%) | ||
| Sleep duration (hours) | ||||
| ≤6.0 | 1,111 (38.9) | 742 (38.6) | 369 (39.7) | 0.775 |
| 6.1-7.0 | 828 (29.0) | 568 (29.5) | 260 (27.9) | |
| 7.1-8.0 | 596 (20.9) | 396 (20.6) | 200 (21.5) | |
| ≥ 8.1 | 319 (11.2) | 218 (11.3) | 101 (10.9) | |
| Sleep latency (minutes) | ||||
| ≤ 15 | 525 (18.4) | 332 (17.3) | 193 (20.7) | 0.108 |
| 16-30 | 1,576 (55.2) | 1,078 (56.0) | 498 (53.6) | |
| 31-60 | 617 (21.6) | 426 (22.1) | 191 (20.5) | |
| ≥ 60 | 136 (4.8) | 88 (4.6) | 48 (5.2) | |
| Day dysfunction due to sleep | ||||
| Never | 442 (15.5) | 279 (14.5) | 163 (17.5) | 0.116 |
| < once a week | 1,688 (59.2) | 1,152 (59.9) | 536 (57.6) | |
| 1-2 times per week | 609 (21.3) | 409 (21.3) | 200 (21.5) | |
| ≥ 3 times per week | 115 (4.0) | 84 (4.3) | 31 (3.4) | |
| Sleep efficiency (%) | ||||
| ≥ 85 | 2,134 (74.9) | 1,431 (74.4) | 703 (75.6) | 0.696 |
| 75-84 | 425 (14.8) | 297 (15.4) | 128 (13.8) | |
| 65-74 | 168 (5.9) | 112 (5.8) | 56 (6.0) | |
| < 65 | 127 (4.4) | 84 (4.4) | 43 (4.6) | |
| Sleep medicine during past month | ||||
| Never | 2,680 (93.8) | 1,806 (93.8) | 874 (94.0) | 0.614 |
| < once a week | 118 (4.1) | 83 (4.3) | 35 (3.8) | |
| 1-2 times per week | 39 (1.4) | 23 (1.2) | 16 (1.7) | |
| ≥ 3 times per week | 17 (0.6) | 12 (0.6) | 5 (0.5) | |
| Sleep Quality | ||||
| Good | 1,481 (51.9) | 986 (51.3) | 495 (53.2) | 0.321 |
| Poor | 1,373 (48.1) | 938 (48.7) | 435 (46.8) | |
Figure 2.
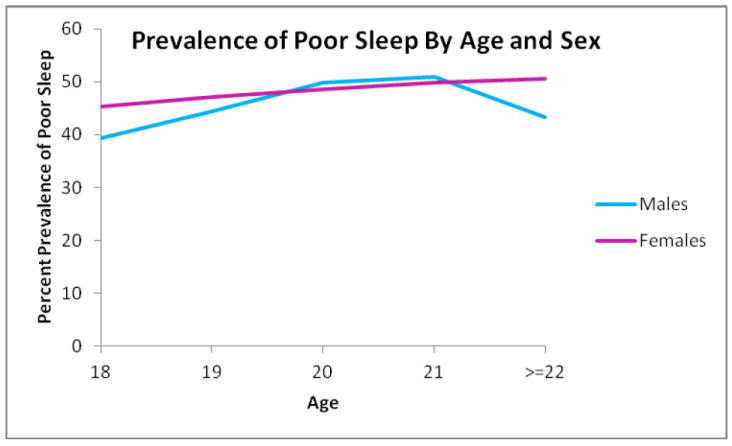
Prevalence of poor sleep quality in relation to age and sex
As shown in Table 3 female students had 17% higher odds of poor sleep quality compared to males, after adjusting for all demographic and behavioral covariates listed in the table [OR 1.17, 95% CI (0.98-1.39)] although statistical significance was not achieved. Adjusting for age and sex, current smokers were found to have higher odds of having poor sleep quality [OR 1.37, 95% CI (1.01-1.86)] compared with those who had never smoked. Adjusting for age and sex, students who consumed more than 19 alcoholic beverages a month were more than twice as likely to have poor sleep quality compared to those who consumed less than 1 alcoholic beverage per month [OR 2.10, 95% CI (1.14-3.85)]. We found that those who were classified as physically active were less likely to report poor sleep quality compared to their inactive counterparts, though this association did not reach statistical significance [age and sex adjusted OR 0.89, 95% CI (0.77-1.03)]. Lastly, adjusting for age and sex, those who reported consuming at least one stimulant beverage per week had 1.60-fold increased odds [95% CI (1.38-1.86)] of reporting poor sleep quality compared to students who consumed no caffeinated beverages. In the multivariate adjusted analysis, this association was slightly attenuated [OR 1.50, 95% CI (1.28-1.77)].
Table 3.
Odds ratio (OR) and 95% confidence intervals (CI) for poor sleep quality
| Characteristic | Unadjusted OR (95% CI) | Age and sex adjusted OR (95% CI) | Multivariate *adjusted OR (95% CI) |
|---|---|---|---|
| Age | 1.03 (0.98-1.09) | 1.04(0.98- 1.09) | 1.00 (0.94-1.06) |
| Sex | |||
| Male | Reference | Reference | Reference |
| Female | 1.08 (0.93-1.27) | 1.09(0.93-1.27) | 1.17 (0.98-1.39) |
| Smoking status | |||
| Never | Reference | Reference | Reference |
| Former | 1.33 (0.78-2.27) | 1.40 (0.81-2.40) | 1.17(0.65-2.11) |
| Current smoker | 1.30 (0.97-1.74) | 1.37 (1.01-1.86) | 1.11(0.79-1.55) |
| Number of alcohol drinks | |||
| <1 drink/month | Reference | Reference | Reference |
| 1-19 drinks/month | 1.15 (0.99-1.35) | 1.18 (1.00-1.39) | 1.02 (0.85-1.22) |
| ≥ 20 drinks/month | 2.02 (1.10-3.68) | 2.10 (1.14-3.85) | 1.41 (0.73-2.72) |
| One stimulant drink/week | |||
| No | Reference | Reference | Reference |
| Yes | 1.60 (1.37-1.85) | 1.60 (1.38-1.86) | 1.50 (1.28-1.77) |
| Physical Activity | |||
| No | Reference | Reference | Reference |
| Yes | 0.88 (0.76-1.02) | 0.89 (0.77-1.03) | 0.97(0.80-1.17) |
Each odds ratio is adjusted for all other covariates listed in the table
Poor sleep quality: PSQI Global score>5
The prevalence of stimulant use according to age and sex is presented in Figure 3. A statistically significant higher prevalence of weekly energy drink consumption was observed among males (62.9%) compared with females (55.6%) [p-value <0.001]. Use of stimulants increased with age among females but there was no clear pattern of such increase among males. The highest prevalence of any stimulant use (i.e., use one or more stimulants per month) was among older (age ≥ 22 years) females (63.6%) and among 18 year old males (73.2%). When considering the use of two or more stimulants per month, a similar pattern was observed. Table 4 summarizes the distribution of stimulant and caffeine use in relation to sleep quality. There was a statistically significant association between poor sleep quality and the consumption of caffeinated beverages and stimulants (p-value< 0.001); those who reported using stimulant beverages, coffee, and/or tea were more likely to be classified as having poor sleep quality. Among poor sleepers, 63.9% reported using stimulant beverages, 54.1% reported using tea, and 29.7% reported using coffee. In comparison, there were 52.5% users of stimulant beverages, 42.1% tea drinkers, and 21.6% coffee drinkers among good sleepers. There also appeared to be a statistically significant dose-response relationship between the number of stimulant beverages used per week and poor sleep quality (p-value<0.001): a majority of those who reported using 3 or more stimulant beverages per week (57.5%) or 2 stimulant beverages per week (50.5%) were classified as having poor sleep quality; in comparison, 44.3% of those who reported using 1 stimulant beverage per week and 41.2% of those who reported using none were classified as poor sleepers. In addition, in our study population, students were more likely to report using sugar-containing caffeinated beverages as opposed to sugar-free beverages (McNemar’s p-value <0.001).
Figure 3.
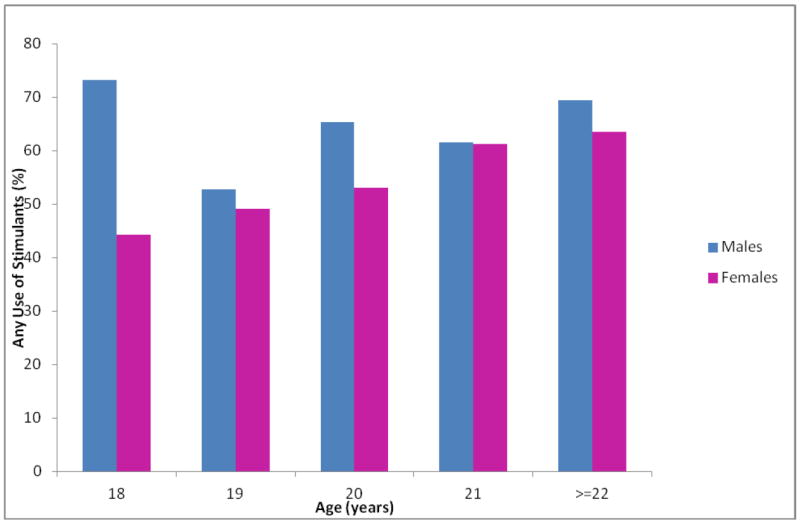
Any stimulant use by age and sex
Table 4.
Consumption of energy drinks, caffeinated beverages and stimulants in relation to sleep quality status
| Exposure | Poor Sleep Quality N=1,373 | Good Sleep Quality N=1,481 | P-value |
|---|---|---|---|
|
| |||
| n (%) | n (%) | ||
| Any stimulant beverages | |||
| No | 496 (36.1) | 703 (47.5) | <0.001 |
| Yes | 877 (63.9) | 778 (52.5) | |
| Type of beverage | |||
| Coke/Pepsi with sugar | 689 (50.2) | 597 (40.3) | <0.001 |
| Coke/Pepsi sugar free | 192 (14.0) | 152 (10.3) | 0.002 |
| M 100/M 150 | 101 (7.4) | 67 (4.5) | 0.001 |
| Red Bull | 43 (3.1) | 33 (2.2) | 0.134 |
| Other Energy Drinks* | 28 (2.0) | 24 (1.6) | 0.403 |
| Coffee | |||
| No | 965 (70.3) | 1,161 (78.4) | <0.001 |
| Yes | 408 (29.7) | 320 (21.6) | |
| With sugar | 379 (27.6) | 295 (19.9) | |
| Sugar Free | 95 (6.9) | 68 (4.6) | |
| Tea | <0.001 | ||
| No | 630 (45.9) | 857 (57.9) | |
| Yes | 743 (54.1) | 624 (42.1) | |
| With sugar | 708 (51.6) | 595 (40.2) | |
| Sugar Free | 285 (20.8) | 231 (15.6) | |
| Number of stimulant beverages/week | |||
| 0 | 497 (36.2) | 708 (47.8) | <0.001 |
| 1 | 116 (8.4) | 146 (9.9) | |
| 2 | 270 (19.7) | 265 (17.9) | |
| ≥3 | 490(35.7) | 362 (24.4) | |
Other energy drinks includes the following: Carabao Daeng, Lipovitan-D or Lipo, Wrangyer, and Shark
A closer examination of the prevalence of specific sleep quality components in relation to lifestyle characteristics is found in Table 5. Compared to those who reported never smoking, current smokers were less likely to report short sleep duration [OR 0.71, 95% CI (0.51-0.97)], but more likely to have long sleep latency [OR 1.49, 95% CI (1.08-2.06)], daytime dysfunction due to poor sleep [OR 1.43, 95% CI (1.02-1.98)], and to use sleep medicines [OR 3.04, 95% CI (1.42-6.54)]. Compared with those who consumed less than one alcoholic beverage per month, those who consumed 1-19 drinks/month had statistically significant lower odds of having short sleep duration [OR 0.82, 95% CI(0.70-0.96)] and 39% higher odds of having daytime dysfunction [OR 1.39 95% CI (1.16-1.67)]. Strikingly, those who reported consuming more than 19 alcoholic beverages per month had more than 3-fold higher odds of having daytime dysfunction [OR 3.10, 95% CI (1.72-5.59)] and more than 5-fold higher odds of reporting use of sleep medicine [OR 5.75, 95% CI (2.02-16.39)]; it should be noted, however, that few students reported using sleep medicine (6.1%) and very few among these consumed alcohol, resulting in a high degree of uncertainty in the estimated measure of association. Those who reported using stimulant beverages had statistically significant higher odds of having long sleep latency [OR 1.45, 95% CI (1.22-1.72)] and daytime dysfunction [OR 1.68, 95% CI (1.41-2.01)]. Lastly, physical activity was found to have an ambiguous effect on sleep quality; those who were physically active were found to have statistically significant lower odds of using sleep medicine though they had statistically significant higher odds of having daytime dysfunction due to sleep.
Table 5.
Prevalence and odds ratios for sleep quality parameters in relation to lifestyle characteristics
| Sleep quality parameters | All (n=2,854) | Short Sleep Duration (<6 hours) (n=1,111) | Long Sleep Latency (>30 min) (n=753) | Day Dysfunction due to sleep (n=724) | Poor Sleep Efficiency (<85%) (n=720) | Sleep Medicine Use (n=56) | |||||
|---|---|---|---|---|---|---|---|---|---|---|---|
|
| |||||||||||
| n | % | OR (95% CI) | % | OR (95% CI) | % | OR (95% CI) | % | OR (95% CI) | % | OR (95% CI) | |
| Smoking status | |||||||||||
| Never | 2,603 | 39.4 | 1.0(Ref) | 25.9 | 1.0(Ref) | 24.8 | 1.0(Ref) | 24.9 | 1.0(Ref) | 1.7 | 1.0(Ref) |
| Former | 55 | 38.2 | 0.92(0.52-1.61) | 23.6 | 0.90(0.47-1.71) | 30.9 | 1.41(0.78-2.54) | 29.1 | 1.27(0.70-2.32) | 5.5 | 3.19(0.93-11.06) |
| Current | 196 | 32.1 | 0.71(0.51-0.97) | 34.7 | 1.49(1.08-2.06) | 31.1 | 1.43 (1.02-1.98) | 28.6 | 1.25(0.89-1.75) | 5.1 | 3.04(1.42-6.54) |
| p-value for trend | 0.035 | 0.022 | 0.023 | 0.160 | 0.002 | ||||||
| Alcohol consumption | |||||||||||
| <1 drink/month | 2,197 | 40.2 | 1.0(Ref) | 25.4 | 1.0(Ref) | 24.0 | 1.0(Ref) | 24.2 | 1.0(Ref) | 1.6 | 1.0(Ref) |
| 1-19 drinks/month | 610 | 33.4 | 0.82 (0.70-0.96) | 29.2 | 1.05(0.87-1.26) | 28.7 | 1.39 (1.16-1.67) | 28.2 | 1.06 (0.88-1.27) | 2.8 | 1.22(0.68-2.19) |
| ≥ 20 drinks/month | 47 | 48.9 | 1.32 (0.73-2.39) | 36.2 | 1.59(0.86-2.94) | 46.8 | 3.10(1.72-5.59) | 31.0 | 1.58(0.85-2.93) | 10.6 | 5.75(2.02-16.39) |
| p-value for trend | 0.043 | 0.017 | <0.001 | 0.011 | 0.001 | ||||||
| Any stimulant beverages | |||||||||||
| No | 1,199 | 38.4 | 1.0(Ref) | 22.2 | 1.0(Ref) | 19.9 | 1.0(Ref) | 23.4 | 1.0(Ref) | 1.6 | 1.0(Ref) |
| Yes | 1,655 | 39.3 | 1.05(0.90-1.23) | 29.4 | 1.45(1.22-1.72) | 29.4 | 1.68(1.41-2.01) | 26.6 | 1.19(1.00-1.41) | 2.2 | 1.32(0.76-2.32) |
| Physical activity | |||||||||||
| No | 629 | 37.0 | 1.0(Ref) | 27.7 | 1.0(Ref) | 20.4 | 1.0(Ref) | 27.7 | 1.0(Ref) | 3.0 | 1.0(Ref) |
| Yes | 2,215 | 39.5 | 1.10 (0.92-1.32) | 26.0 | 0.92 (0.75-1.12) | 26.7 | 1.43 (1.15-1.78) | 24.5 | 0.85 (0.69-1.04) | 1.7 | 0.53 (0.30-0.93) |
Adjusted for age and gender
DISCUSSION
To the best of our knowledge, this is the first study to examine the pattern of sleep quality in relation to caffeine use in a Southeast Asian population. Our results showed that a significant percent of our population used stimulant beverages (58%), with 18-year-old males and females over the age of 21 years at highest risk of stimulant use. A large proportion (48.1%) of our study population also had poor sleep quality. Cigarette smoking, alcohol consumption, and stimulant use were found to be risk factors for poor sleep quality. Alcohol consumption was associated with increased odds of daytime dysfunction and use of sleep medicine in our study population. Current cigarette smoking status was associated with increased odds of long sleep latency, daytime dysfunction, and sleep medicine use.
The prevalence of poor sleep quality in Thai college students appears to be similar to that of other Asian college students [16, 29]; one study that also examined sleep quality using the PSQI found that 54.7% of Chinese college students suffer from poor sleep quality [16]. No significant differences in sleep quality by sex were found in our study, though we did find that there were relatively more females with poor sleep quality than males. This is consistent with some other studies that found a significant association between sex and poor sleep quality [14, 16, 29].
In our study, there was evidence that moderate alcohol consumption increases the overall odds of having poor sleep quality and increases the odds of using sleep medicine, but it was associated with a significantly reduced odds of short sleep duration. Other researchers have also found that low dose alcohol consumption leads to longer sleep duration [30]. Alcohol is commonly believed to increase sleepiness, and there are a number of biological mechanisms that explain its sedative effects. Ethanol inhibits the function of NDMA (N-methyl-D-aspartate) receptors which are the binding site for glutamate, a major excitatory neurotransmitter [30]. Additionally, ethanol has been found to facilitate the function of GABA (γ-aminobutyric acid), an inhibitory neurotransmitter, and is also believed to lead to enhanced synthesis of adenosine and enhanced adenosine receptor function, leading to the onset of sleep [30]. Alcohol, however, also has REM suppressive effects which may explain the association between poor sleep and alcohol consumption [30]. It could be that the association between poor sleep and alcohol consumption is bi-directional with pre-existing poor sleep quality leading to increased alcohol consumption. One study found that 30% of insomniacs reported using alcohol to help them sleep [31].
Other researchers have also found an association between sleep medication use and alcohol consumption, which may indicate that there is concurrent abuse of alcohol and prescription drug [32]. Of particular concern is the tendency for young adults to self-medicate for sleep wakefulness [33, 34]. A study analyzing sleep patterns and disturbed sleep in college students found that poor quality sleepers reported higher alcohol consumption and more frequent use of alcohol and self-medication to help regulate their sleep/wake schedule. The study also underscored the potential effect of combined use of sleep medications and stimulants in the stimulant-sedation loop (use of caffeine and other stimulants to counteract daytime sleepiness and subsequent use of depressants to counteract the effect of the stimulants) [33]. Drug dependency may arise if students get caught in a pattern of using sleep medication in combination with other drugs [33]. This thesis is supported by the observation that approximately 90% of adolescents entering drug rehab programs report self-medicating with psychoactive drugs to control sleep and combat fatigue [35].
In the present study we found that cigarette smoking was associated with an increased odds of poor sleep quality. This finding is consistent with those of other studies [36, 37]. The mechanism through which smoking leads to poor sleep quality could involve nicotine [36], a stimulant found in cigarettes that has pharmacological effects on sleep through increased sleep latency and reduced rapid eye movement (REM) sleep [37]. Smoking is also a risk factor for sleep-disordered breathing which may, in part, explain the observed association between smoking and poor sleep quality [36]. Our study indicates that cigarette smoking lowers the odds of having short sleep duration; however, other studies in both children and adults found a negative association between cigarette smoking and sleep duration [37]. We do not have a clear explanation for this contradictory observed association.
The popularity of energy drinks among young college students is evident. Investigators have reported that 34% of 18- to 24-year olds are regular consumers of energy drinks [38]. A recent survey of US college students found that 51% of students reported consuming at least one energy drink during the last month; the majority of them habitually consumed energy drinks several times per week [11, 12]. This is consistent with our results, which found that 58.0% of Thai college students report using at least one energy drink per month. Malinauskas et al. [11] found that the desire to increase energy (65%) and fight the effects of insufficient sleep (67%) were the most common reasons for stimulant use among college students. These were the second and third most commonly reported reasons for using stimulants in our study. The most reported reason for using stimulants was to study for exams or complete a school project (34.1%).
The transition from adolescence to young adulthood marks the beginning of biological, cognitive, and physiological changes in addition to increases in academic demands and psychosocial stress [39]. Caffeinated stimulants are broadly regarded as helping college students stay focused and alert to improve their academic performance, to socialize, and to provide them with a boost of energy to temporarily restore mental alertness or wakefulness when they are experiencing fatigue or drowsiness [13]. The high frequency of caffeine use in our study sample may reflect a coping strategy for the increased educational and social demands students typically experience during college.
The generally accepted biological mechanism for the observed association between stimulant use and poor sleep implicates caffeine, an ingredient found in both energy drinks and caffeinated beverages. Adenosine is a secondary by-product of the breakdown of ATP and cAMP, which functions in the regulation of sleep and wakefulness by inhibiting the release of most brain excitatory neurotransmitters such as dopamine [40, 41]. Adenosine agonists decrease wakefulness and increase sleep while antagonists increase wakefulness and decrease sleep [40]. Caffeine is an adenosine antagonist that acts on adenosine receptor subtypes, thereby blocking and counteracting adenosine activity and leading to the release of dopamine, activation of the central nervous system, and increased wakefulness [40]. However, sensitivity to the adenosine inhibitory effects of caffeine varies across individuals and is influenced by tolerance levels and genetics [42]. Thus, caffeine consumption has only been found to reduce sleep quality in caffeine-sensitive individuals [42].
There is an established association between caffeine use and alcohol consumption in the literature [11, 20, 38, 43, 44]. The combination of energy drinks and alcohol is becoming exceedingly popular among college students [11]. In a survey of energy drink consumption patterns among US college students, 49% of the students reported using three or more energy drinks mixed with alcohol while partying [11]. In contrast, consuming alcohol while partying was the fourth most reported reason for consuming energy drinks in our study population and was only popular among 11.3% of those who reported using energy drinks. The practice of consuming greater amounts of caffeine while socializing has principally been documented among US young adults where an alcoholic setting is considered a primary place to socialize and meet people by many college students [11].
The results from our study should be interpreted in the context of some limitations. First, we did not use random sampling, but instead considered subjects who were willing to participate in the study, thus our findings may be subject to volunteer bias. Second, our study did not include students taking classes in correspondence, extension, or night school programs. Thus the results might not be generalized to those students. Future studies that include other groups of students are warranted. Additionally, there may be substantial heterogeneity among poor sleepers (PSQI total scores among those classified as poor sleepers ranged from 6-18), which could mask the association between sleep quality and some of the lifestyle characteristics considered. Lastly, as this study followed a cross-sectional data collection design, the temporal relationship between poor sleep quality and stimulant use, alcohol consumption, and/or cigarette smoking cannot be determined. A longitudinal study design would better allow determination of the prospective relationship between stimulant use and altered sleep quality.
In summary, findings from our study as well as those of others underscore the need to better understand patterns of caffeine and stimulant use among young adults, and the health implications of such use. Poor sleep quality can result in serious cardiometabolic and psychiatric problems that may influence students’ future quality of life. Inadequate sleep is correlated with increased risk-taking behavior and drowsy driving. Additionally, sleep problems are associated with lower academic performance [8, 45, 46]. One study found that college students with later bed times and wake-up times were more often those with lower academic performance, and estimated that GPAs would have an expected decrease of 0.13 points on a scale of 0-4 for each hour delay in rising time [1, 8]. Thus, young adults should be educated on the importance of sleep in addition to the negative health outcomes associated with inadequate sleep. As college students most often report using stimulants for educational reasons, educators should also be more cognizant and perhaps more proactive in attempting to formulate and enact policies that promote the avoidance of excessive use of caffeine and other stimulants (e.g., discourage consumption of energy drink by prohibiting sale of energy drinks in campus stores). As a significant proportion of students also reported mixing stimulants with alcohol, future research should carefully examine the sleep quality and health implications of consuming caffeine and alcohol. Research that better elucidates the prospective relationship between stimulant use and poor sleep is also needed. This study will give public health professionals and educators information that may be useful in creating campaigns to address poor sleep quality in young adults.
Acknowledgments
H.K. and G.C. were research training fellows with the Multidisciplinary International Research Training (MIRT) Program of the Harvard University School of Public Health when this research study was completed. The Multidisciplinary International Research Program is supported by an award from the National Institutes of Health, National Institute on Minority Health and Health Disparities (T37-MD000149).
Footnotes
Competing Interests
None to declare
References
- 1.Curcio G, Ferrara M, De Gennaro L. Sleep loss, learning capacity and academic performance. Sleep medicine reviews. 2006;10(5):323–337. doi: 10.1016/j.smrv.2005.11.001. [DOI] [PubMed] [Google Scholar]
- 2.Ferrie JE, Kumari M, Salo P, Singh-Manoux A, Kivimaki M. Sleep epidemiology--a rapidly growing field. International journal of epidemiology. 2011;40(6):1431–1437. doi: 10.1093/ije/dyr203. [DOI] [PMC free article] [PubMed] [Google Scholar]
- 3.Javaheri S, Storfer-Isser A, Rosen CL, Redline S. Sleep quality and elevated blood pressure in adolescents. Circulation. 2008;118(10):1034–1040. doi: 10.1161/CIRCULATIONAHA.108.766410. [DOI] [PMC free article] [PubMed] [Google Scholar]
- 4.Soares MJ, Macedo A, Bos SC, Maia B, Marques M, Pereira AT, Gomes AA, Valente J, Nogueira V, Azevedo MH. Sleep disturbances, body mass index and eating behaviour in undergraduate students. Journal of sleep research. 2011;20(3):479–486. doi: 10.1111/j.1365-2869.2010.00887.x. [DOI] [PubMed] [Google Scholar]
- 5.Moo-Estrella J, Perez-Benitez H, Solis-Rodriguez F, Arankowsky-Sandoval G. Evaluation of depressive symptoms and sleep alterations in college students. Archives of medical research. 2005;36(4):393–398. doi: 10.1016/j.arcmed.2005.03.018. [DOI] [PubMed] [Google Scholar]
- 6.Pilcher JJ, Ginter DR, Sadowsky B. Sleep quality versus sleep quantity: relationships between sleep and measures of health, well-being and sleepiness in college students. Journal of psychosomatic research. 1997;42(6):583–596. doi: 10.1016/s0022-3999(97)00004-4. [DOI] [PubMed] [Google Scholar]
- 7.Knutson KL. Sociodemographic and cultural determinants of sleep deficiency: Implications for cardiometabolic disease risk. Social science & medicine. 2012 doi: 10.1016/j.socscimed.2012.05.002. Epub ahead of print. [DOI] [PMC free article] [PubMed] [Google Scholar]
- 8.Gaultney JF. The prevalence of sleep disorders in college students: impact on academic performance. Journal of American college health. 2011;59(2):91–97. doi: 10.1080/07448481.2010.483708. [DOI] [PubMed] [Google Scholar]
- 9.Okun ML, Coussons-Read M, Hall M. Disturbed sleep is associated with increased C-reactive protein in young women. Brain, behavior, and immunity. 2009;23(3):351–354. doi: 10.1016/j.bbi.2008.10.008. [DOI] [PMC free article] [PubMed] [Google Scholar]
- 10.Yu Y, Lu BS, Wang B, Wang H, Yang J, Li Z, Wang L, Liu X, Tang G, Xing H, Xu X, Zee PC, Wang X. Short sleep duration and adiposity in Chinese adolescents. Sleep. 2007;30(12):1688–1697. doi: 10.1093/sleep/30.12.1688. [DOI] [PMC free article] [PubMed] [Google Scholar]
- 11.Malinauskas BM, Aeby VG, Overton RF, Carpenter-Aeby T, Barber-Heidal K. A survey of energy drink consumption patterns among college students. Nutrition journal. 2007;6:35. doi: 10.1186/1475-2891-6-35. [DOI] [PMC free article] [PubMed] [Google Scholar]
- 12.Seifert SM, Schaechter JL, Hershorin ER, Lipshultz SE. Health effects of energy drinks on children, adolescents, and young adults. Pediatrics. 2011;127(3):511–528. doi: 10.1542/peds.2009-3592. [DOI] [PMC free article] [PubMed] [Google Scholar]
- 13.Bunka D. The drink of athletics, rock stars, college students…and your twelve year old! RxFiles, Saskatoon Health Region. [July 16th, 2012];2011 Available at: http://www.rxfiles.ca/rxfiles.
- 14.Tsai LL, Li SP. Sleep patterns in college students: gender and grade differences. Journal of psychosomatic research. 2004;56(2):231–237. doi: 10.1016/S0022-3999(03)00507-5. [DOI] [PubMed] [Google Scholar]
- 15.Mak KK, Ho SY, Thomas GN, Lo WS, Cheuk DK, Lai YK, Lam TH. Smoking and sleep disorders in Chinese adolescents. Sleep medicine. 2010;11(3):268–273. doi: 10.1016/j.sleep.2009.07.017. [DOI] [PubMed] [Google Scholar]
- 16.Cheng SH, Shih CC, Lee IH, Hou YW, Chen KC, Chen KT, Yang YK, Yang YC. A study on the sleep quality of incoming university students. Psychiatry research. 2012;197(3):270–4. doi: 10.1016/j.psychres.2011.08.011. [DOI] [PubMed] [Google Scholar]
- 17.Tagaya H, Uchiyama M, Ohida T, Kamei Y, Shibui K, Ozaki A, Tan X, Suzuki H, Aritake S, Li L, Takahashi K. Sleep habits and factors associated with short sleep duration among Japanese high-school students: A community study. Sleep and biological rhythms. 2004;2(1):57–64. [Google Scholar]
- 18.Nova P, Hernandez B, Ptolemy AS, Zeitzer JM. Modeling caffeine concentrations with the Stanford Caffeine Questionnaire: preliminary evidence for an interaction of chronotype with the effects of caffeine on sleep. Sleep medicine. 2012;13(4):362–367. doi: 10.1016/j.sleep.2011.11.011. [DOI] [PubMed] [Google Scholar]
- 19.Snel J, Lorist MM. Effects of caffeine on sleep and cognition. Progress in brain research. 2011;190:105–117. doi: 10.1016/B978-0-444-53817-8.00006-2. [DOI] [PubMed] [Google Scholar]
- 20.Reissig CJ, Strain EC, Griffiths RR. Caffeinated energy drinks--a growing problem. Drug and alcohol dependence. 2009;99(1-3):1–10. doi: 10.1016/j.drugalcdep.2008.08.001. [DOI] [PMC free article] [PubMed] [Google Scholar]
- 21.Koo BB, Dostal J, Ioachimescu O, Budur K. The effects of gender and age on REM-related sleep-disordered breathing. Sleep & breathing. 2008;12(3):259–264. doi: 10.1007/s11325-007-0161-7. [DOI] [PubMed] [Google Scholar]
- 22.Falavigna A, de Souza Bezerra ML, Teles AR, Kleber FD, Velho MC, Steiner B, Beckenkamp NL, Lazzaretti L, Barazzetti D, Abruzzi F, Baseggio N, de Braga GL, Ferrari P, de Souza MV. Sleep disorders among undergraduate students in Southern Brazil. Sleep & breathing. 2011;15(3):519–524. doi: 10.1007/s11325-010-0396-6. [DOI] [PubMed] [Google Scholar]
- 23.Ishak WW, Ugochukwu C, Bagot K, Khalili D, Zaky C. Energy drinks: psychological effects and impact on well-being and quality of life-a literature review. Innovations in clinical neuroscience. 2012;9(1):25–34. [PMC free article] [PubMed] [Google Scholar]
- 24.Buysse DJ, Reynolds CF, 3rd, Monk TH, Berman SR, Kupfer DJ. The Pittsburgh Sleep Quality Index: a new instrument for psychiatric practice and research. Psychiatry research. 1989;28(2):193–213. doi: 10.1016/0165-1781(89)90047-4. [DOI] [PubMed] [Google Scholar]
- 25.WHO. Global status report on alcohol. Geneva, Switzerland: World Health Organization. Department of Mental Health and Substance Abuse; 2004. [Google Scholar]
- 26.Freiberg MS, Cabral HJ, Heeren TC, Vasan RS, Curtis Ellison R. Alcohol consumption and the prevalence of the Metabolic Syndrome in the US.: a cross-sectional analysis of data from the Third National Health and Nutrition Examination Survey. Diabetes care. 2004;27(12):2954–2959. doi: 10.2337/diacare.27.12.2954. [DOI] [PubMed] [Google Scholar]
- 27.WHO. Physical status: the use and interpretation of anthropometry Report of a WHO Expert Committee. Geneva, Switzerland: World Health Organization; 1995. [PubMed] [Google Scholar]
- 28.Rothman KJ, Greenland S, Lash TL. Modern epidemiology. Philadelphia: Wolters Kluwer Health/Lippincott Williams & Wilkins; 2008. [Google Scholar]
- 29.Suen LK, Hon KL, Tam WW. Association between sleep behavior and sleep-related factors among university students in Hong Kong. Chronobiology international. 2008;25(5):760–775. doi: 10.1080/07420520802397186. [DOI] [PubMed] [Google Scholar]
- 30.Roehrs T, Roth T. Sleep, sleepiness, sleep disorders and alcohol use and abuse. Sleep medicine reviews. 2001;5(4):287–297. doi: 10.1053/smrv.2001.0162. [DOI] [PubMed] [Google Scholar]
- 31.Ancoli-Israel S, Roth T. Characteristics of insomnia in the United States: results of the 1991 National Sleep Foundation Survey. I. Sleep. 1999;22(Suppl 2):S347–353. [PubMed] [Google Scholar]
- 32.Kenney SR, LaBrie JW, Hummer JF, Pham AT. Global sleep quality as a moderator of alcohol consumption and consequences in college students. Addictive behaviors. 2012;37(4):507–512. doi: 10.1016/j.addbeh.2012.01.006. [DOI] [PMC free article] [PubMed] [Google Scholar]
- 33.Lund HG, Reider BD, Whiting AB, Prichard JR. Sleep patterns and predictors of disturbed sleep in a large population of college students. Journal of adolescent health. 2010;46(2):124–132. doi: 10.1016/j.jadohealth.2009.06.016. [DOI] [PubMed] [Google Scholar]
- 34.Luo M, Feng Y, Li T. Sleep medicine knowledge, attitudes, and practices among medical students in Guangzhou, China. Sleep & breathing. 2012 doi: 10.1007/s11325-012-0743-x. Epub ahead of print. [DOI] [PubMed] [Google Scholar]
- 35.Bootzin RR, Stevens SJ. Adolescents, substance abuse, and the treatment of insomnia and daytime sleepiness. Clinical psychology review. 2005;25(5):629–644. doi: 10.1016/j.cpr.2005.04.007. [DOI] [PubMed] [Google Scholar]
- 36.Wetter DW, Young TB, Bidwell TR, Badr MS, Palta M. Smoking as a risk factor for sleep-disordered breathing. Archives of internal medicine. 1994;154(19):2219–2224. [PubMed] [Google Scholar]
- 37.Phillips BA, Danner FJ. Cigarette smoking and sleep disturbance. Archives of internal medicine. 1995;155(7):734–737. [Google Scholar]
- 38.Heckman MA, Sherry K, De Mejia EG. Energy Drinks: An Assessment of Their Market Size, Consumer Demographics, Ingredient Profile, Functionality, and Regulations in the United States. Comprehensive reviews in food science and food safety. 2010;9(3):303–317. doi: 10.1111/j.1541-4337.2010.00111.x. [DOI] [PubMed] [Google Scholar]
- 39.Yang CK, Kim JK, Patel SR, Lee JH. Age-related changes in sleep/wake patterns among Korean teenagers. Pediatrics. 2005;115(1 Suppl):250–256. doi: 10.1542/peds.2004-0815G. [DOI] [PubMed] [Google Scholar]
- 40.Bjorness TE, Greene RW. Adenosine and sleep. Current neuropharmacology. 2009;7(3):238–245. doi: 10.2174/157015909789152182. [DOI] [PMC free article] [PubMed] [Google Scholar]
- 41.Davis JM, Zhao Z, Stock HS, Mehl KA, Buggy J, Hand GA. Central nervous system effects of caffeine and adenosine on fatigue. American journal of physiology regulatory, integrative and comparative physiology. 2003;284(2):R399–404. doi: 10.1152/ajpregu.00386.2002. [DOI] [PubMed] [Google Scholar]
- 42.Landolt HP. “No Thanks, Coffee Keeps Me Awake”: Individual Caffeine Sensitivity Depends on ADORA2A Genotype. Sleep. 2012;35(7):899–900. doi: 10.5665/sleep.1942. [DOI] [PMC free article] [PubMed] [Google Scholar]
- 43.Wiklund U, Karlsson M, Ostrom M, Messner T. Influence of energy drinks and alcohol on post-exercise heart rate recovery and heart rate variability. Clinical physiology and functional imaging. 2009;29(1):74–80. doi: 10.1111/j.1475-097X.2008.00837.x. [DOI] [PubMed] [Google Scholar]
- 44.Yunusa I, A IM. Energy- Drinks: Composition and Health Benefits. Bayero journal of pure and applied sciences. 2012;4(2):186–191. [Google Scholar]
- 45.Taylor DJ, Bramoweth AD. Patterns and consequences of inadequate sleep in college students: substance use and motor vehicle accidents. Journal of adolescent health. 2010;46(6):610–612. doi: 10.1016/j.jadohealth.2009.12.010. [DOI] [PubMed] [Google Scholar]
- 46.Eliasson AH, Lettieri CJ. Early to bed, early to rise! Sleep habits and academic performance in college students. Sleep & breathing. 2010;14(1):71–75. doi: 10.1007/s11325-009-0282-2. [DOI] [PubMed] [Google Scholar]