

Abstract
The authors attempted to validate a 2‐stage strategy to screen for severe obstructive sleep apnea syndrome (s‐OSAS) among hypertensive outpatients, with polysomnography (PSG) as the gold standard. Using a prospective design, outpatients with hypertension were recruited from medical outpatient clinics. Interventions included (1) assessment of clinical data; (2) home sleep testing (HST); and (3) 12‐channnel, in‐laboratory PSG. The authors developed models using clinical or HST data alone (single‐stage models) or clinical data in tandem with HST (2‐stage models) to predict s‐OSAS. For each model, area under receiver operating characteristic curves (AUCs), sensitivity, specificity, negative likelihood ratio, and negative post‐test probability (NPTP) were computed. Models were then rank‐ordered based on AUC values and NPTP. HST used alone had limited accuracy (AUC=0.727, NPTP=2.9%). However, models that used clinical data in tandem with HST were more accurate in identifying s‐OSAS, with lower NPTP: (1) facial morphometrics (AUC=0.816, NPTP=0.6%); (2) neck circumference (AUC=0.803, NPTP=1.7%); and Multivariable Apnea Prediction Score (AUC=0.799, NPTP=1.5%) where sensitivity, specificity, and NPTP were evaluated at optimal thresholds. Therefore, HST combined with clinical data can be useful in identifying s‐OSAS in hypertensive outpatients, without incurring greater cost and patient burden associated with in‐laboratory PSG. These models were less useful in identifying obstructive sleep apnea syndrome of any severity.
Obstructive sleep apnea (OSA) affects approximately one third of individuals with secondary hypertension and is one of its major identifiable causes.1 Large‐scale studies that associated2 and implicated OSA in the development of incident hypertension3 support this designation, even after controlling for obesity, a major risk factor for OSA. Some randomized trials have shown that treating OSA with positive airway pressure (PAP) reduces blood pressure (BP),4, 5, 6, 7 particularly if OSA is severe and participants are sleepy.4, 5, 8, 9, 10, 11 These results, along with the high prevalence of OSA among patients with hypertension, support screening patients with hypertension for severe sleep OSA syndrome (s‐OSAS; severe OSA associated with sleepiness).12
In‐laboratory polysomnography (PSG) is unsuitable for screening13 because of complexity, expense, and inaccessibility. Signs and symptoms may identify persons at risk for OSA,14, 15 using questionnaires.16 While particularly useful in lean patients,16 symptoms are often nonspecific or under‐reported. Facial morphometrics17 have not added predictive value to body mass index (BMI, a proxy for obesity), which has been used for risk assessment. In 2005, the American Academy of Sleep Medicine (AASM) deemed current clinical models insufficient for predicting apnea severity.18
We previously validated a 2‐stage screening tool for OSA.19, 20 We first applied a risk score that combined data from symptoms, age, sex, and BMI to everyone. In the second stage, we conducted overnight oximetry in a subset at intermediate risk. Portable sleep monitors21 that assess respiratory effort and airflow in addition to oximetry22 have since become available, allowing for unattended home sleep testing (HST).
In the current study, we used HST to validate our 2‐stage model in hypertensive outpatients. We screened for s‐OSAS since the greatest benefits from PAP, including reduction in BP4, 9, 10 and cardiovascular event rates,23 occur in this group. The 2‐stage screening tool was also applied to hypertensive patients with any OSA associated with sleepiness, regardless of OSA severity.
Methods
The institutional review boards of the University of Pennsylvania and Philadelphia VA Medical Centers approved this protocol. All patients provided informed consent.
Patient Selection
We recruited consecutive outpatients with hypertension aged 30 to 65 years from internal medicine practices at the Philadelphia VA Medical Center and the Hypertension Clinic at the University of Pennsylvania. We defined hypertension as systolic BP ≥140 mm Hg, diastolic BP ≥90 mm Hg, or the use of any antihypertensive medication.2 We excluded patients who had prior PSG or could not participate because of self‐reported illness, pain, or circadian sleep disturbances (Figure 1).
Figure 1.
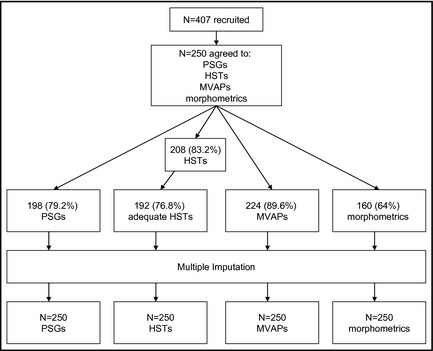
Flow diagram. PSGs indicates polysomnograms; HSTs, home sleep tests; MVAPs, multivariable apnea prediction scores.
Interventions Offered For All Patients
Demographics, apnea symptoms, tobacco and alcohol use, physical examination, and the Epworth Sleepiness Scale (ESS)24 were self‐reported. We measured BMI and neck circumference (NC).
Facial morphometrics score combined BMI, NC, degree of overjet of the maxilla over the mandible, palatal height, and intermolar width. Higher scores signified greater apnea risk.17
HST (AutoSet PDS, ResMed Corp, San Diego, CA) consisted of unattended pulse oximetry, chest and abdominal movement, and airflow by nasal pressure for one night. Following technician‐led instruction, patients self‐applied the sensors at home, wore them for one night, and returned them in person. We applied the AutoSet's automated scoring algorithm to downloaded data25, which used a 50% drop in airflow from the baseline value to define a hypopnea and a 75% drop in airflow for ≥10 seconds for an apnea. Desaturation was not required to score apneas or hypopneas.25 Therefore, while oximetry was worn according to the manufacturer's protocol, it was not used in automated scoring. We chose in‐home monitoring and automated scoring to reflect typical clinical practice.
In‐laboratory PSG‐recorded electro‐encephalograms; eye, chin, and pre‐tibial muscle activity; electrocardiography; oximetry;chest and abdominal respiratory effort; and airflow by nasal cannula and oral thermistor (Formerly Sandman System, now Embla Systems Inc, Broomfield, CO). Technicians performed PSG prospectively, after questionnaires and unattended sleep studies, while blind to questionnaire data, apnea risk scores, facial morphometrics, and unattended sleep study data. They scored PSG results26 and computed the apnea‐hypopnea index (AHI) as ([apneas+hypopneas]/hours of sleep time). An apnea was ≥10 seconds of airflow cessation. A hypopnea required ≥10 seconds of reduction in airflow: (1) either ≥50% or (2) ≥30% with ≥4% fall in SaO2 or an arousal.
Missing Data
We conducted multiple imputation for missing age, BMI, NC, ESS, symptoms, PSG AHI, and unattended HST AHI (uAHI) values using a well‐validated method27 (PROC MI; SAS Systems, Cary, NC).
Case Definition
We defined a case of s‐OSAS as AHI ≥30 events per hour + ESS >10.8 Alternatively, we considered AHI ≥5 events per hour + ESS >10 as any case of OSAS.
Risk Assessment
For all patients with available data, we assessed risk via 1‐ and 2‐stage strategies:
Single‐stage strategies (risk scores): Our base model, the multivariable apnea prediction (MVAP) score, combined symptoms, BMI, age, and sex to compute s‐OSAS risk.16 To elucidate symptoms, patients self‐rated their frequency of snoring, choking, and witnessed apneas on a Likert scale (range=0 to 4). We combined this score with BMI, age, and sex using a previously validated16 multiple logistic regression (SAS version 9.2, Cary, NC) and obtained a risk score (range=0 to 1, 1=high risk, 0=absent risk for s‐OSAS). Individual analyses for BMI, NC, age, facial morphology, and symptoms were also completed.
-
Two‐stage strategies
First stage: We categorized patients into high‐, intermediate‐, or low‐risk groups based on their first‐stage test score (eg, the MVAP). “Upper bound” separated high‐ from intermediate‐risk groups. “Lower bound” separated intermediate‐ from low‐risk groups (Figure 2; see “Model development and validation” below). We predicted that patients with a risk score >upper bound would have s‐OSAS, and those with a risk score <lower bound would not.
Second stage: Patients with intermediate scores (between upper and lower bound) were predicted to have s‐OSAS if the uAHI was >“uAHIthreshold.” If uAHI <uAHIthreshold, they were predicted to be free of s‐OSAS.19 The analysis was repeated for any patient with OSAS regardless of severity.
Figure 2.
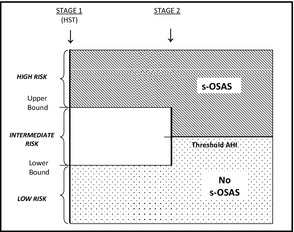
Study design. HST indicates home sleep test; AHI, Apnea‐Hypopnea Index; s‐OSAS, severe obstructive sleep apnea associated with sleepiness.
Model Development and Validation
While single‐stage strategies had a single parameter (ie, cutpoint), 2‐stage strategies had 3 parameters: the upper and lower bounds and the uAHIthreshold. The “optimal” parameter set minimized misclassification rate and maximized specificity; we identified it using an exhaustive enumeration algorithm with SAS version 9.2 (see below). Using this optimal parameter set, we computed sensitivity, specificity, negative likelihood ratio (LRneg),28 and negative post‐test probability (NPTP) in a randomly selected 70% estimation sample and in the remaining 30% validation sample. We also computed the AUC29 in both samples. Using bootstrap resampling, we generated 95% confidence intervals (CIs) for AUC, sensitivity, specificity, and LRneg.
Determination of the Optimal Cutpoints for the Single‐Stage Strategies
We first selected 9 candidate cutpoints for each model that divided the sample into 10 groups of equal number. For each candidate cutpoint, we calculated error rate as (FP + 1.2 × FN). We weighted false‐negatives (missed cases) at 1.2 times the false‐positives, because we presumed that missing cases of severe OSAS was a more serious error than falsely labeling a normal patient with severe OSAS. In sensitivity analyses, we considered values from 1.0 to 2.0 in increments of 0.1. We chose 1.2 when our sensitivity analysis showed that higher weights did not improve the LRneg. The optimum cutpoint was identified as the one that minimized this error rate. In cases of ties, the solution that maximized specificity was chosen. We have outlined this rationale elsewhere.30, 31
Determination of the Optimal Cutpoints for the 2‐Stage Strategies
The 2‐stage strategy had 3 parameters: the upper and lower bounds of the first stage test and uAHIthreshold. We considered 6 uAHI‐thresholds: 5, 10, 15, 20, 25, and 30 per hour. For the first stage test, we considered candidate cutpoints (9 upper and 9 lower bound values) as described for the single‐stage strategies. Thus, we considered a total of 6 × 9 × 9 = 486 possible parameter sets and computed (FP + 1.2 × FN) for each parameter set. We selected the optimum parameter set as the one that minimized this error rate and maximized specificity.
Quantification of the Discriminatory Power of Each Model
Using the optimum cutpoints of each of the models, we computed sensitivity, specificity, and LRneg. We computed LRneg as (1‐sensitivity)/specificity. We computed the NPTP associated with LRneg after applying a Bayesian formula and the prevalence of OSA in a 70% estimation sample (6.9%). We also computed a prediction discrimination index as the AUC constructed from the logistic model predicted values. For the 30% validation sample, this was performed using the formula AUC = (D + 1)/2, where D represents the Somer's D statistic of the proc logistic function. We rank‐ordered the discriminatory power of the models by sorting them based on the value of AUC, with larger values of AUC denoting the best‐performing models. The AUC for each model is an estimate of the probability that a randomly selected case has a larger predicted value than a randomly selected control.
Generation of Nonparametric 95% Bootstrap Confidence Limits
Using the estimation cohort, we generated 1000 bootstrap re‐samples with replacement via SAS programming. For each re‐sample, we computed (1) AUC and (2) the optimum cutpoint and its associated sensitivity, specificity, and LRneg. We selected from these distributions the 2.5th and 97.5th percentile values of AUC, sensitivity, specificity, and LRneg to define the 95% nonparametric confidence limits.
Model Validation
We computed percent difference as (AUC in validation sample – AUC in estimation sample)/(AUC in estimation sample). We categorized models as “robust” if this percent difference in AUC between validation and estimation samples was ≥−5%, and “not robust” if this percent difference in AUC was <−5%. The optimal model was the one that was robust and had the highest AUC.
Results
Patient Characteristics
We enrolled 250 patients (Table 1) after excluding those with self‐reported pain (n=7), medical illness (n=7), jet lag (n=2), or night shift work (n=19). Sample, estimation, and validation subsets were similar, except for a larger percentage of Caucasians in the estimation subset. The average (standard deviation [SD]) age, NC, and BMI were: 52.6 (7.7) years, 42.2 (4.5) cm, and 32.1 (7.4) kg/m2, respectively. s‐OSAS and any OSAS frequency distribution by BMI category is shown (Figure 3). In the patients with and without s‐OSAS, the average (SD) BPs were 145/87 (12/11) mm Hg and 139/82 (15/10) mm Hg, respectively.
Table 1.
Patient Characteristics
| Participants (N=250)a | Estimation Sample (n=146) | Validation Sample (n=52) | P Value | |
|---|---|---|---|---|
| Mean age (SD), y | 52.6 (7.70) | 52.6 (7.49) | 53.2 (8.37) | .95 |
| Men, % | 200 (80.0) | 119 (81.5) | 43 (82.7) | .48 |
| Caucasian, % | 101 (40.4) | 51 (34.9) | 15 (28.9) | .04 |
| African American, % | 147 (58.8) | 95 (63.7) | 37 (71.2) | .06 |
| Apnea risk, mean (SD) | ||||
| BMI, kg/m2 | 32.1 (7.36) | 32.6 (7.35) | 31.8 (6.37) | .23 |
| NC, cm | 42.2 (4.53) | 42.5 (4.38) | 42.0 (4.39) | .23 |
| MVAP | 0.53 (0.25) | 0.56 (0.23) | 0.49 (0.31) | .06 |
| Morphometrics | 68.5 (24.7) | 69.7 (24.5) | 70.9 (24.9) | .45 |
| Smokers, % | ||||
| Current smokers | 72 (28.8) | 38 (26.0) | 22 (42.3) | .25 |
| Ever smokers | 83 (33.2) | 43 (29.4) | 24 (46.2) | .13 |
| Blood pressure, mean (SD) | ||||
| Systolic | 139.0 (14.9) | 138.3 (15.0) | 141.0 (14.5) | .26 |
| Diastolic | 82.2 (9.2) | 82.5 (9.6) | 81.4 (8.3) | .48 |
| Alcohol consumers, % | ||||
| At least 1 drink per d | 155 (61.8) | 86 (58.9) | 33 (63.4) | .25 |
| At least 12‐oz beer per wk | 102 (40.6) | 56 (39.7) | 21 (40.4) | .74 |
| At least 4‐oz spirit per wk | 68 (27.3) | 36 (25.0) | 17 (32.7) | .32 |
| At least 6‐oz wine per wk | 71 (28.4) | 41 (28.4) | 16 (30.8) | .99 |
| ESS score >10 | 62 (25.6) | 45 (31.0) | 17 (32.7) | .21 |
| OSAS by PSG, % | ||||
| Mild (AHI ≥5 and ESS>10) | 49 (24.7) | 33 (22.8) | 16 (30.8) | .25 |
| Mod (AHI ≥15 and ESS >10) | 29 (14.7) | 20 (13.8) | 9 (17.3) | .54 |
| Severe (AHI ≥30 and ESS >10) | 15 (7.6) | 10 (6.9) | 5 (9.6) | .53 |
Abbreviations: AHI, apnea‐hypopnea index; BMI, body mass index; ESS, Epworth sleepiness score; MVAP, multivariable apnea prediction score; NC, neck circumference; OSAS, obstructive sleep apnea syndrome; PSG, polysomnography; SD, standard deviation.
A total of 198 participants (146 in the estimation sample and 52 in the validation sample) underwent in‐laboratory PSG.
Figure 3.
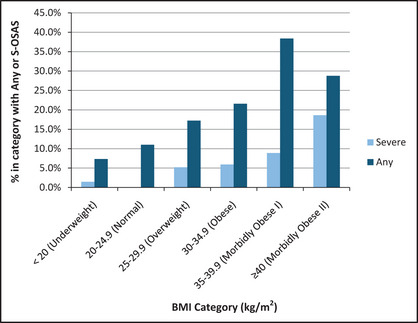
Frequency distribution of obstructive sleep apnea by body mass index category (BMI). s‐OSAS indicates severe obstructive sleep apnea syndrome.
Apnea Risk
The mean (SD) for MVAP scores (n=224) was 0.53 (0.25). The mean (SD) morphometric score (n=160) was 68.5 (24.7); the score could not be computed for the remaining participants because of missing molars. Whereas a score of ≥70 carried 98% sensitivity and 100% specificity in a prior study,17 in our study, the optimal cutpoint of 80 yielded a sensitivity of 66.9%, a specificity of 70.1%, and a NPTP of 0.6% for s‐OSAS.
In‐Laboratory Sleep Studies
Of 198 of 250 (79.2%) who agreed to in‐laboratory PSG, 159 (80%) had OSA: 67 (34%) mild (AHI 5–14.9/hour); 43 (22%) moderate (AHI 15–29.9/hour); and 49 (25%) severe (AHI ≥30/hour). Sleepiness (ESS >10) occurred in 62 of 242 (25.6%) patients. A total of 49 patients (24.7%) had at least mild OSAS (AHI ≥5/hour plus ESS >10), and 15 patients (7.6%) had s‐OSAS (AHI ≥30/hour plus ESS >10) (Table 1). The cohort's mean (SD) AHI was 22.5 (22.9)/hour.
Unattended Sleep Studies
Of 208 patients who agreed to unattended HST, 192 had adequate recordings. Of these, 76.9% had usable data after one attempt, and an additional 20.2% after a second attempt. The mean (SD) uAHI was 15 (13.8) per hour. A total of 25.7% had uAHI ≥5/hour with ESS >10, and 6% had uAHI ≥30/hour with ESS >10. Unattended HST underestimated in‐laboratory AHI for values between 33/hour and 45/hour (Figure 4).
Figure 4.
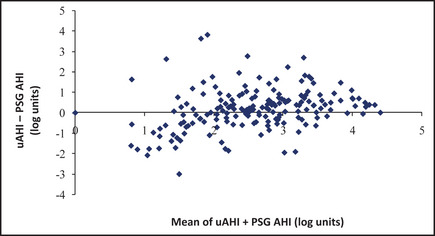
Bland‐Altman analysis. Unattended sleep studies tended to underestimate in‐laboratory AHI for an approximate value of 3.5 to 3.8 log units/hour, which corresponds to an average of portable Apnea‐Hypopnea Index (AHI) + polysomnography (PSG) AHI of 33 to 45 per hour. We used log transformation of the AHIs in our prediction models to reduce the undue influence of large values. uAHI indicates AHI from unattended home sleep test.
AUCs and Percent Difference of s‐OSAS
AUCs in the estimation and validation subsets are listed for single‐stage and 2‐stage models, along with percent difference between those subsets (Table 2). All single‐stage models were robust, with percent difference ranging from −0.1% to 13.3%, and all (except age) had similar discriminatory power, with AUCs ranging from 0.663 for symptoms to 0.689 for NC (most useful). Age was not a useful single‐stage model, with an AUC of 0.463.
Table 2.
Relative Discriminatory Power and Robustness of Models Used in Single‐ and 2‐Stage Algorithms (N=250)
| Model | Single‐Stage Models | Two‐Stage Modelsa | ||
|---|---|---|---|---|
| AUC, Estimation Sample (95% CI) | Difference,b % | AUC, Estimation Sample (95% CI) | Difference,b % | |
| NC | 0.689 (0.674–0.704) | 5.1 | 0.803 (0.786–0.820) | −0.1 |
| Morphometrics | 0.685 (0.663–0.707) | 4.5 | 0.816 (0.801–0.830) | 8.2 |
| MVAP | 0.684 (0.668–0.700) | 1.4 | 0.799 (0.777–0.822) | 6.6 |
| BMI | 0.665 (0.646–0.685) | 7.2 | 0.768 (0.744–0.793) | 7.8 |
| Symptoms | 0.663 (0.640–0.685) | 6.3 | 0.735 (0.710–0.760) | 3.7 |
| Age | 0.463 (0.444–0.481) | 13.3 | 0.718 (0.700–0.737) | 6.7 |
Abbreviations: AUC, area under the receiver operating characteristic curve; BMI, body mass index; CI, confidence interval; MVAP, Multivariable Apnea Prediction Score; NC, neck circumference. Bold values indicate the top 3 performing models.
Model applied as first stage, followed by home sleep testing for those in the intermediate‐risk group.
Difference=(AUC in validation sample – AUC in estimation sample)/(AUC in estimation sample)
The 2‐stage models (Table 2) using HST in the second stage were more accurate than single‐stage models, with higher AUC values ranging from 0.718 (age) to 0.816 (morphometrics). The most useful single‐stage model, NC, performed better when combined with unattended sleep studies, yielding an AUC of 0.803. The top 3 performing 2‐stage models (AUCs near or above 0.800) were NC, morphometrics, and MVAP.
Accuracy of Models: Sensitivity, Specificity, NPTP of s‐OSAS
We report the accuracy of these single‐ and 2‐stage models (Table 3, upper and lower panels, respectively). In the single‐stage model, use of MVAP ≥0.483 had the greatest sensitivity for detecting s‐OSAS (91.5%), and the second‐lowest NPTP for s‐OSAS (1.5%). Use of NC ≥42.6 cm had similar sensitivity (85.6%) and NPTP (1.7%). Facial morphometrics score ≥80.0 offered the highest specificity (70.1%) but the second‐lowest sensitivity (66.9%) for detecting s‐OSAS, with the lowest NPTP of s‐OSAS among single‐stage models (0.6%).
Table 3.
Discriminatory Power of Models for Predicting Severe Obstructive Sleep Apnea Syndromea
| Single‐Stage Model | Cutpoint | SENS | SPEC | Neg LR | NPTP |
|---|---|---|---|---|---|
| NC, cm | 42.550 | 0.856 | 0.510 | 0.244 | 0.017 |
| Morphometrics | 79.998 | 0.669 | 0.701 | 0.473 | 0.006 |
| MVAP | 0.483 | 0.915 | 0.439 | 0.190 | 0.015 |
| BMI, kg/m2 | 30.937 | 0.819 | 0.505 | 0.334 | 0.018 |
| Symptoms | 1.000 | 0.774 | 0.551 | 0.394 | 0.035 |
| Age, y | 48.275 | 0.629 | 0.299 | 1.641 | 0.029 |
| Two‐Stage Model | LB | UB | HST Cutpoint | SENS | SPEC | Neg LR | NPTP |
|---|---|---|---|---|---|---|---|
| NC, cm | 40.65 | 46.55 | 23.5 | 0.836 | 0.770 | 0.212 | 0.020 |
| Morphometrics | 40 | 95 | 23.25 | 0.942 | 0.689 | 0.076 | 0.037 |
| MVAP | 0.41 | 0.79 | 18 | 0.882 | 0.716 | 0.162 | 0.015 |
| BMI, kg/m2 | 25 | 41.25 | 23.75 | 0.829 | 0.708 | 0.219 | 0.027 |
| Symptoms | 1.2 | 3.1 | 20 | 0.629 | 0.840 | 0.442 | 0.031 |
| Age, y | 32.5 | 65 | 15.25 | 0.743 | 0.694 | 0.368 | 0.119 |
Abbreviations: BMI, body mass index; HST, home sleep testing; LB, lower bound; MVAP, Multivariable Apnea Prediction Score; NC, neck circumference; NegLR, negative likelihood ratio; NPTP, Negative post‐test probability; SENS, sensitivity; SPEC, specificity; uAHI, Apnea‐Hypopnea Index (AHI) from unattended home sleep test; UB, upper bound.
Severe obstructive sleep apnea syndrome=AHI ≥30 events/h + Epworth Sleepiness Scale >10.
For unattended sleep studies used alone (Table 4), the optimal cutpoint for detecting s‐OSAS was 16 events per hour with a sensitivity of 74.7%, a specificity of 70.6%, an LRneg of 0.357, and an NPTP of 2.9%.
Table 4.
Discriminatory Power of Home Sleep Testing for Any or Severe Obstructive Sleep Apnea Syndrome
| HST Cutpoint (uAHI) | AUC | SENS | SPEC | Neg LR | NPTP | |
|---|---|---|---|---|---|---|
| Severe OSAS | 16.0 | 0.727 | 0.747 | 0.706 | 0.357 | 0.029 |
| Any OSAS | 8.9 | 0.591 | 0.718 | 0.478 | 0.573 | 0.159 |
Abbreviations: AUC, area under the receiver operating characteristic curve; HST, home sleep testing; NegLR, negative likelihood ratio; NPTP, Negative post‐test probability; SENS, sensitivity; s‐OSAS, severe obstructive sleep apnea syndrome; SPEC, specificity; uAHI, Apnea‐Hypopnea Index from unattended HST. Apnea‐Hypopnea Index [AHI] ≥30 events/h + Epworth Sleepiness Scale [ESS] >10). Any OSAS = AHI ≥5 events/h + ESS >10.
We evaluated HST when it was used in tandem with single‐stage models (MVAP, NC, facial morphometry). The optimal upper and lower bounds for these first‐stage tests, and optimal cutpoint for HST are shown in Table 3 (lower panel). We found that: (1) MVAP followed by HST had 88.2% sensitivity, 71.6% specificity, and 1.5% NPTP; (2) NC followed by HST had a sensitivity of 83.6% and a specificity of 77.0% with n NPTP of 2.0%; and (3) Facial morphometry followed by HST identified s‐OSAS with 94.2% sensitivity, 68.9% specificity, and 3.7% NPTP, but morphometry was not feasible in 64 of 224 (28.6%) patients because of the absence of teeth.
Accuracy of Models of Any OSAS
AUCs in the estimation and validation subsets using criteria for any OSAS (AHI ≥5 events per hour; ESS >10) are listed for single‐stage and 2‐stage models (Table 5). This definition yielded a higher prevalence of 22.9%. All models were less useful for predicting any OSAS than for predicting s‐OSAS.
Table 5.
Discriminatory Power of Models for Predicting Any Obstructive Sleep Apnea Syndromea
| Single‐Stage Model | AUC | Cutpoint | SENS | SPEC | Neg LR | NPTP |
|---|---|---|---|---|---|---|
| NC, cm | 0.612 | 42.650 | 0.849 | 0.520 | 0.254 | 0.078 |
| Morphometrics | 0.579 | 50.976 | 0.872 | 0.299 | 0.428 | 0.124 |
| MVAP | 0.614 | 0.559 | 0.694 | 0.565 | 0.524 | 0.148 |
| BMI, kg/m2 | 0.609 | 29.168 | 0.794 | 0.444 | 0.460 | 0.132 |
| Symptoms | 0.630 | 0.916 | 0.790 | 0.537 | 0.380 | 0.112 |
| Age, y | 0.507 | 45.825 | 0.780 | 0.236 | 1.013 | 0.251 |
| Two‐Stage Model | AUC | LB | UB | HST Cutpoint | SENS | SPEC | Neg LR | NPTP |
|---|---|---|---|---|---|---|---|---|
| NC, cm | 0.658 | 39.1 | 43.4 | 21 | 0.733 | 0.584 | 0.436 | 0.126 |
| Morphometrics | 0.658 | 31 | 96 | 11.25 | 0.867 | 0.449 | 0.279 | 0.085 |
| MVAP | 0.672 | 0.255 | 0.69 | 13.5 | 0.805 | 0.540 | 0.349 | 0.104 |
| BMI, kg/m2 | 0.649 | 24 | 36.25 | 13.5 | 0.789 | 0.509 | 0.394 | 0.115 |
| Symptoms | 0.652 | 1.175 | 3.175 | 20 | 0.580 | 0.723 | 0.578 | 0.161 |
| Age, y | 0.606 | 30.75 | 59.25 | 11 | 0.772 | 0.441 | 0.436 | 0.126 |
Abbreviations: AUC, area under the receiver operating characteristic curve; BMI, body mass index; HST, home sleep testing; LB, lower bound; MVAP, multivariable apnea prediction score; NC, neck circumference; NegLR, negative likelihood ratio; NPTP, Negative post‐test probability; SENS, sensitivity; SPEC, specificity; uAHI, Apnea‐Hypopnea Index (AHI) from unattended HST; UB, upper bound.
Any obstructive sleep apnea syndrome = AHI ≥5 events/h + Epworth Sleepiness Scale >10.
Unattended HSTwas not useful in case‐finding any OSAS (AUC=0.591) (Table 4). Overall, 2‐stage models that screen for any OSAS (Table 5, lower panel) were significantly less useful than 2‐stage models that screen for s‐OSAS (AUC range=0.606–0.672 vs 0.718–0.816, respectively; Table 3, lower panel).
Missing Data
Multiple imputations did not introduce significant bias. Percent difference in AUC between pre‐imputation and post‐imputation data was minimal (0.2% for NC) to absent (all other single‐stage models).
Discussion
Among hypertensive outpatients, between 30% and 40% have OSA.32 Our case definition, severe OSAS with sleepiness, was selected based on data from the Sleep Heart Health Study (SHHS),11 which suggested that self‐reported sleepiness may indicate susceptibility to cardiovascular sequelae of OSA and mark patients who should receive treatment priority. BP reduction may also be greater in OSA patients who receive PAP treatment and report sleepiness.4, 9, 10 Even with this added criterion, the proportion of our cohort with s‐OSAS was nearly twice that of other middle‐aged populations.33 This finding is not surprising, given the high prevalence of risk factors for OSA among veterans, including hypertension, obesity, male sex, African American race, and habitual alcohol consumption (Table 1).34
Single‐stage models with the best discriminatory power in screening for s‐OSAS were NC, facial morphometrics, and MVAP. MVAP and NC proved particularly good screening tools with sensitivities of 91.5% and 85.6%, respectively, at optimal cutpoints of 0.483 for MVAP and 42.6 cm for NC. Morphometry was less feasible than MVAP or NC because 28.6% of the sample lacked first, second, or third molars; therefore, intermolar distance could not be measured to compute the facial morphometry score. Given the relative ease of measuring NC in routine clinical practice, our findings support its utility for initial patient evaluation for s‐OSAS.
Despite its mathematical complexity,16 the MVAP can be computed using mobile, desktop, or Web‐based applications using easily obtainable clinical information, which makes the MVAP a viable option in mass s‐OSAS screening. MVAP calculation also lends itself well to emerging technologies such as sleep telemedicine, where BMI, sex, age, and symptoms can be obtained remotely and used to obtain the risk score.
Each of the 3 top‐performing single‐stage models demonstrated improved discriminatory power when used in tandem with HST. Facial morphometrics followed by HST showed the best power (AUC=0.816), although NC and MVAP were almost as powerful in the 2‐stage models (AUCs=0.803 and 0.799, respectively). In all models, combining easily obtainable clinical information combined with HST (cut point AHI=16 events per hour) increased discriminatory power with higher AUC values.
We evaluated the impact that 2‐stage algorithms would have on the volume of in‐laboratory PSGs. The 2‐stage models using NC, MVAP, or BMI were negative for s‐OSAS 66% to 67% of the time. Given a missed case rate of only 0.5% to 1% in this group, one could argue that confirmatory PSGs are probably not justified on an economic basis, unless the cost of missing a case proved to be inordinately high. A reduction in in‐laboratory PSGs by 66% to 67% may not only lower diagnostic costs, but also reduce patient burden, while increasing availability and accessibility of in‐laboratory studies for those who are not candidates for unattended studies. Given the potential for adverse health effects of missing cases, the low missed case rate is a desirable feature of this program.
All models had less discriminatory power when we considered OSAS cases of any severity. HST alone was marginally useful, with an AUC of only 0.591 for identifying any OSAS. Adding clinical data to these studies improved accuracy in finding any OSAS only modestly; AUC ranges 0.606 to 0.672 for 2‐stage models.
Our hypopnea definition did not require desaturation. This liberal definition is appropriate because it reduces the likelihood of missing cases during screening. Used for Medicare coverage for PAP, definitions that require desaturation12 would lower disease prevalence, and therefore improve the negative predictive value of our screening models. Additionally, our study reveals a modest decline in HST sensitivity for detecting any OSA (AHI ≥5 events per hour) when pulse oximetry is not considered. HST devices incorporating pulse oximetry have a sensitivity of at least 82.5% for detecting any OSA,35 while our AutoSet‐based scoring had 74.7% sensitivity.
Feasibility
We conducted unattended sleep studies in 208 of 250 (83.2%) patients. We obtained usable data in 192 of 208 (92.3%) patients. Only 48 of 208 (23.1%) patients required repeat testing. Similar failure rates were found in another study.36 Future monitors may be simpler to assemble, yet more accurate and successful. While we obtained BMI, NC, and symptom scores in nearly everyone, absent molars precluded us from obtaining morphometric scores in nearly one third of patients.
Comparison With Prior Studies and Limitations in Design
Symptoms were useful in our cohort, contrasting with other sleep center cohorts.16 In our nonreferral, more obese group, symptoms added robustness to the results, yielding comparable AUCs in the validation and estimation samples. Thus, symptoms may be useful in general populations outside of sleep centers who have a high prevalence of OSA‐related risk factors. Symptom data may be less useful, however, in occupational screening, where reporting may be inaccurate.19
BMI was a powerful predictor of OSA in prior studies,17, 19 with AUCs of 0.938 and 0.802, respectively. BMI was less useful in our program, with an AUC of 0.665. We calculated the coefficient of variation (CV = SD/mean*100%) to assess whether BMI was less useful in our group caused by lower variance. However, a CV of 22.9% in our study was comparable to a CV of 23.1% reported elsewhere.17 We surmise that unmeasured risk factors for OSA among the nonobese patients in our group may have reduced the utility of BMI in this study. Additionally, exclusion of nonhypertensive patients may have degraded BMI predictive value.
HST tended to underestimate in‐laboratory AHI for the 33 to 45 event per hour range. These findings are similar to those from previous reports comparing HST and in‐laboratory PSG.37 AHI on PSG is calculated as the number of respiratory events per hour of sleep, while HST monitors this index based on hour of use. Since HST cannot differentiate sleep from wakefulness, its respiratory indices may be lower than those seen on PSG.
Additionally, our AutoSet device utilized only nasal cannula pressure changes to identify apneas and hypopneas, as opposed to full PSG, which utilizes nasal pressure and an oronasal thermistor in respiratory event detection. When using nasal pressure alone (without a thermistor) to detect respiratory events, less‐stringent criteria to score respiratory events may reduce missed cases without raising false‐positive rates.38 Monitors that use more stringent criteria for scoring events than those used by the AutoSet may miss more cases and reduce the usefulness of unattended HST.
Strengths and Limitations
Ours is the first investigation of screening for OSAS among a general population of hypertensive outpatients, rather than sleep center referrals,22 with unattended recordings of airflow and respiratory effort at home (HST).21 The AASM has published guidelines22 and the Centers for Medicare and Medicaid Services has approved the use of this type of monitor for diagnosing OSA and initiating PAP therapy.39 The strengths of this investigation include: (1) prospective application of HST and full PSG, after administration of first‐stage screening tools; (2) blinding of PSG scorers to all other clinical data; (3) the use of a general medical rather than subspecialty‐based population; and (4) use of a definition of hypertension that is consistent with that used in prior investigations, such as the SHHS.2
Given that our sample was comprised largely of Caucasian and African American men, additional studies are needed to refine these models for other ethnic groups in whom s‐OSAS may occur in thin individuals with intraoral or craniofacial risk factors,40, 41, 42 and symptoms may be more important.16 The limited proportion of women (20%) in this largely veteran population reduces our ability to generalize these results to them. Similarly, while age was more useful in other settings, single‐stage models that contained age in this cohort had AUC <0.7, perhaps because of the restriction of our sample to patients 30 to 65 years. Future evaluations of OSA screening strategies should include other ethnic, sex, and age groups.
Conclusions
Two‐stage models can be used to screen for s‐OSAS to reduce the requirement for in‐laboratory PSG in hypertensive outpatients, a population with high disease prevalence.2 Models using a facial morphometric score, NC, and the MVAP at optimal cutpoints as the first stage in these models demonstrated greatest utility. They are less helpful in screening patients for OSAS of any severity. Unattended HST works best when used in tandem with clinical data rather than used alone, particularly in screening for any OSAS, because of the high likelihood of missed cases.
Competing Interests and Funding
This work was supported by National Institutes of Health grant K23 RR16068, RO1‐OH009149, T32 HL07713, and by the Veterans Integrated Services Network 4 Competitive Pilot Project Fund. ResMed, Inc provided an unrestricted loan for use of portable diagnostic sleep study equipment (AutoSet) and had no role in protocol development, data collection, storage, analysis, or manuscript preparation.
J Clin Hypertens (Greenwich). 2013;00: 00–00. ©2013 Wiley Periodicals, Inc.
References
- 1. Chobanian AV, Bakris GL, Black HR, et al. The seventh report of the joint national committee on prevention, detection, evaluation, and treatment of high blood pressure: the JNC 7 report. JAMA. 2003;289:2560–2572. [DOI] [PubMed] [Google Scholar]
- 2. Nieto FJ, Young TB, Lind BK, et al. Association of sleep‐disordered breathing, sleep apnea, and hypertension in a large community‐based study. Sleep Heart Health Study. JAMA. 2000;283:1829–1836. [DOI] [PubMed] [Google Scholar]
- 3. Peppard PE, Young T, Palta M, et al. Prospective study of the association between sleep‐disordered breathing and hypertension. N Engl J Med. 2000;342:1378–1384. [DOI] [PubMed] [Google Scholar]
- 4. Becker HF, Jerrentrup A, Ploch T, et al. Effect of nasal continuous positive airway pressure treatment on blood pressure in patients with obstructive sleep apnea. Circulation. 2003;107:68–73. [DOI] [PubMed] [Google Scholar]
- 5. Pepperell JC, Ramdassingh‐Dow S, Crosthwaite N, et al. Ambulatory blood pressure after therapeutic and subtherapeutic nasal continuous positive airway pressure for obstructive sleep apnoea: a randomised parallel trial. Lancet. 2002;359:204–210. [DOI] [PubMed] [Google Scholar]
- 6. Duran‐Cantolla J, Aizpuru F, Montserrat JM, et al. Continuous positive airway pressure as treatment for systemic hypertension in people with obstructive sleep apnoea: randomised controlled trial. BMJ. 2010;341:c5991. [DOI] [PubMed] [Google Scholar]
- 7. Haentjens P, Van Meerhaeghe A, Moscariello A, et al. The impact of continuous positive airway pressure on blood pressure in patients with obstructive sleep apnea syndrome: evidence from a meta‐analysis of placebo‐controlled randomized trials. Arch Intern Med. 2007;167:757–764. [DOI] [PubMed] [Google Scholar]
- 8. Flemons WW, Buysse D, Redline S, et al. Sleep‐related breathing disorders in adults: recommendations for syndrome definition and measurement techniques in clinical research. The report of an American Academy of Sleep Medicine task force. Sleep. 1999;22:667–689. [PubMed] [Google Scholar]
- 9. Barbe F, Mayoralas LR, Duran J, et al. Treatment with continuous positive airway pressure is not effective in patients with sleep apnea but no daytime sleepiness. A randomized, controlled trial. Ann Intern Med. 2001;134:1015–1023. [DOI] [PubMed] [Google Scholar]
- 10. Robinson GV, Stradling JR, Davies RJ. Obstructive sleep apnoea/hypopnoea syndrome and hypertension. Thorax. 2004;59:1089–1094. [DOI] [PMC free article] [PubMed] [Google Scholar]
- 11. Kapur VK, Resnick HE, Gottlieb DJ, et al. Sleep disordered breathing and hypertension: does self‐reported sleepiness modify the association? Sleep. 2008;31:1127–1132. [PMC free article] [PubMed] [Google Scholar]
- 12. Baumel MJ, Maislin G, Pack AI. Population and occupational screening for obstructive sleep apnea: are we there yet? Am J Respir Crit Care Med. 1997;155:9–14. [DOI] [PubMed] [Google Scholar]
- 13. Somers VK, White DP, Amin R, et al. Sleep apnea and cardiovascular disease. An American Heart Association/American College of Cardiology Foundation scientific statement from the American Heart Association Council for High Blood Pressure Research Professional Education Committee, Council on Clinical Cardiology, Stroke Council, and Council on Cardiovascular Nursing. In collaboration with the National Heart, Lung, and Blood Institute National Center on Sleep Disorders Research (National Institutes of Health). Circulation. 2008;118:1080–1111. [DOI] [PubMed] [Google Scholar]
- 14. Viner S, Szalai JP, Hoffstein V. Are history and physical examination a good screening test for sleep apnea? Ann Intern Med. 1991;115:356–359. [DOI] [PubMed] [Google Scholar]
- 15. Hoffstein V, Szalai JP. Predictive value of clinical features in diagnosing obstructive sleep apnea. Sleep. 1993;16:118–122. [PubMed] [Google Scholar]
- 16. Maislin G, Pack AI, Kribbs NB, et al. A survey screen for prediction of apnea. Sleep. 1995;18:158–166. [DOI] [PubMed] [Google Scholar]
- 17. Kushida CA, Efron B, Guilleminault C. A predictive morphometric model for the obstructive sleep apnea syndrome. Ann Intern Med. 1997;127:581–587. [DOI] [PubMed] [Google Scholar]
- 18. Kushida CA, Littner MR, Morgenthaler T, et al. Practice parameters for the indications for polysomnography and related procedures: an update for 2005. Sleep. 2005;28:499–521. [DOI] [PubMed] [Google Scholar]
- 19. Gurubhagavatula I, Maislin G, Nkwuo JE, et al. Occupational screening for obstructive sleep apnea in commercial drivers. Am J Respir Crit Care Med. 2004;170:371–376. [DOI] [PubMed] [Google Scholar]
- 20. Gurubhagavatula I, Maislin G, Pack AI. An algorithm to stratify sleep apnea risk in a sleep disorders clinic population. Am J Respir Crit Care Med. 2001;164:1904–1909. [DOI] [PubMed] [Google Scholar]
- 21. Ng SS, Chan TO, To KW, et al. Validation of Embletta portable diagnostic system for identifying patients with suspected obstructive sleep apnoea syndrome (OSAS). Respirology. 2010;15:336–342. [DOI] [PubMed] [Google Scholar]
- 22. Collop NA, Anderson WM, Boehlecke B, et al. Clinical guidelines for the use of unattended portable monitors in the diagnosis of obstructive sleep apnea in adult patients. Portable monitoring task force of the American Academy of Sleep Medicine. J Clin Sleep Med. 2007;3:737–747. [PMC free article] [PubMed] [Google Scholar]
- 23. Marin JM, Carrizo SJ, Eugenio V, Agusti AGN. Long‐term cardiovascular outcomes in men with obstructive sleep apnoea‐hypopnoea with or without treatment with cotinuuous positive airway pressure: an observational study. Lancet. 2005;365:1046–1053. [DOI] [PubMed] [Google Scholar]
- 24. Johns MW. A new method for measuring daytime sleepiness: the Epworth sleepiness scale. Sleep. 1991;14:540–545. [DOI] [PubMed] [Google Scholar]
- 25. Kiely JL, Delahunty C, Matthews S, et al. Comparison of a limited computerized diagnostic system (rescare autoset) with polysomnography in the diagnosis of obstructive sleep apnoea syndrome. Eur Respir J. 1996;9:2360–2364. [DOI] [PubMed] [Google Scholar]
- 26. Rechtschaffen A, Kales A. A manual of standardized terminology, techniques and scoring system for sleep stages of human subjects. Washington, DC: U.S. Government Printing Office; 1968. [DOI] [PubMed] [Google Scholar]
- 27. Wayman JC. Multiple imputation for missing data: What is it and how can I use it. Center for Social Organization of Schools. Johns Hopkins University. Presented at Annual meeting of the American Educational Research Association, Chicago, IL; 2003.
- 28. Simel DL, Samsa GP, Matchar DB. Likelihood ratios with confidence: sample size estimation for diagnostic test studies. J Clin Epidemiol. 1991;44:763–770. [DOI] [PubMed] [Google Scholar]
- 29. Gonen M. Analyzing receiver operating characteristic curves with SAS. Cary, NC: SAS Institute, Inc.; 2007. [Google Scholar]
- 30. Gurubhagavatula I, Maislin G, Nkwuo JE, Pack AI. Occupational screening for obstructive sleep apnea in commercial drivers. Am J Respir Crit Car Med. 2004;170:371–631. [DOI] [PubMed] [Google Scholar]
- 31. Morales CR, Hurley S, Wick LC, Staley B, Pack FM, Gooneratne NS, Maislin G, Pack A, Gurbhagavatula I. In‐home, self‐assembled sleep studies are useful in diagnosing sleep apnea in the elderly. Sleep. 2012;35:1491–1501. [DOI] [PMC free article] [PubMed] [Google Scholar]
- 32. Worsnop CJ, Naughton MT, Barter CE, Morgan TO, Anderson AI, Pierce RJ. The prevalence of obstructive sleep apnea in hypertensives. Am J Respir Crit Care Med. 1998;157:111–115. [DOI] [PubMed] [Google Scholar]
- 33. Young T, Palta M, Dempsey J, et al. The occurrence of sleep‐disordered breathing among middle‐aged adults. N Engl J Med. 1993;328:1230–1235. [DOI] [PubMed] [Google Scholar]
- 34. Caples SM, Gami AS, Somers VK. Obstructive sleep apnea. Ann Intern Med. 2005;142:187–197. [DOI] [PubMed] [Google Scholar]
- 35. Collop NA, Tracy SL, Kapur V, et al. Obstructive sleep apnea devices for out‐of‐center (OOC) testing: technology evaluation. J Clin Sleep Med. 2011;7:531–548. [DOI] [PMC free article] [PubMed] [Google Scholar]
- 36. Kuna ST, Gurubhagavatula I, Maislin G, et al. Noninferiority of functional outcome in ambulatory management of obstructive sleep apnea. Am J Respir Crit Care Med. 2011;183:1238–1244. [DOI] [PubMed] [Google Scholar]
- 37. Ayappa I, Norman RG, Suryadevara M, Rapoport DM. Comparison of limited monitoring using a nasal‐cannula flow signal to full polysomnolgraphy in sleep‐disordered breathing. Sleep. 2004;27:1171–1179. [DOI] [PubMed] [Google Scholar]
- 38. Thornton AT, Singh P, Ruehland WR, Rochford PD. AASM criteria for scoring respiratory events: interaction between apnea sensor and hypopnea definition. Sleep. 2012;35:425–432. [DOI] [PMC free article] [PubMed] [Google Scholar]
- 39. Department of Health and Human Services, Center for Medicare and Medicaid Services . Decision memo for continuous positive airway pressure (CPAP) therapy for obstructive sleep apnea (OSA). 13 March 2008. www.cms.hhs.gov/mcd/viewdecisionmemo.asp?id=204 (accessed 23 December 2010).
- 40. Kim J, In K, Kim J, et al. Prevalence of sleep‐disordered breathing in middle‐aged Korean men and women. Am J Respir Crit Care Med. 2004;170:1108–1113. [DOI] [PubMed] [Google Scholar]
- 41. Udwadia ZF, Doshi AV, Lonkar SG, et al. Prevalence of sleep‐disordered breathing and sleep apnea in middle‐aged urban Indian men. Am J Respir Crit Care Med. 2004;169:168–173. [DOI] [PubMed] [Google Scholar]
- 42. Lee RWW, Vasudavan S, Hui DS, et al. Differences in craniofacial structures and obesity in Caucasian and Chinese patients with obstructive sleep apnea. Sleep. 2010;33:1075–1080. [DOI] [PMC free article] [PubMed] [Google Scholar]