

Abstract
The discovery of small molecule ligands targeted to the surface of live pathogenic bacteria would enable an entirely new class of antibiotics. We report the development and validation of a microarray-based high-throughput screening platform for bacteria that exploits 300 μm diameter chemical spots in a 1” × 3” nano-layered glass slide format. Using 24 model compounds and 4 different bacterial strains we optimized the screening technology, including fluorophore-based optical deconvolution for automated scoring of affinity and cyan-magenta-yellow-black (CMYK) color-coding for scoring of both affinity and specificity. The latter provides a lossless, one-dimensional view of multidimensional data. By linking in silico analysis with cell binding affinity and specificity, we could also begin to identify the physicochemical factors that affect ligand performance. The technology we describe could form the foundation for developing new classes of antibiotics.
Keywords: High-throughput screening, Microarray system, Cell-based assay, Drug discovery, Pathogenic bacteria
INTRODUCTION
The use of antibiotics to treat infection has been one of the great advances in medicine. However, the increasing drug resistance of pathogens in the hospital setting poses a serious and potentially devastating problem.1,2
Conventional antibiotics are engineered to interfere with one or more cellular processes, including protein synthesis, energy production, and cell wall formation to name a few. However, due to redundancies in cellular pathways and a high mutation rate leading to resistance, chemical pathway inhibition is becoming harder and harder over time.3,4 And, because molecules typically have to be highly hydrophobic to penetrate the cell wall and membrane, potentially available chemical space is greatly reduced and transcellular transport itself becomes a mechanism of resistance. Nevertheless, many high-throughput techniques for screening antibiotics have been reported, with most utilizing 384-well or 1,536-well formats.5-9
An alternative approach is to focus on the outermost interactions that the cell makes with its environment. For example, one of the first events in pathogenesis is the interaction of bacteria with various environmental epitopes.10,11 Thus, discovering ligands that bind to the surface of live bacteria could be used to either block key steps in pathogenesis or to combine the targeting ligand with an effector domain, using modular chemistry,12 to create a bifunctional cell killing agent.13
In this study, we mimicked bacteria-host interactions using a nano-layered microarray-based screening system and explored the hypothesis that such a condensed small chip system would permit rapid discovery and analysis of small molecule ligands targeted to the surface of pathogenic bacteria.
EXPERIMENTAL SECTION
Chemicals and Microarray
All chemicals were American Chemical Society grade or higher and commercially available unless noted otherwise. We previously described the preparation of polyethylene glycol N-hydroxysuccinimide (PEG-NHS) functionalized microarray slides.14 Twenty four primary amine-containing compounds were selected as a model library and 10 mM stock solutions prepared in DMSO. Each stock solution was diluted 10 times using 70% glycerol in DMSO, and the pH was adjusted to ≈ 9.0 using diisoproylethylamine (DIEA). Polyallylamine (PAAm) 10-mg/mL stock solution was prepared in 100-mM sodium bicarbonate (pH 9.0) and used as a control. Ligand solutions were distributed into a 384-well plate and printed on the NHS functionalized slide surface using a microarray robot (OmniGrid Accent, DigiLab, Inc., Holliston, MA) mounted with SMP 11 pins (365 micron features with 0.25 μL uptake; TeleChem, Sunnyvale, CA). Each spot contained approximately 3 to 4 nL of sample solution, and was 300 ± 10 μm in diameter. Each spot was placed 500 μm apart on the defined arrays. After incubating for 3 h at room temperature, the slides were immersed in deionized water for 10-15 minutes, rinsed using ethanol, and dried under a nitrogen stream. The ligand-spotted microarray slides used for targeting study were freshly prepared and kept up to 7 days at room temperature under vacuum with nitrogen purging.
Bacterial Culture
Four bacterial strains were grown in the following enriched medium: Columbia agar supplemented with 2% NaCl (Staphylococcus aureus PS80), LB medium with 200 μg/mL carbenicillin (Pseudomonas aeruginosa PAO1), and LB medium with 50 μg/mL ampicillin (Bacillus subtilis and Escherichia coli DH5a). After inoculating the bacteria in fresh LB medium for 24 h at 37 °C with gentle shaking (250 rpm), the bacteria were recovered and diluted in phosphate-buffered saline (PBS). The number of colony forming units (CFU) per milliliter was confirmed by quantitative plate counts.
Fluorescent Staining and Adhesion Assay
We tested staining efficiency of fluorophores having a broad range of excitation wavelengths from blue to near-infrared (NIR). For in vitro optical property measurement, online fiberoptic HR2000 absorbance (200-1000 nm) and USB2000FL fluorescence (350-1000 nm) spectrometers (Ocean Optics, Dunedin, FL) were used. Fluorescence excitation was provided by 532-nm or 665-nm laser diodes (Opcom Inc., Xiamen, China) set to 5 mW and coupled through a 300-mm core diameter, NA 0.22 fiber (Fiberguide Industries, Stirling, NJ). The fluorophores were added to the suspension of each bacterial strain to a final concentration of approximately 1 attomol/cell for 1 h at room temperature. After washing twice with PBS after centrifugation at 5,000 g for 5 min, a ratio of fluorescent signal-to-background (SBR) was observed under a fluorescent microscopy (see below). Stained bacteria cells were seeded onto the ligand-presenting glass slide surface at a density of 1 × 10⁷ cells/cm2 in PBS, and allowed to incubate at room temperature for 2 h to ensure maximum accessibility of bacteria to the ligand surface. During the incubation, no physical agitation was applied to minimize the dissociation rate between the bacteria surface and ligands. The slide was then gently washed with PBS, and the cell adhesion was examined under a fluorescent microscope.
High-Throughput Automated Microscopy System
Fluorescence imaging was conducted using a Nikon TE-2000 epifluorescence microscope equipped with a 10X Plan Fluor lens and 75 W Xenon light source. Standard and custom filter sets (Chroma Technology, Brattleboro, VT) were comprised of the following excitation/dichroic/emission filter wavelengths: blue (340-360 nm/400 nm/430-490 nm), green (460-500 nm/505 nm/505-560 nm), red (525-555 nm/565 nm/ 590-650 nm), and NIR (725-775 nm/785 nm/790-830 nm), respectively. For automatic stage movement, a stepper-based Velmex BiSlider (Bloomfield, NY) mounted to a custom 15” × 15” frame was integrated into the microscope, and a custom slide-stage made from flat cast aluminum plate was designed to hold 50 slides and mounted on the BiSlider frame. A custom program for stage-control was developed in LabView v8.2 (National Instruments, Austin, TX). Nikon NIS Element equipped with 2-D deconvolution module (AutoQuant Imaging, Inc., Watervliet, NY) was used for acquisition and postimaging processing.
Data Plotting and Analysis
In silico physicochemical properties of each ligand were calculated using Marvin and JChem calculator plugins (ChemAxon, Budapest, Hungary). Data plotting was performed using Prism (GraphPad Software, Inc., San Diego, CA). The CMYK (Cyan, Magenta, Yellow, Key) color code was generated using Microsoft Excel 2004 (Redmond, WA).
RESULTS
High-Throughput Screening System
We previously described a rapid (≈ 20 min) and facile method to prepare functional microarray slides using microwave irradiation.14 Polyethylene glycol (PEG, 4 kDa) was used to provide an inert surface that lowered nonspecific cellular adhesion while permitting chemical reactivity. We designed the terminal group on the slide surface to be an NHS ester for one-step covalent conjugation to primary amine-containing ligand candidates through an amide linkage (Fig. 1a). We also reported a ligand printing technique that exploited a 108 × 47 grid of 300 μm chemical spots on a 1” × 3” glass microarray plate.14 This provided high compression of chemical information compared to well-plate screening, yet also provided a high dynamic range of ≈ 5,000 bacteria cells per chemical spot. Using this technology, we have now designed a high-throughput workflow, which enables several thousand ligands to be discovered, analyzed, and optimized in a single loop (Fig. 1b). To eliminate human intervention wherever possible, we engineered a robotic platform that completely automates virtual chemical enumeration, library synthesis, microarraying, and target identification.14,15 Through incorporation of live cell scoring and in silico profiling (gray colored squares in Fig. 1b), we created a complete small chip system for library screening, analysis, and optimization.
Figure 1. Microarray-based high-throughput screening strategy for live bacteria.
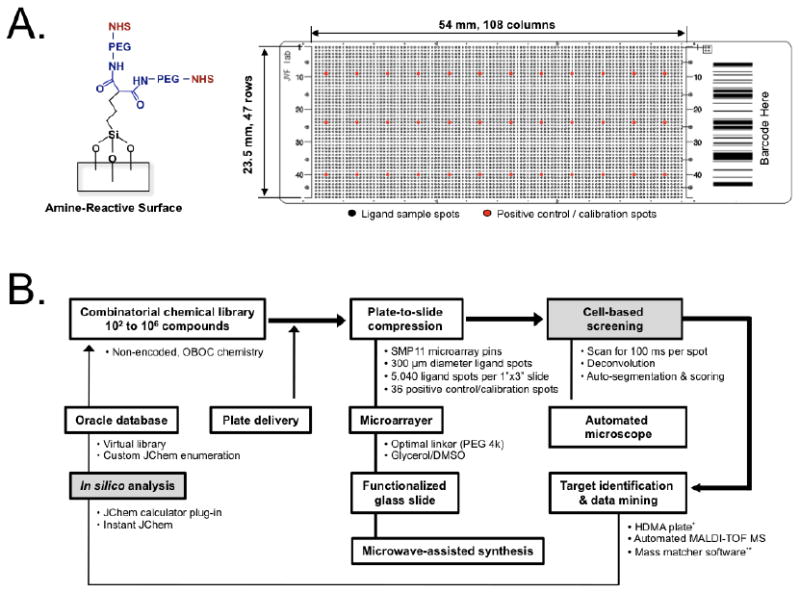
A) Amine-reactive, functionalized microarray slide with a 4 kDa PEG-linker (left) and 5,076 spot array providing 14× compaction of chemical information versus a 384 well-plate (right). B) Overview of the screening platform. The steps addressed in this study are shown as gray boxes. * HDMA plate: High-Density Micropatterned Array (Hudson Surface Technology, Inc., Newark, NJ); ** Mass Matcher: a custom chemoinformatics tool.
Live Cell Imaging and Quantitative Scoring
We developed fluorescent labeling protocols that permitted up to 4 different bacteria to be screened per experiment. These protocols were based on multispectral and multiplexed imaging and resulted from the testing of 14 organic dyes spanning the visible and NIR spectral range (Table S1). Bacteria included two gram-positive strains (Staphylococcus aureus, S.A. and Bacillus subtilis, B.S.), and two gram-negative strains (Pseudomonas aeruginosa, P.A. and Escherichia coli, E.C.), all of which have been linked to major human diseases. The four different wavelength fluorophores were selected for 4-channel imaging based on their relatively high live cell staining efficiency: blue (SYTO BC), green (SYTO 61), red (ESNF-10), and NIR (IR-786).16,17 Unlike nucleic acid probes (SYTO BC and SYTO 61), ESNF-10 and IR786 accumulated into intracellular membranes rapidly14; their optical properties and live cell images are shown in Figure S1. As a result, 4-D acquisitions to score affinity and specificity could be achieved in a single screening process.
We then selected 24 primary amine-containing small molecule ligands as a model library (Fig. 2). Polyallylamine (PAAm) was used as a positive control that binds all bacterial cells. The other 23 compounds represented a wide range of molecular weights, chemical classes, and chemical structure. Ligands were arrayed on the PEG-NHS slides under glycerol-containing aprotic conditions (70% glycerol/DMSO/DIEA, pH 9.0). The chemical modification was determined by surface contact angles with the static sessile drop method using a Mouse-X (SurfaceTech Co., Seoul, South Korea). Due to the water drop size, larger ROI (300 × 300 mm) sample spots were prepared, and deionized water drops were placed 3 times on the surface in an ambient environment. The average contact angle ± SEM of each ligand was included in Table S2. Although the highly nucleophilic primary amine is the major species to react with the NHS ester on the microarray slide, minor regioselective reactions are expected for small molecules containing multiple nucleophiles. As depicted in Figure S2, the microspecies distribution at pH 9.0 indicates possible regioisomer reactions during the amide bond formation. We also calculated the strongest basic pKa for the NHS ester reaction for the model compound library in Table S2). Such minor regioisomers might affect the conjugation reaction and binding affinity of live bacteria cells, and further studies are ongoing to clarify this issue.
Figure 2. Chemical structures of the 24-compound model library.
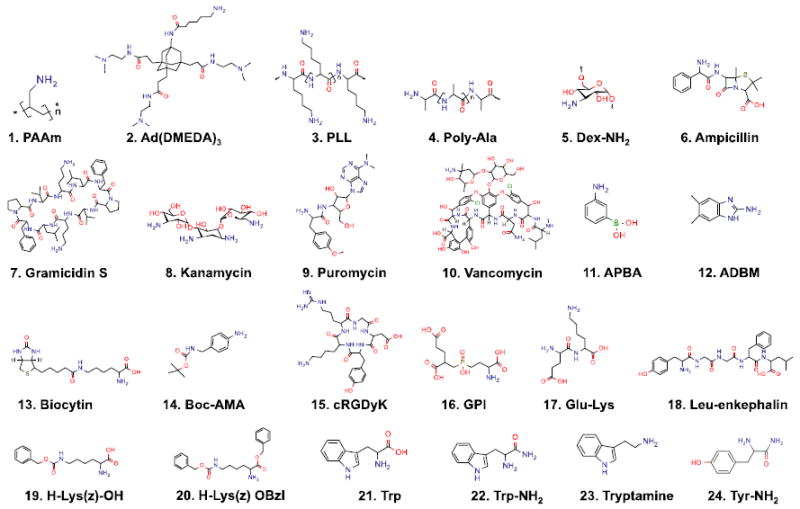
Abbreviations used are: PAAm, polyallylamine; Ad(DMEDA)3, in-house compound; PLL, poly-D,L-lysine; Poly-Ala, poly L-alanine; Dex-NH2, amino dextran; APBS, aminophenylboronic acid; ADBM, 2-amino-5,6-dimethylbenzimidazole; Boc-AMA, 4-[(N-Boc)aminomethyl] aniline; cRGDyK, cyclo(Arg-Gly-Asp-D-Tyr-Lys); GPI, in-house compound; Trp, L-tryptophan; Trp-NH2, L-tryptophanamide; Tyr-NH2, L-tyrosinamide. The chemical structures were drawn using MarvinSketch (ChemAxon, Budapest, Hungary).
Next, the fluorophore-stained live bacterial cells were panned over the ligand array and incubated for 3 h at room temperature (Fig. 3). Each ligand spot on the microarray was imaged by automated microscope and the cell binding was quantitated. Because of the extremely small size of bacterial cells, we employed optical deconvolution and auto-segmentation to deblur, refocus, and normalize images acquired with a 10X lens. Point spread function (PSF) parameters in the multi-wavelength planes were optimized using a commercial wide-field microscope (TE-2000, Nikon).18 As shown in Figure 3a, S.A. stained with SYTO BC was imaged before and after the deconvolution process. PSF parameters were optimized with 0.5 numerical aperture in wide-field fluorescence, 1.3 refraction index, 3-μm specimen thickness, and 519-nm emission. Each cell signal was flattened to improve the SBR, and faint signals were recovered for segmentation. Shown in Figure 3b is a vancomycin spot to which thousands of S.A. cells have bound. A sequential segmentation procedure for improved scoring was conducted through region-of-interest (ROI) selection (200 × 200 μm), post-restorative deconvolution, static thresholding, and cell counting based on area fraction. In this way, cell-to-surface adhesion could be digitized and the number of cells bound per chemical spot could be used as the metric to assess ligand affinity.
Figure 3. Quantitation of bacterial cell binding to the glass slide.
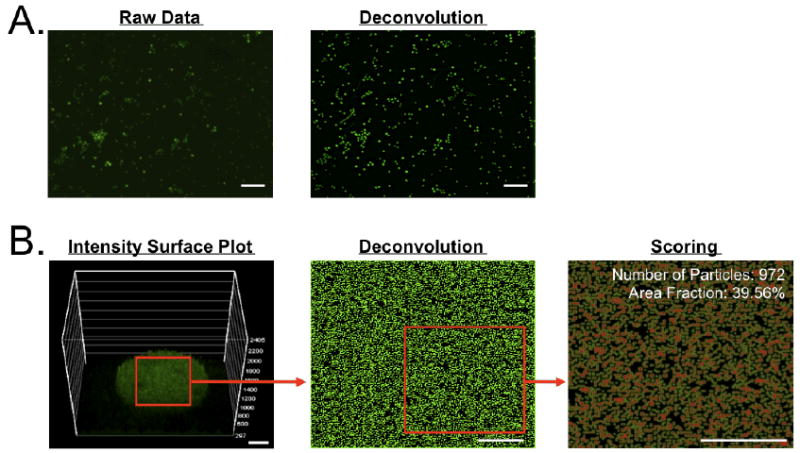
A) Optical deconvolution of acquired images as shown using Staphylococcus aureus (S.A.) stained with SYTO BC (left: general fluorescence image, right: deconvoluted image). B) Automated cell segmentation and scoring. The interaction between S.A. cells and the vancomycin spot was plotted based on fluorescence intensity, then a 200 × 200 μm ROI was selected for deconvolution and auto-segmentation. Scale bars = 40 μm.
Affinity Mapping
Raw data from the 24 model library and a single fluorescence channel is shown in Figure 4, along with the numerical output from deconvolution and cell number quantitation. In grid format, the color intensity of each spot provided a convenient visual interpretation of ligand affinity, while the numerical data permitted rapid sorting of affinities for lead compound selection. Of note, it appears that the assay is capable of exploiting the entire dynamic range, with over 5,000 S.A. cells bound to a single vancomycin spot.
Figure 4. Affinity map.
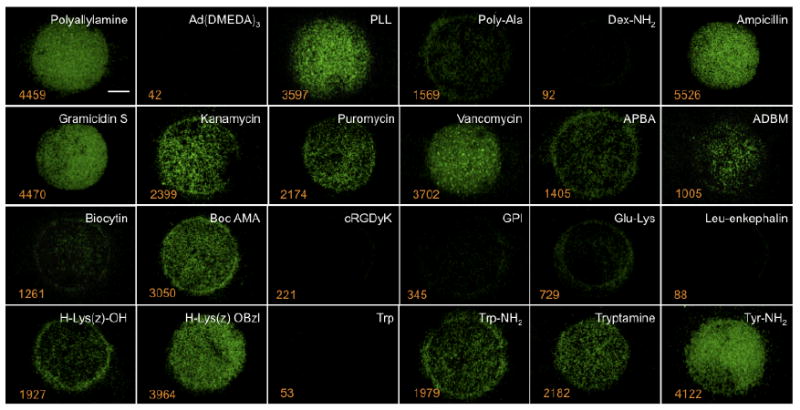
S.A. (5 × 10⁸ cells) was panned over a glass slide to which the 24 model compounds (white text) were conjugated. Automated analysis of each spot provides a binding affinity map, i.e., the number of bacterial cells bound per spot (orange text). Scale bar = 100 μm.
Specificity Color Mapping
Ligand specificity is an important feature that could limit targeting to a single strain of pathogen.19 Because we built optical multiplexing into the screening strategy, we were able to simultaneously acquire 4 data sets from 4 different stains, including S.A., B.S., P.A., and E.C. We quickly learned, however, that visual interpretation of specificity and its associated affinity data was extremely difficult. To solve this problem, we developed a simple metric based on the CMYK (Cyan, Magenta, Yellow, Key) color code (Fig. 5a). First, we scaled all values to have a maximum of 50% color intensity (i.e., a scale of 0 to 50) because the K channel (black) would otherwise obscure all others. Second, we assigned each bacterial strain to a different CMYK color: S.A. (C), P.A. (M), B.S. (Y), and E.C. (K). As shown in Figure 5a, using such a tool, the color intensity in any one column of data reports the affinity of a particular targeting ligand and the final combined color created from merging all columns from a row reports specificity. For example, as shown in Figure 5b, ampicillin is colored dark-brown and represents the highest affinity but the lowest specificity. Boc-AMA and Leu-enkephalin are represented as light blue and light pink, respectively, which indicate high specificity but relatively low affinity.
Figure 5. Specificity color map.
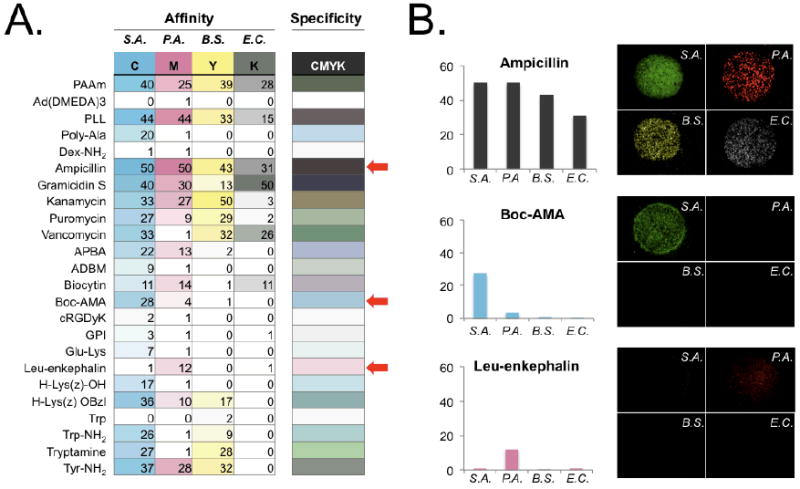
A) Single color rendering of CMYK colors for different bacterial stains (left 4 columns), and a single merged color representing specificity (right most column). B) Affinity and specificity comparison of selected spots from the specificity map (marked as red arrows in A and their actual microarray fluorescence images. S.A.: Staphylococcus aureus; B.S.: Bacillus subtilis; P.A.: Pseudomonas aeruginosa; E.C.: Escherichia coli.
In Silico Analysis
We performed automated in silico analysis of targeting ligands using JChem calculator plugins (ChemAxon, Budapest, Hungary) to correlate physicochemical properties with affinity and/or specificity (Table S2). A total of 14 descriptors that play a fundamental role in many biological events, such as LogD at pH 7.4, charge, polar surface area (PSA), pKa, hydrogen bonding donor/acceptor (HBD/HBA), refractivity, electronegativity, van der Waals surface area, and rotatable bonds, were examined. We compared two different molecular species that have only one or two chemical group differences, but which showed dramatic differences in ligand-cell interactions. We employed radar charts with normalized property values as an effective and intuitive method for plotting property-activity relationships.20 Adding a phenyl group to H-Lys(Z)-OH led to higher LogD and strongest acidic pKa, and correlated with improved ligand-cell interaction (Fig. 6a). L-tryptophanamide (Trp-NH2) and L-tyrosinamide (Tyr-NH2) have very similar physicochemical properties except for the strongest acidic pKa, which was also correlated with ligand affinity (Fig. 6b). Although such an analysis is rudimentary, it can be fully automated and provides the basis for expanding chemical space around initial candidate molecules.
Figure 6. In silico ligand property analysis.
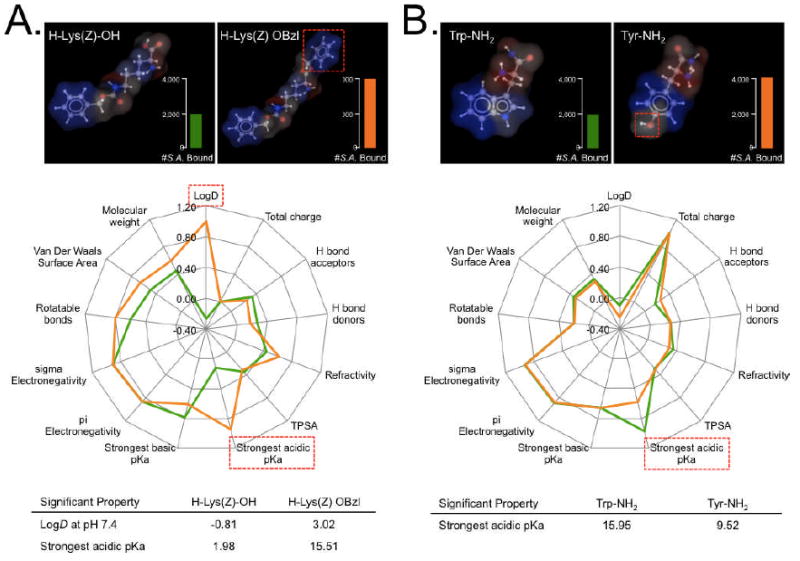
A) Comparison of H-Lys(Z)-OH versus H-Lys(Z) OBzl and B) L-tryptophanamide versus L-tyrosinamide in the context of Staphylococcus aureus (S.A.) binding affinity. Two pairs of model chemicals with different binding affinities were selected in order to determine which physicochemical properties correlated with cell binding. 3-D structure of each ligand (top) and their physicochemical properties were normalized in the radar chart (middle) to quickly find properties that correlated with a higher affinity (bottom). Scale bars = 100 μm.
CONCLUSIONS
Targeting the bacterial cell surface using small molecule ligands is as alternative strategy for developing new antibiotics. In this study, we present an integrated, robotic-assisted, small molecule microarray discovery system capable of screening and analyzing new small molecules specific to the surface of virtually any bacterial, fungal, or viral pathogen. Because our system does not require a priori knowledge about extracellular epitopes, and does not introduce significant constraints on chemical space, the probability of finding lead compounds is greatly increased. Even our small model compound library revealed reasonable candidates for derivatization. Importantly, stringency of the bacteria-ligand interaction could also be easily manipulated by controlling incubation time, rocking motion, and temperature (data not shown).
The glass slide microarray chip system serves two functions: 1) compaction of chemical space by 75-fold and 18-fold compared to 384-well and 1536-well plates, respectively, and 2) rapid identification and automated scoring of high affinity and high specificity targeting ligands using live bacteria. Major problems we encountered during quantitation from the small glass slide chip included variability in fluorescence signals, interference from nearby neighbors, and out-of-focus blur.16,18,21 To overcome them, we applied 2-D restorative deconvolution (i.e., Lucy-Richardson algorithm22) during postimage processing, which could reassign out-of-focus blur mathematically to its point of origin and therefore permit counting of the absolute number of cells on the same ROI.
Although our system has the potential to screen up to 5,076 small molecule ligands per slide, several challenges still remain. First, the glass slide microarray was designed for one-step conjugation to amine containing ligands; the surface chemistry might need to be modified for other classes of molecules. However, the constraint of requiring a single primary amine is far less restrictive from a medicinal chemistry standpoint than focusing only on molecules capable of penetrating through both the cell wall and cell membrane. Second, ligands with certain dominant features such as high cationicity of PAAm can lead to nonspecific cell surface binding. Of course, we exploit this property when using PAAm as a positive control, but it could also be a source of false-positive results during chemical screening, which would require increasing stringency as described above. Third, our CMYK rendering of affinity and specificity is limited to 4 bacterial strains at a time. And, finally, CMYK colors can be only subtly different from each other, thus requiring the numerical data for definitive sorting of results.
This study represents a first step towards a new class of antibiotic molecules that target the surface of live pathogenic bacteria. Armed with the high-throughput microarray-based glass slide chip system, more than 10 thousands molecules could be easily synthesized and screened. Moving forward, emphasis must be placed on selecting and synthesizing appropriate candidate molecules from the vastness of chemical space.
Supplementary Material
Acknowledgments
We thank Alex Allardyce (ChemAxon, Budapest, Hungary), Marsha Paul (Caliper LS, Hopkinton, MA), Brian Stall (Bruker Daltonics, Billerica, MA), Rene Schena (ArrayIt Corp., Sunnyvale, CA), Colin Johnson (LAE Technologies, Barrie, Canada), and Yangsun Kim (HST, Newark, NJ) for technical support and many helpful discussions. We thank David Burrington, Jr for editing and Eugenia Trabucchi for administrative assistance. This study was supported by a grant from the Nehemias Gorin Foundation and the following grants from the National Institutes of Health: NCI BRP grant #R01-CA-115296 (JVF), NIBIB grant #R01-EB-010022 (JVF and HSC), and NIBIB grant #R01-EB-011523 (HSC and JVF), and the Dana Foundation Program in Brain and Immuno-Imaging (HSC).
References
- 1.Wright GD. Curr Opin Microbiol. 2010;13:589–594. doi: 10.1016/j.mib.2010.08.005. [DOI] [PubMed] [Google Scholar]
- 2.Gootz TD, Marra A. Expert Rev Anti Infect Ther. 2008;6:309–325. doi: 10.1586/14787210.6.3.309. [DOI] [PubMed] [Google Scholar]
- 3.Liu CI, Liu GY, Song Y, Yin F, Hensler ME, Jeng WY, Nizet V, Wang AH, Oldfield E. Science. 2008;319:1391–1394. doi: 10.1126/science.1153018. [DOI] [PMC free article] [PubMed] [Google Scholar]
- 4.Kell AJ, Stewart G, Ryan S, Peytavi R, Boissinot M, Huletsky A, Bergeron MG, Simard B. ACS Nano. 2008;2:1777–1788. doi: 10.1021/nn700183g. [DOI] [PubMed] [Google Scholar]
- 5.Inglese J, Johnson RL, Simeonov A, Xia M, Zheng W, Austin CP, Auld DS. Nat Chem Biol. 2007;3:466–479. doi: 10.1038/nchembio.2007.17. [DOI] [PubMed] [Google Scholar]
- 6.Stockwell BR, Haggarty SJ, Schreiber SL. Chem Biol. 1999;6:71–83. doi: 10.1016/S1074-5521(99)80004-0. [DOI] [PubMed] [Google Scholar]
- 7.Barrett OJ, Childs JL, Disney MD. Chembiochem. 2006;7:1882–1885. doi: 10.1002/cbic.200600260. [DOI] [PubMed] [Google Scholar]
- 8.Kumaresan PR, Lam KS. Mol Biosyst. 2006;2:259–270. doi: 10.1039/b602004f. [DOI] [PubMed] [Google Scholar]
- 9.Mak PA, Rao SP, Ping Tan M, Lin X, Chyba J, Tay J, Ng SH, Tan BH, Cherian J, Duraiswamy J, Bifani P, Lim V, Lee BH, Ling Ma N, Beer D, Thayalan P, Kuhen K, Chatterjee A, Supek F, Glynne R, Zheng J, Boshoff HI, Barry CE, 3rd, Dick T, Pethe K, Camacho LR. ACS chemical biology. 2012;7:1190–1197. doi: 10.1021/cb2004884. [DOI] [PMC free article] [PubMed] [Google Scholar]
- 10.Mammen M, Choi SK, Whiteside GM. Angew Chem Int Ed. 1998;37:2754–2794. doi: 10.1002/(SICI)1521-3773(19981102)37:20<2754::AID-ANIE2754>3.0.CO;2-3. [DOI] [PubMed] [Google Scholar]
- 11.Gottenbos B, Busscher HJ, Van Der Mei HC, Nieuwenhuis P. J Mater Sci Mater Med. 2002;13:717–722. doi: 10.1023/a:1016175502756. [DOI] [PubMed] [Google Scholar]
- 12.Humblet V, Misra P, Bhushan KR, Nasr K, Ko YS, Tsukamoto T, Pannier N, Frangioni JV, Maison W. J Med Chem. 2009;52:544–550. doi: 10.1021/jm801033c. [DOI] [PMC free article] [PubMed] [Google Scholar]
- 13.Svarovsky SA, Gonzalez-Moa MJ. ACS combinatorial science. 2011;13:634–638. doi: 10.1021/co200088c. [DOI] [PubMed] [Google Scholar]
- 14.Lee JH, Hyun H, Cross CJ, Henary M, Nasr KA, Oketokoun R, Choi HS, Frangioni JV. Adv Funct Mater. 2011;22:872–878. doi: 10.1002/adfm.201102033. [DOI] [PMC free article] [PubMed] [Google Scholar]
- 15.Lee JH, Choi HS, Nasr KA, Ha M, Kim Y, Frangioni JV. Anal Chem. 2011;83:5283–5289. doi: 10.1021/ac2006735. [DOI] [PMC free article] [PubMed] [Google Scholar]
- 16.Le Puil M, Biggerstaff JP, Weidow BL, Price JR, Naser SA, White DC, Alberte RS. J Microbiol Methods. 2006;67:597–602. doi: 10.1016/j.mimet.2006.05.019. [DOI] [PubMed] [Google Scholar]
- 17.Leevy WM, Gammon ST, Jiang H, Johnson JR, Maxwell DJ, Jackson EN, Marquez M, Piwnica-Worms D, Smith BD. J Am Chem Soc. 2006;128:16476–16477. doi: 10.1021/ja0665592. [DOI] [PMC free article] [PubMed] [Google Scholar]
- 18.McNally JG, Karpova T, Cooper J, Conchello JA. Methods. 1999;19:373–385. doi: 10.1006/meth.1999.0873. [DOI] [PubMed] [Google Scholar]
- 19.Barelier S, Krimm I. Curr Opin Chem Biol. 2011;15:469–474. doi: 10.1016/j.cbpa.2011.02.020. [DOI] [PubMed] [Google Scholar]
- 20.Oprea TI. J Comput Aided Mol Des. 2000;14:251–264. doi: 10.1023/a:1008130001697. [DOI] [PubMed] [Google Scholar]
- 21.Manz W, Arp G, Schumann-Kindel G, Szewzyk U, Reitner J. J Microbiol Methods. 2000;40:125–134. doi: 10.1016/s0167-7012(99)00103-7. [DOI] [PubMed] [Google Scholar]
- 22.Fish DA, Brinicombe AM, Pike ER, G WJ. J Opt Soc Am A. 1995;12:58–65. [Google Scholar]
Associated Data
This section collects any data citations, data availability statements, or supplementary materials included in this article.