

Abstract
Epidermal growth factor receptor (EGFR) is frequently elevated in epithelial ovarian cancer and E-cadherin expression is often reduced in advanced disease. In this study we investigated a mechanism by which EGFR activation promotes disruption of adherens junctions through induction of matrix metalloproteinase-9 (MMP-9). We demonstrate that EGFR activation down-modulates E-cadherin, and broad spectrum MMP inhibition ameliorates EGF-stimulated junctional disruption and loss of E-cadherin protein. MMP-9 involvement in EGF-dependent down-regulation of E-cadherin was determined by siRNA specifically directed against MMP-9. Furthermore, treatment with recombinant MMP-9 or transient expression of MMP-9 is sufficient to reduce E-cadherin levels in differentiated ovarian tumor cells. Stable overexpression of MMP-9 led to a loss of E-cadherin and junctional integrity, and promoted a migratory and invasive phenotype. Thus, elevated MMP-9 protein expression is sufficient for junctional disruption and loss of E-cadherin in these cells. The associations between EGFR activation, MMP-9 expression and E-cadherin were investigated in human ovarian tumors and paired peritoneal metastases wherein immunohistochemical staining for activated (phospho) EGFR and MMP-9 co-localized with regions of reduced E-cadherin. These data suggest that regulation of MMP-9 by EGFR may represent a novel mechanism for down-modulation of E-cadherin in ovarian cancer.
Keywords: Epidermal Growth Factor Receptor (EGFR), Matrix Metalloproteinases (MMP), E-cadherin
Introduction
Epithelial ovarian carcinoma is the leading cause of death from gynecological malignancy in the United States, resulting in more than 15,000 deaths in 2006 (1). Since the disease is rarely detected when confined to the ovary, approximately 75% of women are initially diagnosed with intra-abdominal disseminations resulting in a 5-year survival of <20%. Acquisition of the metastatic phenotype involves a complex series of interrelated cellular events including reversible modulation of cell: cell and cell: matrix adhesion and proteolytic activity ultimately leading to dissociation (shedding) and dispersal of malignant cells. Modulation of adherens junctions and E-cadherin may promote metastatic progression of ovarian cancer.
The epidermal growth factor receptor (EGFR) is often mutated or overexpressed in many tumor types including ovarian cancer (reviewed in (2)). Furthermore EGFR is overexpressed in an estimated 35-70% of human epithelial ovarian cancer cases, and is associated with more aggressive disease and poor clinical outcome (3-12). Cellular responses to EGFR activation include those that play a critical role in tumor growth and survival, and EGFR overexpression in tumors is associated with metastatic progression (10, 11). We have shown that EGFR activation stimulates MMP-9 production and promotes migration and invasion in ovarian cancer cells (13-17). Furthermore, EGFR regulates E-cadherin protein expression and complex formation (17, 18). We are interested in defining mechanisms by which EGFR activation modulates cell: cell interactions.
Aberrant epithelial differentiation is an early event in epithelial ovarian carcinogenesis, thus in contrast to most carcinomas that lose E-cadherin expression with progression, E-cadherin is abundant in primary differentiated ovarian carcinomas (reviewed in (19)). In more advanced poorly differentiated carcinomas, both absent and persistent E-cadherin expression have been reported (reviewed in (19)). While complete loss of E-cadherin expression is uncommon, reduced E-cadherin staining is often detected in late stage carcinomas and in ascites-derived tumor cells. Furthermore, negative E-cadherin is predictive of poor overall survival (reviewed in (19)). Although mutations in the E-cadherin gene are rare in ovarian carcinomas (20), several mechanisms have been described for transient or sustained loss of E-cadherin function including E-cadherin cleavage and shedding (21-24), epigenetic silencing (25, 26), and defective E-cadherin recycling and trafficking (27). Interestingly, while E-cadherin staining is significantly decreased in stage III/IV versus stage I/II tumors, a soluble ∼80 kDa E-cadherin ectodomain (sE-cad) is elevated in ascites from ovarian cancer patients (24). This observation is consistent with other reports demonstrating soluble E-cadherin ectodomain in peripheral blood, ascites, and cystic fluids from ovarian cancer patients (28-30). Several proteinases have been implicated in E-cadherin cleavage including MMP-3 and MMP-7 (23, 31), a disintegrin and metalloproteinase-10 (ADAM10), plasmin, membrane type I matrix metalloproteinase (MT1-MMP) (21, 32, 33) and MMP-9 (24). In this study we report that EGFR activation leads to disruption of adherens junctions and down-regulation of E-cadherin protein. MMP-9 is a mediator of the EGFR-dependent decrease E-cadherin protein, and MMP-9 expression alone is sufficient to cause E-cadherin and adherens junction loss. Furthermore, we find a relationship in human ovarian tumors between activated EGFR, MMP-9 and decreased E-cadherin levels. Together our results suggest that regulation of MMP-9 by EGFR may represent a novel mechanism for down-modulation of E-cadherin in ovarian cancer.
Materials and Methods
Materials
Epidermal growth factor was purchased from Biomedical Technologies, Inc. (Stoughton, MA). Matrigel was purchased from Becton Dickinson (Bedford, PA). Leupeptin, phenylmethylsulfonyl fluoride (PMSF), and pepstatin were obtained from Sigma (St. Louis, MO). FITC-conjugated anti-rabbit secondary antibody was purchased from Chemicon. (Temecula, CA). Cell culture reagents were obtained from Sigma (St. Louis, MO).
Cell culture and generation of stable cell lines
The epithelial ovarian carcinoma cell lines OVCA433 and OVCA 429 (and all of the stable cell lines generated from the OVCA 433 cells) were grown in Minimal Essential Medium Eagle (MEME) supplemented with 10% fetal bovine serum (FBS), 0.2 mM L-glutamine, 1mM sodium pyruvate, 50 units/ml penicillin, and 50 mg/ml streptomycin. OVCA 433 and OVCA 429 cells were a kind gift from Robert Bast Jr. (M. D. Anderson Cancer Center, Houston, TX). A mouse MMP-9 cDNA image clone was obtained from ATCC (Manassas, VA). OVCA 433 cells were transfected with 10μg of MMP-9/pCDNA3 or pCDNA3 alone according to manufacturer's instructions using Superfect (Qiagen, Valencia, CA). Stable cell lines for further analysis were generated by selection with 2mg/ml G418 and maintained in 0.75mg/ml G418. Ten MMP-9 expressing cell lines were generated. Stable cell lines were selected based on their MMP-9 mRNA expression and gelatinase activity in a zymography assay.
Zymogram Analysis
For all zymography analysis, cells were serum deprived for 24 hours and zymography was performed on conditioned-media as described previously (13,14). Results shown are representative of a minimum of three independent experiments. Densitometry was performed on western blots using the Kodak Image Station using Molecular Imaging Software version 4.0.
Immunofluorescence and microscopy on OVCA 433 cells
Phase-contrast microscopy and immunofluorescence microscopy were performed using an Olympus BH-2 inverted microscope or an Olympus 1×70 fluorescence microscope respectively. Images were collected using and Olympus America camera and Magnafire 2.1 software. OVCA 433 cells were treated as described above, fixed with freshly prepared 3.7% (w/v) formaldehyde in PBS [137 mmol/L NaCl, 2.7 mmol/L KCl, 8.1 mmol/L Na2HPO4, and 1.5 mmol/L KH2PO4 (pH 7.4)] containing 0.8 mmol/L MgCl2 and 0.18 mmol/L CaCl2 for 10 minutes at room temperature, permeabilized with 0.1% Triton X-100 in phosphate buffered saline (PBS) for 5 min at room temperature, and blocked with 3% BSA/PBS for 1 hour at 37°C. Fixed cells were incubated with mouse anti-E-cadherin (5μg/ml) (Zymed, San Francisco, CA) or β-catenin (1:200) (Chemicon, (Temecula, CA)) for 1 hour at 37°C. After washing thrice with PBS, samples were incubated with FITC conjugated anti-mouse IgG (Chemicon, (Temecula, CA). Confocal images were acquired at room temperature using a Zeiss LSM510 system equipped with argon lasers for excitation at 488 nm (green). Samples were viewed with the 63 × 1.4 oil immersion objective lens. Immunofluorescence on OVCA 429 cells was performed as described in Symowicz, J et al (24).
Flow cytometry
Cell lines were washed twice with PBS and then harvested with Typsin–EDTA. 106 cells were blocked with 3% BSA/PBS for 10 minutes at 4°C, and incubated with primary antibody mouse anti-E-cadherin 5μg/ml (Zymed, San Francisco, CA) for 40 minutes at 4°C and then washed twice with PBS. Cells were aliquoted for E-cadherin staining, no antibody control, and IgG control, and resuspended in 0.5 ml PBS. Flow cytometric analysis was performed on a Becton-Dickinson FACScan flow cytometer (Immunocytometry Systems, San Jose, CA). Mean fluorescence intensity for three independent experiments was shown, and error bars represent +/− standard deviation. Student t-test was used to calculate significance.
E-cadherin Ectodomain Generation and Immunoprecipitation
OVCA429 cells were plated in 6 well plates at 60-70% confluence, preincubated in serum free MEM and 50uM GM6001 (Chemicon, Temecula, CA) or equivalent DMSO overnight, and then treated with 20ng/ml EGF. After 8 hours, the total volume of conditioned media (1ml) was collected and centrifuged for 5 minutes. E-cadherin ectodomain immunoprecipitation was conducted as described in Symowicz, J. et al (24). The results of three independent experiments are included in the quantification with Image J. P values were calculated using T test (two sample unequal variance type and one tailed distribution). The first asterisk compares untreated cells and cells treated with EGF. The second asterisk compares cells treated with EGF to cells treated with both EGF and GM6001.
Transient Transfections
At 80% confluence OVCA 433 cells were transfected with pCDNA or pCDNA/MMP9. Two micrograms of plasmid DNA was transfected into the cells using Superfect (Qiagen) according to manufacturer's instructions. For transient transfections, cells were subcultured 24 hours after transfection, serum starved for 24 hours, followed by 24 hours of EGF treatment before collection of cell lysates.
SiRNA Analysis
SiRNA against MMP-9 was purchased from Ambion (Austin, TX). Two different siRNA oligonucleotides were tested and the following two were used in the described knockdown experiments: Si#1 and Si#2. Silencer GAPDH siRNA controls (which includes GAPDH siRNA and a negative control siRNA) were used as additional controls for siRNA technique. At 50% confluency OVCA 433 cells were mock transfected on 10cm plates or transfected with 50nM MMP-9 siRNA, 50nM GAPDH siRNA, or 50nM negative control siRNA using Superfect (Qiagen, Valencia, CA). Forty-eight hours after transfection cells were serum-starved for 24 hours and then treated with 20 nM EGF for 24 hours prior to cell lysate collection. Error bars represent standard error of the mean (SEM). Student t tests were performed to determine statistical significance.
Western blotting
Cells were lysed in RIPA lysis buffer (50mM Tris pH 7.5, 150mM NaCl, 1% triton X-100, 5mM EDTA). Protein concentration was determined using the BCA kit (Pierce, Rockford, IL). 30μg of protein were diluted in sample dilution buffer with 2-mercaptoethanol and boiled for 5 minutes. Samples were separated by SDS-PAGE and subsequently transferred to nitrocellulose membrane. Blots were probed with the following antibodies: anti-E-cadherin from Dako (Denmark) (1:1000), β-catenin (#MAB2081, Chemicon, 1:200), β-tubulin from Santa Cruz (Santa Cruz, CA) (1:1000) and β-actin obtained from Sigma (St. Louis, MO). Densitometry was performed on western blots using the Kodak Image Station using Molecular Imaging Software version 4.0.
Activation of Recombinant proMMP-9
Purified recombinant proMMP-9 was generously provided by Dr. Rafael Fridman (Wayne State University, Detroit, MI). It was activated by 1mM 4-aminophenylmercuric acetate (APMA) (Sigma Aldrich, St. Louis, MO) at 37°C for 1 to 3 hours and then dialyzed in collagenase buffer (50mM Tris, 150mM NaCl, 5mM CaCl2, 0.02% Brij-35, pH 7.5) at 4°C for 8 hours to overnight. The concentration of recombinant MMP-9 was determined using the BioRad (Hercules, CA) Protein Assay. The presence of the active form of MMP-9 was determined using gelatin zymography.
Ascites Samples
Ascites were collected from women undergoing surgical procedures at Prentice Women's Hospital (Chicago, IL) for gynecological indications with institutional review board-approved consent. Preoperative and intraoperative ascites were collected under sterile conditions and frozen at -20°C. ELISA was performed for MMP-9 on ascites specimens. Ascites samples from 35 ovarian cancer patients and women with benign ovarian cysts were diluted 1:100 in phosphate buffered saline (PBS) analyzed using a human MMP-9 (total) Immunoassay (R&D Systems, Minneapolis, MN) according to manufacturer's specifications.
Migration and Invasion assays
Cell migration assays were performed on modified Boyden chambers as described in Cowden Dahl, K. D. et al (13). To quantify invasive cells, three independent fields of migratory or invasive cells per well were photographed under phase-contrast microscopy. The number of cells per field was counted and an average of the three determinations was obtained for each chamber. Each migration or invasion assay was performed a minimum of three times. Error bars represent standard error of the mean (SEM). Student t tests were performed to determine statistical significance.
Immunohistochemistry
Immunohistochemical analysis was performed retrospectively on tumor tissue microarrays prepared by the Pathology Core Facility of the Robert H. Lurie Comprehensive Cancer Center at Northwestern University assembled from tissue originally taken for routine diagnostic purposes under an Institutional Review Board approved protocol. The microarray tissue specimens included 146 primary human ovarian carcinomas (74 serous, 45 endometroid, 6 mucinous, and 18 clear cell) or 17 paired samples of primary ovarian carcinoma (serous) and paired peritoneal metastatic tissue obtained from the same patient. All cores were 1mm in diameter. Samples were cut 3 to 4μm thick and deparaffinized. Antigen retrieval was accomplished by heat induction at 99°C for 45 minutes. Immunohistochemical staining with antibodies to phospho-EGFR (1:400, Zymed, San Francisco, CA), MMP-9 (1:200 dilution, Lab Vision, Fremont, CA), and E-cadherin (1:200 dilution, NCH-38 Dako Cytomation, Carpinteria, CA) was conducted according to standard procedures. Tissue sections were analyzed by light microscopy by a pathologist (B.P.A.) without prior knowledge of the clinical variables. Scoring was assigned according to the intensity of the staining using a four-tiered scale and graded 0 (negative; with less than 25% cells positive), 1+ (weak; 25-50% positive cells, 2+ (moderate; 51-75% positive cells, or 3+ (strong; more than 75% positive cells). Spearman's rank correlation analysis was performed using Systat 11(Systat Inc., CA, USA).
Results
EGFR activation disrupts adherens junctions and reduces E-cadherin protein levels
Since the EGFR is overexpressed in ovarian cancer (3-9), we wanted to determine how activation of the EGFR influences adherens junctions in a differentiated ovarian tumor cell line. EGF treatment disrupted adherens junctions as detected by decreased E-cadherin at sites of cell: cell contact and accumulation of nuclear β-catenin (Fig. 1A). Immunoblotting performed on lysates collected from OVCA 433 and OVCA 429 cells treated with EGF for 0, 2, 4, 8, 24, and 48 hours showed little decrease in total E-cadherin protein until 8-24 hours of treatment (Fig. 1B). E-cadherin down-regulation in response to EGF continued over an extended time course (Fig. 1B). Due to the observation that E-cadherin was decreased at cell borders, we examined cell surface localized E-cadherin levels by flow cytometry. Loss of E-cadherin from the cell surface was evident within 4 hours after EGF treatment, with maximal E-cadherin loss between 8 and 24 hours (Fig. 1C). Therefore, EGFR activation decreased the stability of adherens junctions ultimately leading to a decrease in total E-cadherin protein.
Figure 1.

EGF treatment disrupts adherens junctions and down-modulates E-cadherin. A. OVCA 433 cells were treated with 20nM EGF for the indicated times and distribution of E-cadherin and β-catenin was detected by immunofluorescence as described in “Materials and Methods”. Original magnification was 88.2×. B. OVCA 433 and OVCA 429 cells were treated with 20nM EGF indicated times. Protein lysates were collected and 10μg of total protein was resolved by PAGE, transferred to nitrocellulose membrane, and immunoblotted with anti-E-cadherin or anti-β-tubulin followed by peroxidase-conjugated secondary antibody and ECL detection. C. The surface expression of E-cadherin following EGF treatment for indicated times was measured using flow cytometry as described under “Materials and Methods”. Data shown are expressed in arbitrary units (a.u.) and represent the mean fluorescence intensity for three independent experiments (mean-/+ S.D.) *P<0.005; #P<0.005 compared to untreated control. D. Cells were treated with EGF for 8 hours or EGF in the presence of 50μM GM6001 (GM), an MMP inhibitor. The E-cadherin ectodomain was immunoprecipitated from conditioned media collected for each treatment group. The 80kd band from a representative experiment is shown in the upper panel and densitometric data of band intensity from three independent experiments is shown in the lower panel. Results were normalized against the densitometric reading of untreated cells and represent three independent experiments. Data shown represent the mean -/+ S. D. * represents statistical significance comparing untreated cells to cell treated with EGF. # represents statistical significance comparing EGF treated cells to cells treated with both EGF and GM. P<0.005 for both comparisons.
Published data demonstrate that pericellular proteinases can catalyze shedding of the E-cadherin ectodomain (21, 23, 31, 33), and detection of soluble E-cadherin (sE-cad) is significantly increased the ascites of ovarian cancer patients (24). To evaluate whether EGFR activation leads to generation of sE-cad, conditioned media were collected from OVCA 429 cells exposed to 20nM EGF for 8 hours in the presence or absence of the broad-spectrum MMP-inhibitor GM6001 followed by immunoprecipitation using an antibody against the extracellular portion of E-cadherin. The 8 hour time point was chosen to specifically determine if sE-Cad shedding occurred prior to the complete breakdown in adherens junctions seen at 24 hours of EGF treatment (Fig. 2). sE-Cad was increased in the conditioned media of EGF treated cells and ectodomain shedding was reduced in EGF treated cells concurrently exposed to GM6001 (Fig. 1D), suggesting that a metalloproteinase activity contributes to EGF-dependent junction disruption and sE-Cad generation.
Figure 2.

MMP involvement in EGF-induced loss of E-cadherin. A. Serum-deprived OVCA 433 and OVCA 429 cells were untreated or treated with 20nM EGF or 20nM EGF and 50μM GM6001 (GM) for 24 hours. Protein lysates were collected and 35μg of total protein was resolved by PAGE, transferred to nitrocellulose membrane, and anti-E-cadherin or anti-β-tubulin were detected by western blot as described in “Materials and Methods”. B. OVCA 433 cells were treated as in (A) and images of cell morphology (left panels) or distribution of E-cadherin (right panels) were obtained by phase-contrast microscopy (original magnification 100×) and immunofluorescence (original magnification 400×), respectively. C. OVCA 433 cells were transfected with a negative control siRNA (Mock) or two independent MMP-9 siRNA oligos (si#1 and si#2). Transfected OVCA 433 cells were serum-starved then left or treated with 20nM EGF for 24 hours. RNA and conditioned-media were collected and Q-PCR and gelatin zymography were performed for MMP-9 to determine the efficiency of siRNA knockdown. Results were normalized to mock untreated cells. Error bars represent +/- standard error of the mean (SEM). *p<0.02. Statistical significance is shown for siRNA transfected cells treated with EGF compared to mock transfected cells treated with EGF. D. OVCA 433 cells were transfected with a negative control siRNA (lanes 1 and 2) or two independent MMP-9 siRNA oligos (si#1 lanes 3 and 4; si#2 lanes 5 and 6). Transfected cells were serum-starved for 24 hours and then untreated or treated with EGF for 24 hours. Protein was collected and western blots for E-cadherin and β-actin were performed in “Materials and Methods”. The average percent decrease in E-cadherin protein was determined by Kodak Imager densitometry. SiRNA transfected cells treated with EGF were compared to EGF-treated mock transfected cells.
EGFR activation induces expression and activity of MMP-9 in many ovarian cancer cells (15) and induces MMP-9 and MMP-14 in OVCA 433 cells; however EGF does not increase expression of MMP-1, MMP-7, or MMP-13 in these cells (13). We next chose to examine the effects of 24 hours of EGF treatment on both E-cadherin protein and cellular morphology, because although E-cadherin is decreased after 8 hours of EGF treatment, the cellular morphology is largely still epithelial. Importantly, EGF treatment does not decrease total N-cadherin (by immunoblot analysis) or surface N-cadherin (by immunofluorescence) (data not shown). In two different ovarian cancer cell lines (OVCA 429 and OVCA 433), total E-cadherin protein was decreased after EGF treatment for 24 hours, but E-cadherin protein was retained in EGF treated cells co-incubated with GM6001(Fig. 2A). Similarly, EGF treatment led to loss of E-cadherin staining at cell: cell borders and GM6001 largely protected junctional integrity from EGF-dependent disruption (Fig. 2B).
To establish whether MMP-9 is important for the observed EGF-stimulated decrease in E-cadherin protein, we utilized a siRNA approach. Two independent siRNA oligos significantly knocked-down MMP-9 mRNA levels (by 53% and 83% compared to mock transfected cells treated with EGF) and MMP-9 protein (by 70% and 64% compared to mock transfected cells treated with EGF) (Fig. 2C). Importantly, the EGF-dependent decrease in E-cadherin was minimal in cells transfected with these MMP-9 directed siRNAs (Fig. 2D). Taken together, these data suggest EGF-stimulated down regulation of E-cadherin is largely mediated by MMP-9.
Elevated MMP-9 disrupts adherens junctions and reduces E-cadherin levels
MMP-9 activity has been reported previously in human ovarian cancer ascites using gelatin zymography (24, 34-36). Quantification of MMP-9 levels as detected by ELISA assay in non-malignant ascites versus ascites collected from patients with stage III/IV ovarian cancer revealed that total MMP-9 expression was significantly higher in carcinomas, indicating that MMP-9 is elevated in the extracellular ovarian cancer microenvironment (Fig. 3A). In addition, the ratio of soluble E-cadherin ectodomain (24) to MMP-9 was significantly higher in stage III/IV ovarian cancer ascites compared to non-malignant samples (Fig. 3B). Since the loss of E-cadherin in cells treated with EGF is associated with MMP-9 activity (24), we evaluated whether MMP-9 is sufficient to disrupt adherens junctions and down-regulate E-cadherin protein levels. Cells were treated with exogenous activated MMP-9 at a concentration representing the average level found in human ovarian cancer ascites (Fig. 3A and (24)). Exposure to exogenous MMP-9 decreased E-cadherin border staining (Fig. 3C). This was confirmed by transient expression of MMP-9, as immunoblot analysis demonstrated a decrease in E-cadherin protein as a consequence of elevated MMP-9 expression in the absence of EGF stimulation (Fig. 3D). As further confirmation, we examined the impact of constitutive MMP-9 expression on adherens junctions. Clones of cells transfected with an empty vector (pCDNA3) or MMP-9 (pCDNA3/MMP-9) were analyzed. Twelve MMP-9 overexpressing clones were isolated and a representative example (M9) is shown in Figure 4. The MMP-9 transfected clones expressed elevated gelatinase activity compared to vector control cells (V3) and elevated MMP-9 mRNA (Fig. 4A) was confirmed by northern blot (data not shown). M9 cells do not form epithelial-like sheets (Fig. 4C) and have no detectable E-cadherin mRNA (data not shown). M9 cells exhibit a loss of E-cadherin protein (Fig. 4B), loss of E-cadherrn staining at of cell: cell borders (Fig. 4C) and morphology reminiscent of that observed in EGF-stimulated cells (16, 17). N-cadherin expression is detected by both immunoblot and immunofluorescence in M9 cells (data not shown). These findings indicate that elevated MMP-9 in the ovarian tumor environment is likely to have a deleterious impact on adherens junction integrity via modulation of E-cadherin levels.
Figure 3.

Relationship between MMP-9 and E-cadherin loss. A. Analysis of MMP-9 levels in ascites fluid. Ascites samples from 29 women with stage III or IV ovarian cancer and 6 women with non-malignant ascites were diluted 1:100 in phosphate buffered saline (PBS) and analyzed using a human MMP-9 (total) Immunoassay (R&D Systems, Minneapolis, MN) according to manufacturer's specifications. B. Relationship between soluble E-cadherin ectodomain (24) and MMP-9 levels in malignant and non-malignant ascites fluid. C. Recombinant MMP-9 decreases junctional E-cadherin. OVCA 429 cells were untreated or treated with recombinant human MMP 9 (rHMMP-9) for 48 hours. Distribution of E-cadherin was detected by immunofluorescence using anti-E-cadherin and nuclei were visualized with DAPI. Original magnification 400×. D. Transiently transfected MMP-9 decreases E-cadherin. OVCA 433 cells were transiently transfected with MMP-9 and cell lysates were collected 48 hours post-transfection. E-cadherin and β-actin were detected by immunoblot analysis as described in “Materials and Methods”.
Figure 4.

MMP-9 overexpression is sufficient to generate an invasive phenotype. A. OVCA 433 cells were stably transfected with MMP-9 (M9) or control vector (pCDNA3=V3). Conditioned media was also collected from stable lines and zymography assays were performed to detect MMP-9 gelatinase activity. B. Lysates were prepared from vector control (V3) and MMP-9 (M9) cells. Levels of E-cadherin and β-tubulin were detected by immunoblot analysis. C. Images of morphology and distribution of E-cadherin in V3 and M9 cells were obtained by phase-contrast microscopy (original magnification 100×) and immunofluorescence (original magnification 400×), respectively. D. Cell migration and invasion of V3 and M9 cells were evaluated following cell seeding in the absence of serum onto porous cell culture membrane inserts without or with Matrigel, respectively. Cells were allowed to migrate or invade for 48 hours, and cells on the underside of the insert were stained with crystal violet, photographed, and counted as described in “Materials and Methods”. Values shown represent the average number of migratory cells per field (minimum of 3 fields per membrane) for three independent experiments performed in duplicate -/+ SEM. *P<0.005.
Next we wanted to ascertain the relative importance of MMP-9 overexpression on cellular invasion because MMP-9 expression in either ovarian epithelial tumor cells or the adjacent malignant stroma is indicative of poor prognosis (37-39). Cells constitutively expressing MMP-9 displayed a significant increase in migration (2.4-fold p=0.0034) compared to control cells (Fig. 4D). Although MMP-9 overexpressing cells can migrate and invade in less than 48 hours, we wanted to allow sufficient time for untreated V3 cells to exhibit any invasive potential. In vitro invasion of cells through an artificial basement membrane gave similar results; MMP-9 expressing cells were 5.5-fold more invasive than the untreated vector control cells (p=0.0004) (Fig. 4D). These data suggest that elevated MMP-9 is capable of promoting ovarian cancer cell migration and invasion.
Expression of phospho-EGFR, MMP-9, and E-cadherin in patient samples
While MMP-9 is commonly expressed by stromal elements in tumors (39), in situ hybridization analyses have provided definitive evidence for robust expression of MMP-9 by malignant ovarian epithelium (37, 40, 41). This was supported by immunohistochemical analysis of 141 primary ovarian tumors, which demonstrated MMP-9 expression in 74% of specimens (24). Further, analysis of MMP-9 levels in ovarian cancer patient ascites revealed that MMP-9 is prevalent in the ovarian tumor microenvironment (Fig. 3A, B).
To determine whether EGFR activation is correlated with MMP-9 expression and E-cadherin loss in human tumors, primary ovarian tumors were examined for activated (phospho-) EGFR, MMP-9, and E-cadherin immunoreactivity. We reported previously that 86% of ovarian tumors displayed zones of positive E-cadherin immunoreactivity while 74% exhibited positive MMP-9 staining (24). Similar results were obtained in the current analysis, with the majority of ovarian tumors displaying positive E-cadherin (76%) and MMP-9 (81%) reactivity. EGFR activation (phospho-EGFR) was evident in one third of the specimens (35%). EGFR activation was statistically positively correlated with MMP-9 expression (Spearman's rho=.429, p<0001). While both the Spearman's rank correlation analysis and McNemar's test indicated a negative relationship between phospho-EGFR and E-cadherin, results were not statistically significant. However, examination of serial tumor sections revealed numerous areas of co-localized staining for activated EGFR and MMP-9 that coincided with reduced levels of E-cadherin. (Fig. 5A-D). This is further supported by immunohistocehmical analysis of a panel of paired primary tumor and peritoneal metastases obtained from the same patient. Approximately one third (35%) of metastases exhibited elevated EGFR activation (phospho-EGFR staining) relative to the paired primary tumor (Fig. 6A, B). MMP-9 expression was high in all (100%) phospho-EGFR positive metastases, while 83% concomitantly exhibited decreased E-cadherin staining relative to the paired primary tumor (Fig. 6A, B). Together these in vivo data strongly support a relationship between EGFR activation, elevated MMP-9 expression and decreased E-cadherin.
Figure 5.
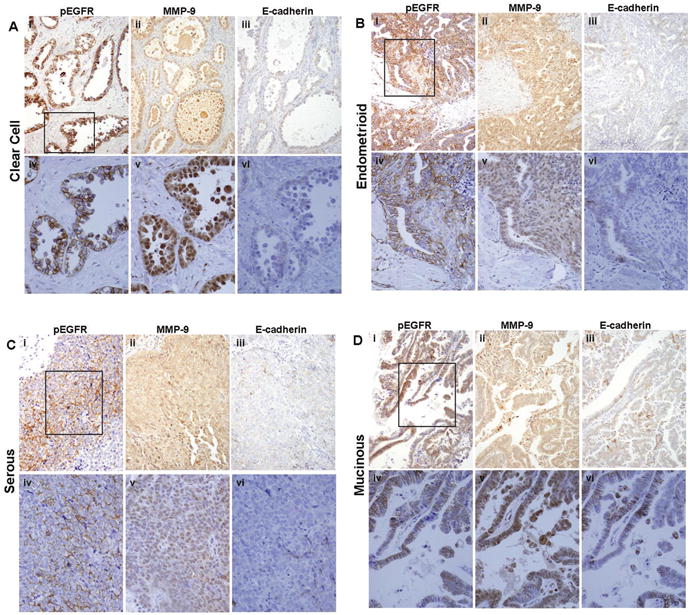
Immunohistochemical analysis of serial human ovarian tumor sections for EGFR activation, MMP-9, and E-cadherin. Serial sections of primary ovarian tumor samples were stained with antibodies to active (phospho-) EGFR, MMP-9, or E-cadherin (as indicated) and scored as described in “Materials and Methods”. EGFR activation was significantly positively correlated with MMP-9 expression (Spearman's rho=.429, p<.0001), and examination of serial tumor sections revealed numerous areas with reduced levels of E-cadherin that co-localized with strong positive staining for activated EGFR and MMP-9. (A) Clear cell carcinoma; (B) endometrioid; (C) serous; (D) mucinous. (i-iii)-200× magnification; (iv-vi)-400× magnification. Black box (i) designates area magnified in (iv-vi).
Figure 6.

Immunochemical analysis of serial sections from paired primary ovarian tumors and metastatic lesions. Serial sections of (A) primary serous ovarian tumor samples and (B) paired peritoneal metastases were stained with antibodies to active (phospho-) EGFR, MMP-9, or E-cadherin (as indicated) and scored as described in “Materials and Methods”. MMP-9 expression was high in all phospho-EGFR positive metastases, while the majority concomitantly exhibited decreased E-cadherien staining relative to the paired primary tumor. 400× magnification.
Discussion
Elevated EGFR expression in ovarian cancer is associated with poor patient outcome (8, 10-12). In addition to the impact of EGFR on tumor cell growth and survival EGFR, also influences tumor metastasis. EGFR is elevated in advanced ovarian tumors (42) and E-cadherin expression is often reduced in advanced disease (19), suggesting that both EGFR activity and E-cadherin status promote ovarian cancer progression. EGFR activation in vitro alters cellular morphology and adhesion leading to tumor cell invasion (13-17). Disruption of cell: cell contacts is an important event that fosters cell dissociation from the primary tumor and tumor cell invasion.
Numerous activators of EGFR exist in the ovarian tumor microenvironment (43) including EGF, heparin binding-EGF, lysophosphatidic acid, transforming growth factor alpha, and amphiregulin (43, 44). EGFR engagement by ligand induces dimerization, receptor and intracellular substrate phosphorylation, resulting in activation of signaling cascades (45, 46). One consequence of EGFR activation is induction of MMP-9 (13-15). We find MMP-9 in ascites isolated from ovarian cancer patients (Fig. 3) and interestingly, newly isolated ascites cells secrete MMP-9 in culture (34). However these cells lose MMP-9 expression with successive passages (34), suggesting microenvironmental factors are necessary for MMP-9 production. In this study, serial sections of ovarian tumor microarrays support a localized relationship between activated EGFR, increased MMP-9, and diminished E-cadherin (Fig. 5), and this relationship is particularly evident in metastatic lesions (Fig. 6). Although there are multiple mechanisms that lead to loss of E-cadherin including transcriptional repression, trafficking, and methylation (47, 48), our data suggest a novel mechanism for down-modulation of E-cadherin in ovarian cancer involving EGFR-dependent regulation of MMP-9 expression.
E-cadherin cleavage by matrix-metalloprotinases such as MMP-3, MMP-7 and MMP-9 has been reported in different contexts (21, 24, 49, 50). In ovarian cancer MMP-9 is expressed in both the stroma and the ovarian epithelial tumor cells (37, 40, 41), and MMP-9 expression in either compartment is indicative of poor prognosis (37-39). Thus, stromal MMP-9 sources such as tumor associated neutrophils or fibroblasts in addition to tumor cell generated MMP-9 are likely to lead to the observed elevation of MMP-9 in ovarian ascites (Fig. 3 and (34)). Of note, in our studies MMP-9 is more prevalent than activated EGFR in human tumors (81% versus 35%) suggesting that ovarian tumors have alternative MMP-9 sources and mechanisms of regulation. In this study we provide several lines of evidence that elevated MMP-9 down-regulates E-cadherin. EGFR activation induces MMP-9, and both EGFR and MMP-9 activation lead to adherens junction disruption in ovarian tumor cells (Figs. 1 and 2 and Figs. 3 and 4 respectively). Inhibition of MMP-9 by siRNA reduces EGFR-dependent E-cadherin loss (Fig. 2), while elevated MMP-9 by multiple mechanisms is sufficient to induce junctional disruption and decrease of E-cadherin protein (Figs. 3 and 4). Furthermore, we find a relationship between activated EGFR, elevated MMP-9 and decreased E-cadherin in tumor samples (Fig. 5 and 6). These data support our conclusion that MMP-9 is a mediator of junctional disruption by EGF and provide the first example of MMP-9-dependent down-regulation of E-cadherin in response to EGF signaling.
Acknowledgments
Grant Support: *This study was funded by a Department of Health and Human Services grant from the U. S. National Institutes of Health R01 CA90492 (L.G.H.) and CA109545 (M.S.S.) K.D.CD. was supported by Postdoctoral Fellowship PF-06-036-01-GMC from the American Cancer Society and is currently supported by the NRSA F32 award 1F32CA119729-01. Support was also provided by the UNM Cancer Research and Treatment Center NIH P20 CA888070 and the UNM NIEHS Center P30 ES-012072. E. G. was partially supported by an NIH Institutional National Research Service Award (T32HL076595).
References
- 1.Jemal A, Siegel R, Ward E, et al. Cancer statistics, 2006. CA Cancer J Clin. 2006;56:106–30. doi: 10.3322/canjclin.56.2.106. [DOI] [PubMed] [Google Scholar]
- 2.Mendelsohn J, Baselga J. Status of epidermal growth factor receptor antagonists in the biology and treatment of cancer. J Clin Oncol. 2003;21:2787–99. doi: 10.1200/JCO.2003.01.504. [DOI] [PubMed] [Google Scholar]
- 3.Bast RC, Jr, Pusztai L, Kerns BJ, et al. Coexpression of the HER-2 gene product, p185HER-2, and epidermal growth factor receptor, p170EGF-R, on epithelial ovarian cancers and normal tissues. Hybridoma. 1998;17:313–21. doi: 10.1089/hyb.1998.17.313. [DOI] [PubMed] [Google Scholar]
- 4.Maihle NJ, Baron AT, Barrette BA, et al. EGF/ErbB receptor family in ovarian cancer. Cancer Treat Res. 2002;107:247–58. doi: 10.1007/978-1-4757-3587-1_11. [DOI] [PubMed] [Google Scholar]
- 5.Perez-Soler R. HER1/EGFR targeting: refining the strategy. Oncologist. 2004;9:58–67. doi: 10.1634/theoncologist.9-1-58. [DOI] [PubMed] [Google Scholar]
- 6.Auersperg N, Edelson MI, Mok SC, Johnson SW, Hamilton TC. The biology of ovarian cancer. Semin Oncol. 1998;25:281–304. [PubMed] [Google Scholar]
- 7.Boerner JL, Danielsen A, Maihle NJ. Ligand-independent oncogenic signaling by the epidermal growth factor receptor: v-ErbB as a paradigm. Exp Cell Res. 2003;284:111–21. doi: 10.1016/s0014-4827(02)00096-4. [DOI] [PubMed] [Google Scholar]
- 8.Nicosia SV, Bai W, Cheng JQ, Coppola D, Kruk PA. Oncogenic pathways implicated in ovarian epithelial cancer. Hematol Oncol Clin North Am. 2003;17:927–43. doi: 10.1016/s0889-8588(03)00056-x. [DOI] [PubMed] [Google Scholar]
- 9.Psyrri A, Kassar M, Yu Z, et al. Effect of epidermal growth factor receptor expression level on survival in patients with epithelial ovarian cancer. Clin Cancer Res. 2005;11:8637–43. doi: 10.1158/1078-0432.CCR-05-1436. [DOI] [PubMed] [Google Scholar]
- 10.Marmor MD, Skaria KB, Yarden Y. Signal transduction and oncogenesis by ErbB/HER receptors. Int J Radiat Oncol Biol Phys. 2004;58:903–13. doi: 10.1016/j.ijrobp.2003.06.002. [DOI] [PubMed] [Google Scholar]
- 11.El-Rayes BF, LoRusso PM. Targeting the epidermal growth factor receptor. Br J Cancer. 2004;91:418–24. doi: 10.1038/sj.bjc.6601921. [DOI] [PMC free article] [PubMed] [Google Scholar]
- 12.Holbro T, Hynes NE. ErbB receptors: directing key signaling networks throughout life. Annu Rev Pharmacol Toxicol. 2004;44:195–217. doi: 10.1146/annurev.pharmtox.44.101802.121440. [DOI] [PubMed] [Google Scholar]
- 13.Cowden Dahl KD, Zeineldin R, Hudson LG. PEA3 Is Necessary for Optimal Epidermal Growth Factor Receptor-Stimulated Matrix Metalloproteinase Expression and Invasion of Ovarian Tumor Cells. Mol Cancer Res. 2007;5:413–21. doi: 10.1158/1541-7786.MCR-07-0019. [DOI] [PMC free article] [PubMed] [Google Scholar]
- 14.Ellerbroek SM, Halbleib JM, Benavidez M, et al. Phosphatidylinositol 3-kinase activity in epidermal growth factor-stimulated matrix metalloproteinase-9 production and cell surface association. Cancer Res. 2001;61:1855–61. [PubMed] [Google Scholar]
- 15.Ellerbroek SM, Hudson LG, Stack MS. Proteinase requirements of epidermal growth factor-induced ovarian cancer cell invasion. Int J Cancer. 1998;78:331–7. doi: 10.1002/(SICI)1097-0215(19981029)78:3<331::AID-IJC13>3.0.CO;2-9. [DOI] [PubMed] [Google Scholar]
- 16.Ning Y, Zeineldin R, Liu Y, Rosenberg M, Stack MS, Hudson LG. Down-regulation of integrin alpha2 surface expression by mutant epidermal growth factor receptor (EGFRvIII) induces aberrant cell spreading and focal adhesion formation. Cancer Res. 2005;65:9280–6. doi: 10.1158/0008-5472.CAN-05-0407. [DOI] [PubMed] [Google Scholar]
- 17.Zeineldin R, Rosenberg M, Ortega D, et al. Mesenchymal transformation in epithelial ovarian tumor cells expressing epidermal growth factor receptor variant III. Mol Carcinog. 2006;45:851–60. doi: 10.1002/mc.20237. [DOI] [PubMed] [Google Scholar]
- 18.Alper O, De Santis ML, Stromberg K, Hacker NF, Cho-Chung YS, Salomon DS. Anti-sense suppression of epidermal growth factor receptor expression alters cellular proliferation, cell-adhesion and tumorigenicity in ovarian cancer cells. Int J Cancer. 2000;88:566–74. doi: 10.1002/1097-0215(20001115)88:4<566::aid-ijc8>3.0.co;2-d. [DOI] [PubMed] [Google Scholar]
- 19.Hudson LG, Zeineldin R, Stack MS. Phenotypic plasticity of neoplastic ovarian epithelium: unique cadherin profiles in tumor progression. Clin Exp Metastasis. 2008 doi: 10.1007/s10585-008-9171-5. In press. [DOI] [PMC free article] [PubMed] [Google Scholar]
- 20.Wong AS, Auersperg N. Normal ovarian surface epithelium. Cancer Treat Res. 2002;107:161–83. doi: 10.1007/978-1-4757-3587-1_7. [DOI] [PubMed] [Google Scholar]
- 21.Covington MD, Burghardt RC, Parrish AR. Ischemia-induced cleavage of cadherins in NRK cells requires MT1-MMP (MMP-14) Am J Physiol Renal Physiol. 2006;290:F43–51. doi: 10.1152/ajprenal.00179.2005. [DOI] [PubMed] [Google Scholar]
- 22.Dwivedi DJ, Pino G, Banh A, et al. Matrix metalloproteinase inhibitors suppress transforming growth factor-beta-induced subcapsular cataract formation. Am J Pathol. 2006;168:69–79. doi: 10.2353/ajpath.2006.041089. [DOI] [PMC free article] [PubMed] [Google Scholar]
- 23.Lochter A, Galosy S, Muschler J, Freedman N, Werb Z, Bissell MJ. Matrix metalloproteinase stromelysin-1 triggers a cascade of molecular alterations that leads to stable epithelial-to-mesenchymal conversion and a premalignant phenotype in mammary epithelial cells. J Cell Biol. 1997;139:1861–72. doi: 10.1083/jcb.139.7.1861. [DOI] [PMC free article] [PubMed] [Google Scholar]
- 24.Symowicz J, Adley BP, Gleason KJ, et al. Engagement of collagen-binding integrins promotes matrix metalloproteinase-9-dependent E-cadherin ectodomain shedding in ovarian carcinoma cells. Cancer Res. 2007;67:2030–9. doi: 10.1158/0008-5472.CAN-06-2808. [DOI] [PubMed] [Google Scholar]
- 25.Makarla PB, Saboorian MH, Ashfaq R, et al. Promoter hypermethylation profile of ovarian epithelial neoplasms. Clin Cancer Res. 2005;11:5365–9. doi: 10.1158/1078-0432.CCR-04-2455. [DOI] [PubMed] [Google Scholar]
- 26.Rathi A, Virmani AK, Schorge JO, et al. Methylation profiles of sporadic ovarian tumors and nonmalignant ovaries from high-risk women. Clin Cancer Res. 2002;8:3324–31. [PubMed] [Google Scholar]
- 27.Bryant DM, Stow JL. The ins and outs of E-cadherin trafficking. Trends Cell Biol. 2004;14:427–34. doi: 10.1016/j.tcb.2004.07.007. [DOI] [PubMed] [Google Scholar]
- 28.Darai E, Bringuier AF, Walker-Combrouze F, Feldmann G, Madelenat P, Scoazec JY. Soluble adhesion molecules in serum and cyst fluid from patients with cystic tumours of the ovary. Hum Reprod. 1998;13:2831–5. doi: 10.1093/humrep/13.10.2831. [DOI] [PubMed] [Google Scholar]
- 29.Gadducci A, Ferdeghini M, Cosio S, et al. Preoperative serum E-cadherin assay in patients with ovarian carcinoma. Anticancer Res. 1999;19:769–72. [PubMed] [Google Scholar]
- 30.Sundfeldt K, Ivarsson K, Rask K, Haeger M, Hedin L, Brannstrom M. Higher levels of soluble E-cadherin in cyst fluid from malignant ovarian tumours than in benign cysts. Anticancer Res. 2001;21:65–70. [PubMed] [Google Scholar]
- 31.Noe V, Fingleton B, Jacobs K, et al. Release of an invasion promoter E-cadherin fragment by matrilysin and stromelysin-1. J Cell Sci. 2001;114:111–8. doi: 10.1242/jcs.114.1.111. [DOI] [PubMed] [Google Scholar]
- 32.Hayashido Y, Hamana T, Yoshioka Y, Kitano H, Koizumi K, Okamoto T. Plasminogen activator/plasmin system suppresses cell-cell adhesion of oral squamous cell carcinoma cells via proteolysis of E-cadherin. Int J Oncol. 2005;27:693–8. [PubMed] [Google Scholar]
- 33.Maretzky T, Reiss K, Ludwig A, et al. ADAM10 mediates E-cadherin shedding and regulates epithelial cell-cell adhesion, migration, and beta-catenin translocation. Proc Natl Acad Sci U S A. 2005;102:9182–7. doi: 10.1073/pnas.0500918102. [DOI] [PMC free article] [PubMed] [Google Scholar]
- 34.Fishman DA, Bafetti LM, Banionis S, Kearns AS, Chilukuri K, Stack MS. Production of extracellular matrix-degrading proteinases by primary cultures of human epithelial ovarian carcinoma cells. Cancer. 1997;80:1457–63. doi: 10.1002/(sici)1097-0142(19971015)80:8<1457::aid-cncr13>3.0.co;2-4. [DOI] [PubMed] [Google Scholar]
- 35.Demeter A, Sziller I, Csapo Z, et al. Molecular prognostic markers in recurrent and in non-recurrent epithelial ovarian cancer. Anticancer Res. 2005;25:2885–9. [PubMed] [Google Scholar]
- 36.Sakata K, Shigemasa K, Uebaba Y, Nagai N, Ohama K. Expression of matrix metalloproteinases-2 and -9 by cells isolated from the peritoneal fluid of women with ovarian carcinoma. Acta Cytol. 2002;46:697–703. doi: 10.1159/000326979. [DOI] [PubMed] [Google Scholar]
- 37.Davidson B, Goldberg I, Gotlieb WH, et al. High levels of MMP-2, MMP-9, MT1-MMP and TIMP-2 mRNA correlate with poor survival in ovarian carcinoma. Clin Exp Metastasis. 1999;17:799–808. doi: 10.1023/a:1006723011835. [DOI] [PubMed] [Google Scholar]
- 38.Davidson B, Goldberg I, Gotlieb WH, et al. The prognostic value of metalloproteinases and angiogenic factors in ovarian carcinoma. Mol Cell Endocrinol. 2002;187:39–45. doi: 10.1016/s0303-7207(01)00709-2. [DOI] [PubMed] [Google Scholar]
- 39.Kamat AA, Fletcher M, Gruman LM, et al. The clinical relevance of stromal matrix metalloproteinase expression in ovarian cancer. Clin Cancer Res. 2006;12:1707–14. doi: 10.1158/1078-0432.CCR-05-2338. [DOI] [PMC free article] [PubMed] [Google Scholar]
- 40.Huang LW, Garrett AP, Bell DA, Welch WR, Berkowitz RS, Mok SC. Differential expression of matrix metalloproteinase-9 and tissue inhibitor of metalloproteinase-1 protein and mRNA in epithelial ovarian tumors. Gynecol Oncol. 2000;77:369–76. doi: 10.1006/gyno.2000.5806. [DOI] [PubMed] [Google Scholar]
- 41.Naylor MS, Stamp GW, Davies BD, Balkwill FR. Expression and activity of MMPS and their regulators in ovarian cancer. Int J Cancer. 1994;58:50–6. doi: 10.1002/ijc.2910580110. [DOI] [PubMed] [Google Scholar]
- 42.Scambia G, Benedetti Panici P, Battaglia F, et al. Significance of epidermal growth factor receptor in advanced ovarian cancer. J Clin Oncol. 1992;10:529–35. doi: 10.1200/JCO.1992.10.4.529. [DOI] [PubMed] [Google Scholar]
- 43.Miyamoto S, Hirata M, Yamazaki A, et al. Heparin-binding EGF-like growth factor is a promising target for ovarian cancer therapy. Cancer Res. 2004;64:5720–7. doi: 10.1158/0008-5472.CAN-04-0811. [DOI] [PubMed] [Google Scholar]
- 44.Yagi H, Miyamoto S, Tanaka Y, et al. Clinical significance of heparin-binding epidermal growth factor-like growth factor in peritoneal fluid of ovarian cancer. Br J Cancer. 2005;92:1737. doi: 10.1038/sj.bjc.6602536. [DOI] [PMC free article] [PubMed] [Google Scholar]
- 45.Carpenter G. The EGF receptor: a nexus for trafficking and signaling. Bioessays. 2000;22:697–707. doi: 10.1002/1521-1878(200008)22:8<697::AID-BIES3>3.0.CO;2-1. [DOI] [PubMed] [Google Scholar]
- 46.Schlessinger J. Ligand-induced, receptor-mediated dimerization and activation of EGF receptor. Cell. 2002;110:669–72. doi: 10.1016/s0092-8674(02)00966-2. [DOI] [PubMed] [Google Scholar]
- 47.D'Souza-Schorey C. Disassembling adherens junctions: breaking up is hard to do. Trends Cell Biol. 2005;15:19–26. doi: 10.1016/j.tcb.2004.11.002. [DOI] [PubMed] [Google Scholar]
- 48.Peinado H, Portillo F, Cano A. Transcriptional regulation of cadherins during development and carcinogenesis. Int J Dev Biol. 2004;48:365–75. doi: 10.1387/ijdb.041794hp. [DOI] [PubMed] [Google Scholar]
- 49.Lee KH, Choi EY, Hyun MS, et al. Association of extracellular cleavage of E-cadherin mediated by MMP-7 with HGF-induced in vitro invasion in human stomach cancer cells. Eur Surg Res. 2007;39:208–15. doi: 10.1159/000101452. [DOI] [PubMed] [Google Scholar]
- 50.Xian W, Schwertfeger KL, Vargo-Gogola T, Rosen JM. Pleiotropic effects of FGFR1 on cell proliferation, survival, and migration in a 3D mammary epithelial cell model. J Cell Biol. 2005;171:663–73. doi: 10.1083/jcb.200505098. [DOI] [PMC free article] [PubMed] [Google Scholar]