

Abstract
This work reports results of experiments in hollow-fiber bioreactor C6 glioma cell cultures where the apparent diffusion coefficient (ADC) of intracellular water (iADC) was measured at diffusion times between 0.83 and 40 ms. The experiments were carried out before and after the onset of permanent ischemia. The changes in iADC following ischemia were dependent on the diffusion time employed in the experiment. An ischemia-induced decrease in the iADC was measured at short diffusion times, while at long diffusion times the iADC increased. Decreases in the iADC measured at short diffusion times are interpreted to be a result of a decrease in the intrinsic diffusivity of intracellular water due to energy failure. Increases in iADC measured at long diffusion times, are interpreted to result from cell swelling.
Introduction
Diffusion-weighted MRI (DWMRI) allows non-invasive measurement of water motion in living tissue. DWMRI results are often quantified via the apparent diffusion coefficient (ADC) of water, which is sensitive to the microstructural features of tissue. For instance, it is known that the ADC of water rapidly decreases in regions of the brain affected by ischemic stroke. Within minutes after the onset of ischemia, a 30 – 50% drop in the ADC is measured in the affected tissue (1, 2). Although this finding has was initially reported nearly two decades ago, there is still active debate over the biophysical mechanisms responsible.
A number of possible mechanisms have been hypothesized to be responsible for the drop in the ADC in brain tissue following ischemic insult. Increases in the intracellular volume fraction (IVF) from cellular swelling (3) would tend to reduce the ADC of tissue water as more water is included into the restricted intracellular space. Dilution of the intracellular space, however, would tend to decrease the cytosolic viscosity and increase the diffusion of water in the intracellular space. The extracellular space is known to be tortuous and increases in IVF associated with ischemia would increase the tortuosity of this compartment (3). This would further decrease the ADC of water in response to cell swelling. If there are energy-dependent processes within cells that enhance water movement, e.g. cytoplasmic streaming, ischemia would be expected to decrease intracellular diffusion which, in turn, could reduce the ADC. A decrease in membrane permeability following ischemia has also been hypothesized, which would increase the restriction experienced by intracellular water and decrease the ADC (4).
With the large number of biophysical mechanisms proposed to influence the ADC, it would be useful to use investigate these mechanisms individually and assess how they are affected by ischemia. Unfortunately, most experiments in living systems are unable to selectively measure water signal from individual tissue compartments, i.e. water residing in the intracellular and extracellular compartments cannot be investigated individually. In recent work, we have demonstrated the use of hollow-fiber bioreactors (HFBR) to investigate diffusion in the intracellular space of perfused cell cultures (5, 6). By infusion of a contrast agent (Gd-DTPA) into the media supplied to the bioreactor, water in the intracellular compartment is spectrally separated from the rest of the water in the cell culture, allowing the diffusion of intracellular water to be investigated individually.
The use of DWMRI to assess tissue properties is also hindered by hardware limitations in MR systems, e.g. limitations in gradient strength and slew rate, which dictates a minimum diffusion time over which diffusion can be investigated with conventional pulsed-field gradient spin-echo (PGSE) diffusion experiments. To alleviate this problem, alternative diffusion weighting waveforms can be utilized to achieve shorter diffusion times. For instance, oscillating gradient spin-echo (OGSE) diffusion experiments use sine and cosine-like diffusion waveforms to reach diffusion times shorter than those allowed by standard PGSE methods (7).
In this work, we have utilized OGSE and PGSE diffusion experiments to characterize the diffusion time dependence of the ADC of intracellular water (iADC) down to very short diffusion times (<1ms). Through model fitting, the intrinsic diffusivity of the intracellular space and the restriction length of the cells are estimated. Additionally, the time course of change in the iADC and intracellular T2 relaxation have been measured after the onset of permanent ischemia.
Methods
Cell Cultures
C6 rat glioma cells (American Type Culture Collection) were grown in a hollow-fiber bioreactor (HFBR) cell culture system as described previously (5, 6). The cylindrical HFBR (80 mm in length, 27 mm outer diameter), is constructed of polycarbonate casing, and contains approximately 450 microporous hollow fibers with an average pore size of 0.2 µm. Cells are infused into the extrafiber spaces through an inoculation port on the side of the HFBR casing. Glucose and oxygenated media (60% O2, 5% CO2, 35% N2), heated to 37 °C, is pumped through the porous fibers and exchanges with the extrafiber space. The bioreactor is maintained at 37°C before and after the onset of ischemia by running heated water through the MRI gradient coils surrounding the HFBR.
MR imaging and Spectroscopy
All MR experiments were carried out on a 9.4 Tesla Bruker AVANCE spectrometer, with shelf-shielded orthogonal imaging gradients (1000 mT/m maximum) and a 27 mm 1H birdcage RF used in both transmission and reception. As shown in Fig. 1A, time-of-flight MR angiography (TE = 3.5 ms, TR = 12 ms, NEX = 2) was used to verify a uniform delivery of media through the hollow-fibers. A diffusion-weighted image is shown in Fig. 1B (TE = 35 ms, TR = 1500 ms, δ = 4 ms, Δ = 20 ms, where δ is the length of each diffusion gradient pulse and Δ is the separation between them) collected 21 days after inoculation at a b-value of 2000 s/mm2. At this b-value, free water at body temperature is over 99% dephased, and only signal from slowly diffusing or restricted water remains (i.e. where cells are present). At 21 days after inoculation, cells have reached confluence within the bioreactor. Modulations in signal intensity around the edge of the bioreactor in both DW and angiograph images are due to B1 inhomogeneity caused by the RF birdcage coil elements. After the culture had reached confluence, 5mM Gd-DTPA was infused into the system, which spectrally separates the resonances of intracellular and extracellular water (6), and diffusion and relaxation experiments were initiate.
Figure 1.

A) Time-of-flight angiography through the center of the HFBR, showing a uniform delivery of media through the porous hollow fibers. B) DWMRI at b = 2000 s/mm2, revealing the distribution of cells within the bioreactor.
Diffusion-weighted point resolved spectroscopy (PRESS) was used to measure water diffusion within an 8×8×8 mm3 voxel within the center of the HFBR. As shown in Fig. 2, diffusion-weighted spectra were acquired by inserting PGSE (8) or modulated cosine OGSE (7) diffusion gradients around the first 180° localization pulse, where the diffusion gradients were applied simultaneous in the Y and Z axes. The b-value for OGSE and PGSE experiments are given by
and
respectively, where γ is the gyromagnetic ratio and G is the peak gradient strength within the waveform. In the OGSE experiment N is the number of lobes and T is the duration of the oscillating gradient pulse. Both PGSE (Δ = 10, 15, 20, 30, and 40 ms, δ = 4 ms) and OGSE (N = 6, 4, 2, and 1, T = 20 ms) diffusion measurements (TE = 56 ms, TR = 2500 ms) were acquired with 8 b-values between 0 and 350 s/mm2 by varying the gradient strength. The effective diffusion time, Δeff, for the OGSE experiments is given by Δeff = T/4N (7). The combination of OGSE and PGSE experiments produce Δeff = 0.83, 1.25 2.5, 5 (OGSE), 10, 15, 20, 30 and 40 ms (PGSE). Eddy current correction strategies were compared in studies of water and tetradecane (a 14-carbon alkane chain with a diffusivity of ≈ 0.45 at body temperature) phantoms. B-value corrections based upon measurements in water did not produce diffusion coefficients that were independent of diffusion time when applied to diffusion measurements in tetradecane. Alternatively, an eddy current correction scheme aimed at correcting for errors in the slice profile (by a single correction factor that is multiplied to the raw signal at every b-value) resulted in diffusion coefficients measured in both water and tetradecane that were independent of diffusion time. These correction factors were then applied to the diffusion experiments in the HFBR cell culture. To measure T2 relaxation times, a CPMG echo train (9) was appended to the PRESS localization sequence (TE = 16 ms, TR = 2500 ms, TECPMG = 5 ms), and localized spectra were acquired at TE = 16 to 166 ms in increments of 10 ms.
Figure 2.

PRESS pulse sequence with added PGSE or OGSE diffusion gradients. Diffusion gradients are applied simultaneously in both the Y and Z directions. In the PGSE diffusion waveform, Δeff is the duration between the gradients, and δeff is the duration of the gradient pulse. In the OGSE diffusion waveform, T is the length of the waveform, and N is the number of lobes, displayed here with N = 4.
All diffusion and CPMG measurements were repeated 3 times pre-ischemia. Ischemia was induced by shutting off the flow of media to the bioreactor. After the onset of ischemia, diffusion and CPMG measurements were acquired continuously for two hours in a 5 minute and 40 second loop. The levels of NTP following ischemia were obtained from identical bioreactor experiments carried out previously (5) by following the disappearance of the resonance of the β–phosphate of NTP (β-NTP) from a 31P spectrum of the bioreactor culture. It should be noted that although the NTP resonances may contain contributions from GTP, they primarily reflect levels of ATP within the cell culture.
Data Analysis
Each localized 1H spectrum was individually phased, and fit to the sum of three Lorentzian line shapes, corresponding to each of the three resonances. Signal from the intracellular water resonance was fit to a single-exponential decay vs. b-value to quantify an iADC. iADC vs. Δeff curves were fit to the Balinov et al. model of restricted diffusion (10) to provide estimates of the intrinsic intracellular diffusion coefficient, Dint, and restriction length. The model approximates the diffusion-MR signal, MI, as
where g is the gradient strength, a is the restriction length, and Dint is the intracellular diffusivity. The Balinov et al. model uses the Gaussian phase distribution (low b-value) approximation (11) to model the diffusion of water between parallel plates (which is equivalent to cubic cells in an isotropic tissue), and assumes no exchange between intracellular and extracellular compartments. The validity of this assumption is discussed further below. PGSE data were fit with δ = 4 ms, and Δ = 10, 15, 20, 30, and 40 ms. For OGSE experiments, analogous Δ and δ were calculated as Δ = δ = T/4N. Signal from the resonance of intracellular and extracellular water from CPMG measurements were fit to a single exponential decay between TEs of 16 and 116 ms to quantify intracellular and extracellular T2 coefficients, respectively.
Results
1H spectra obtained from within an 8 × 8 × 8 mm3 voxel are shown in Fig. 3. Spectra are shown that were obtained prior to ischemia and at 20, 40 and 120 min following the onset of ischemia. For simplicity, the time after the onset of ischemia will be subsequently referred to as time post-ischemia. Prior to ischemia, the localized spectrum is comprised of three individual peaks, consistent with prior experiments (5, 6), which can be assigned to the resonances of extracellular water (leftmost peak), water within the porous fiber wall (small central peak), and intracellular water (rightmost peak). Post-ischemia, there is an increase in the spectral separation between the resonances of intracellular and extracellular water where the extracellular resonance shifts to higher frequencies and the intracellular resonance shifts to lower frequencies. There is also a slight broadening of the resonance of extracellular water, and a narrowing of that of the intracellular water. It should be noted that the localized spectra were collected at a TE = 16 ms, and therefore spectral areas do not directly correspond to absolute compartment volumes due to compartment specific T2 decays. When considering the geometry of the bioreactor system and correcting for T2 decay using measured relaxation times, the calculated extrafiber IVF changes from a pre-ischemia value of approximately 0.92 to a post-ischemia value of 0.97.
Figure 3.

1H spectra from PRESS localized spectroscopy (TE = 16 ms, TR = 2500 ms), of the HFBR showing a splitting of the water signal into three resonances corresponding to water in the extracellular and intraluminal space (+200 Hz), water residing in the fiber wall (+135 Hz), and intracellular water (+15 Hz). Spectra are shown that were obtained pre-ischemia, and 20, 40 and 120 min post-ischemia.
Intracellular signal is plotted vs. b-value in Fig. 4, at representative Δeff values of 0.83 (OGSE), 5 (OGSE), and 30 ms (PGSE). Single exponential fits of the data are shown as solid lines. The iADC calculated from this data is plotted vs Δeff in Fig. 5A along with the diffusivity within a water phantom at 25 °C. Eddy currents are evident in the diffusivity of free water in the PGSE experiments as an increase in the measured diffusivity with decreasing diffusion time, and in the OGSE experiments as a decrease in the measured diffusivity with an increasing number of lobes (i.e. decreasing diffusion time). Eddy currents decrease the diffusivity in OGSE experiments by acting as a low-pass filter – slightly attenuating the OGSE waveform at the higher frequencies used in this experiment. The difference between the water diffusivities and the known diffusivity of water at 25° C (2.3 µm2/ms) (12) were used to correct the iADCs (as described in methods) shown in Fig. 5B and 5C
Figure 4.

Intracellular water signal vs. b-value at Δeff = 0.83, 5 and 30 ms. Solid black lines represent single exponential fits to the data.
Figure 5.
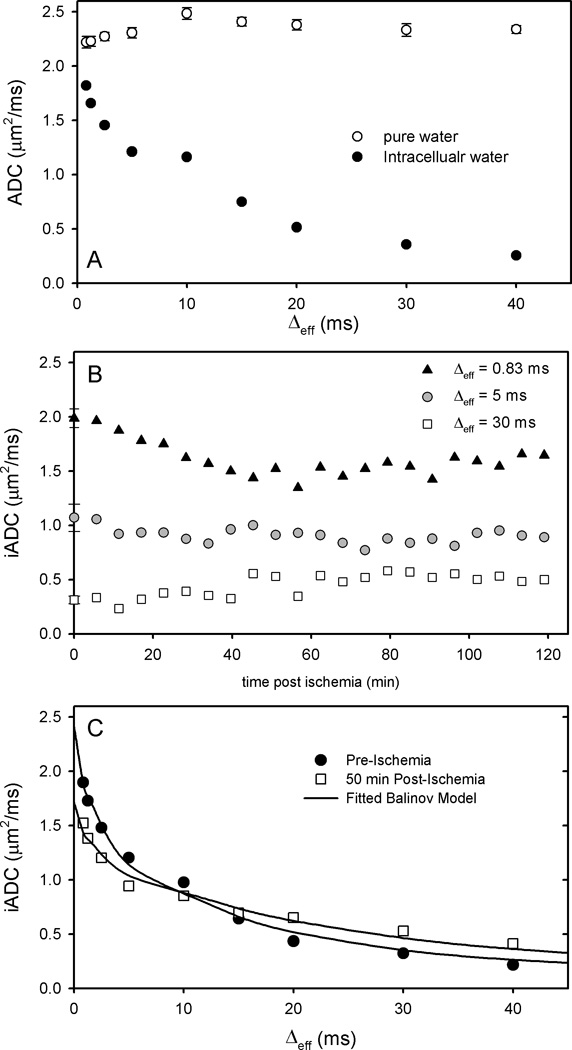
A) Diffusivity of a water phantom at 25°C and iADC (pre-ischemia) vs. effective diffusion time. The diffusivity within the water phantom is used to calibrate iADCs to offset the effects of eddy currents. B) iADC at Δeff = 0.83 (OGSE), 10, and 30 ms (both PGSE) vs. time post ischemia. Pre-ischemia values are shown at 0 min +/− SD. The iADC at short Δeff decreases after ischemia, while it increases at long Δeff. At an intermediate diffusion time, Δeff = 10 ms, no significant change in the iADC is observed post-ischemia. C) Calibrated iADC vs effective diffusion time (pre- and 50 min post-ischemia). Data were fit to the Balinov et al. model of intracellular diffusion, and fits are shown as black lines.
The iADC at three different diffusion times is plotted vs. time post-ischemia in Fig. 5B. Consistent with trends found previously in these cell cultures (5), the iADC at the long diffusion time, Δeff = 30 ms, increases within the first 50 min after ischemia, changing from approximately 0.35 to 0.5 µm2/ms. In contrast to this, the iADC at the short diffusion time, Δeff = 0.83 ms, decreases from approximately 2.0 µm2/ms to 1.5 µm2/ms during the same time period. At an intermediate diffusion time, Δeff = 5 ms, almost no change in the iADC is observable following the onset of ischemia.
After approximately 50 minutes post ischemia, the iADC appears stable at all diffusion times. Pre-ischemia and post-ischemia (50 min) iADC values obtained at a number of diffusion times are plotted in Fig. 5C. Consistent with the trends seen in Fig. 5B, the iADC at short diffusion times decreases post ischemia, while the iADC at long diffusion times increases post-ischemia. IADC vs. Δeff curves were individually fit to the Balinov et al. model of intracellular diffusivity (10) and fits are shown as solid lines. Values of the two fitting parameters of this model, Dint and restriction length, are plotted as a function of time post ischemia in Fig. 6. Dint drops from its pre-ischemia value of 2.5 µm2/ms to a value of approximately 1.7 µm2/ms in the first 50 min after the onset of ischemia. This decrease in Dint correlates very well to the decrease in NTP measured by 31P spectra in separate, but identical bioreactor experiments (5). The signal from β-NTP is depleted within the first hour after ischemia, and the β-NTP signal is included in Fig. 6A as a solid gray line. During this same time, the predicted restriction length increases from a value of 12 µm to approximately 14 µm.
Figure 6.

Dint and β-NTP (A) and restriction length (B) parameterized from the Balinov et al. model plotted vs. time post ischemia. The estimated Dint decreases 32%, from 2.5 µm2/ms pre-ischemia to about 1.7 µm2/ms in the first 50 min post-ischemia. The fitted restriction length increases from 12 µm to about 14 µm post ischemia.
Intracellular and extracellular T2 relaxation times are plotted vs. time post ischemia in Fig. 7. The intracellular T2 increases from approximately 26 ms to 41 ms post-ischemia, with the largest changes occurring in the first 50 minutes. Extracellular T2 decreases from approximately 36 ms to 30 ms over the same time period.
Figure 7.

Intracellular and extracellular T2 relaxation times from CPMG measurements vs. time post ischemia. Intracellular T2 increases from 26 ms to 41 ms, while extracellular T2 decreases from 36 ms to about 30 ms post-ischemia. At t = 0, the bioreactor is still flowing and the extracellular T2 is not measureable.
Discussion
While these experiments were carried out in perfused cell cultures of C6 glioma cells, the results can yield insight into the measurement of ADCs in living tissue and into the mechanisms underlying observed changes in the ADC following ischemic events. First, a pre-ischemia iADC value of 1.9 µm2/ms was experimentally measured at a diffusion time of 0.83 ms and modeling of the diffusion time dependence of iADC predicted a value of 2.5 µm2/ms for the intrinsic intracellular diffusion coefficient, Dint. This is only slightly lower than the diffusivity of free water at body temperature, 3.1 µm2/ms (12). The value of Dint is in general agreement with previous experiments on perfused HeLa cells where an intrinsic diffusion coefficient of 2.0 µm2/ms was estimated from experiments exploring diffusion times down to 3 ms (13). Such values are higher than would be expected from estimations of the protein concentration of the intracellular space (14, 15). Therefore, it is possible that mechanisms other than thermally-induced Brownian motion serve to increase the intrinsic diffusion of water above that expected in non-energetic cells.
The results of iADC measurements carried out at short and long diffusion times indicate that the biophysical mechanisms responsible for changes in ADC depend on the diffusion time at which it is measured. This is not surprising and is consistent with previous diffusion measurements of intracellular water in other perfused cell culture systems. Pilatus et al. studied a variety of cell cultures and measured the signal decay of the total water signal versus b-value at diffusion times between 8 and 108 ms (16). The data were fit to a bi-exponential model that determined the ADC of fast and slow water components. The ADC of the slowly diffusing component was found to decrease with increasing diffusion time, indicating an increasing effect of restriction with increasing diffusion time. More recently, the iADC of water has been measured directly in perfused HeLa cells at multiple diffusion times from 3 to 300 ms (13). A significant reduction of iADC with increasing diffusion times was seen, consistent with the increasing effects of restriction of the cell membrane with increasing diffusion time.
Ischemia-induced changes in iADC: short diffusion times
In the first 50 minutes following the onset of ischemia, a 25% decrease in the iADC measured at the shortest diffusion times is observed. The length scale over which intracellular water is diffusing at these short diffusion times is much smaller than the cell size (10 –12 µm in diameter), with a mean squared displacement of less than 2 µm at Δeff = 0.83 ms. Therefore, the reduction in iADC at the short diffusion times should be most sensitive to the intrinsic diffusivity of intracellular water, Dint.
The decrease in the calculated Dint from its pre-ischemia value of 2.5 µm2/ms to its post-ischemia value of 1.7 µm2/ms is highly correlated with the reduction of energetic metabolites within the cells as seen in Fig. 6A (5). The correlation suggests an energy-dependent mechanism within the cell that is shut down during ischemia. As mentioned previously, the pre-ischemia value of Dint is higher than that expected if the intracellular space was a uniform solution of macromolecules. The post ischemia value, however, is consistent with that expected from a macromolecular solution. If the inside of the post-ischemia C6 glioma cell is modeled as a uniform solution of macromolecules (15), the value of Dint predicts an intracellular water content of approximately 85%. This is close to the water content of 80% that has previously been measured in glial cells (14). The post-ischemia value of Dint is also very close to that estimated from experiments on packed erythrocytes, ~ 1.6 µm2/ms (17). Since erythrocytes are not metabolically active, it is expected that energy-dependent mechanisms would not be present.
The observed ischemia-induced decrease in the iADC at short diffusion times is consistent with previous measurements of the ADC of intracellular metabolites. Van der Toorn et al. found a 29% decrease in the ADC of creatine, and a 19% decrease in the ADC of NAA in rat brain after ischemia (18). A 40% decrease in the ADC of intracellular 2FDG-6P following ischemia was also observed in globally ischemic rat brain (19). The diffusion coefficients of these intracellular metabolites are much smaller than that of water. At the diffusion time employed in those measurements (between 17 and 22 ms), these molecules have a mean squared displacement of less than 3 µm, and will be highly sensitive to intrinsic properties of the intracellular space while being minimally affected by the cell membrane. Assuming these metabolites are free to diffuse within the intracellular space, the ADC of these molecules at long diffusion times should be sensitive to the same biophysical mechanisms responsible for the diffusion of water measured at short diffusion times. In both cases, a decrease in molecular movement is observed following the onset of ischemia.
Ischemia –induced changes in iADC: long diffusion times
The increase in the iADC observed post-ischemia at long diffusion times agrees with previous measurements made in these same cell cultures (5). This trend is consistent with an increase in the restriction length, or cell size, predicted from the model fitting shown in Fig. 6. The model of intracellular diffusivity employed in this work (10) predicts that the iADC at long diffusion times is sensitive to the restriction length, and very insensitive to changes in Dint. This can be observed in the correlation between the measured iADC at long diffusion times and the predicted restriction length.
The mechanisms of cellular swelling in response to ischemia are generally understood (20). Normally, a low intracellular Na+ concentration is maintained as Na+ is actively pumped out of the cell by the Na+/K+ ATPase. Under ischemic conditions, there is no ATP to power the Na+/K+ ATPase and the intracellular Na+ concentration increases. This causes water to enter the cell osmotically (20), thereby increasing the cell size and the IVF. In the present study, increases in the iADC at long diffusion times are measured over the course of the first 50 minutes. As seen in Fig. 6A, these cells are also depleted of NTP over this same time frame. Therefore, it is probable that the increase in iADC found in this model cell system at long diffusion times is caused by cell swelling due to the loss of ATP to power the Na+/K+ ATPase.
The increase in the iADC measured at long diffusion times is in apparent conflict with a decrease in the global ADC of tissue. This may be due to functional or morphological differences between highly heterogeneous brain tissue and the relatively homogeneous 3D cell culture grown in the HFBR. An increase in iADC, however, does not necessarily rule out a decrease in global ADC. If the ADC of extracellular water (eADC) is larger than that of the iADC, even after a slight increase in iADC post ischemia, an increase in the IVF resulting from a shift of water from the extracellular space to the more restricted intracellular space could result in a reduction of the global ADC. Precise values of the eADC of water, however, pose significant challenges to measure in vivo, and might not be drastically higher than iADC (21). Unfortunately, our system did not permit measurement of eADC due to overlapping resonances of extracellular and intrafiber water.
Previous studies of intracellular diffusion have reported results that conflict with the post-ischemia increase in iADC observed in this study. Silva et al. injected contrast agent into the cerebrospinal fluid of rats to selectively remove the signal from extracellular brain water and reported a decrease in the intracellular ADC after ischemia at a diffusion time of 33.25 ms (22). In another study, Goodman et al. used 133Cs+, a K+ analog, as a marker of intracellular diffusion (23, 24). A 75% drop in the ADC of 133Cs+ was measured at diffusion times of 22–24 ms in rat brain after rats were euthanized with a 1 ml bolus of 2M KCl injected in the tail vein. Both of these studies employed diffusion times where we measured a slight increase in iADC of water. Again, these differences may be related to the differences between brain tissue and our homogeneous cell cultures. Results could also differ due to assumptions on the relative contribution of signal from the intracellular and extracellular compartments inherent to each set of experiments, or to differences between the diffusion of water and intracellular ions.
Modeling of intracellular water diffusion
The estimates of Dint and the restriction length found in the present work obviously depend upon the validity of the Balinov et al. model (10) employed to determine these parameters. The model of restricted diffusion assumes the phase distribution of diffusing water is Gaussian, which is appropriate for the small b-values used in this work. The model does not depend upon the short gradient pulse approximation but allows for finite pulse widths. However, the sine and cosine shaped OGSE waveform used in the experiment is approximated within the model by a short bipolar pulse corresponding to the period of the OGSE waveform. Other models of intracellular diffusivity were also considered. The model by Tanner and Stejskal (25) uses the short gradient pulse approximation, and does not appropriately match the OGSE experiment. A model by Murday and Cotts (26) uses the Gaussian phase distribution approximation to model diffusion within a spherical cell. The intrinsic diffusivity and root mean squared displacement estimated from both the Balinov et al. and Murday and Cotts models were identical.
Exchange of water between the intracellular and extracellular compartments during the diffusion time is a possible source of error in the model fitting. The Balinov model assumes no exchange between the compartments during the diffusion time, which is likely not valid at longer diffusion times. A full discussion of the effects of exchange on measured diffusion is outside the scope of this work, but some comments on the effects of exchange on the modeling parameters are warranted. At issue is whether or not the changes we observe in iADC following ischemia can be the result, in part or in full, of changes in the exchange rate between intracellular and extracellular spaces. We do not think this is a significant factor in our system for a few reasons. First, the extracellular space is estimated to be very small (8% pre-ischemia and 3% post ischemia). With this range of IVF, it would be difficult for the water in the extracellular space to greatly influence the water in the intracellular space. Second, the spectral separation of the two spaces causes a lack of phase coherence between intracellular and extracellular water, which could lessen any effects of exchange with extracellular water. A more complete modeling of the effects of exchange on measured intracellular diffusion is the topic of ongoing research.
Effects of extracellular Gd-DTPA on diffusion measurements
To achieve the spectra separation of the intracellular and extracellular space, the culture is perfused with media containing 5 mM Gd-DTPA. When interpreting the results of this study, it is important to understand the effects that Gd-DTPA will have on diffusion measurements within the cell culture. Since Gd-DTPA causes the extracellular compartment to be at a different magnetic susceptibility than the intracellular compartment, it is likely that susceptibility gradients exist near the cell membrane. Such gradients have been shown to cause an underestimation of the ADC (27). However, the underestimation of the ADC due to susceptibility gradients is diffusion time dependent and will be diminished at short diffusion times (28). Therefore, the iADC measured at short diffusion times will be insensitive to susceptibility gradients, and the value of Dint estimated in this work should not be greatly affected by the presence of Gd-DTPA. At long diffusion times, susceptibility gradients, and the change in susceptibility gradients associated with ischemia, will have a greater affect on diffusion measurements. Since Gd-DTPA does not cross the cell membrane, the cell swelling that occurs following the onset of ischemia causes a decrease in the extracellular volume and therefore an increase in the Gd-DTPA concentration in the extracellular space. The increased concentration of Gd-DTPA in the extracellular space causes an increase of the susceptibility difference between the intracellular and extracellular space, which translates into a greater separation in the 1H spectrum as shown in Fig. 3. A greater susceptibility difference would cause a further underestimation of the iADC. However, in the context of ischemia, this effect is mitigated by the concomitant cell swelling, which decreases the relative spatial extent of susceptibility gradients within the cell. Overall, the observed increase in the measured iADC at long diffusion times is indicative of an increase in the cell size, but could be partially a result of a decrease in the effect of susceptibility gradients.
T2 relaxation measurements
Since Gd-DTPA does not cross the cell membrane, the decrease in the extracellular T2 after ischemia is likely caused by an increase in the Gd-DTPA concentration in the extracellular space as water is shifted from the extracellular space to the intracellular space. As noted before, increases in the concentration of Gd-DTPA in the extracellular space are also reflected in the increase in spectral separation between the resonances of intracellular and extracellular water seen in Fig. 3.
The intracellular T2 was measured to increase from a pre-ischemia value of approximately 26 ms to a post-ischemia value of 41 ms. This is reflected in the spectral changes seen in Fig. 3 where the linewidth of the intracellular resonance is reduced after the onset of ischemia. This decrease could be caused by many factors. When the cells swell, the inclusion of more water into the intracellular space will dilute the macromolecular contents of the cell, thereby decreasing the effective viscosity of the intracellular space and increasing the T2 relaxation time. It is also possible that the change in intracellular T2 is influenced by the post-ischemia change in susceptibility gradients across the boundary of the cell (29, 30). If less water in the cell experiences the susceptibility gradients near the membrane surface, then T2 relaxation times would increase. However, the CPMG refocusing scheme used in these experiments should make changes in T2 due to changes in susceptibility gradients insignificant compared to the intrinsic T2 of the intracellular space. It should be noted that susceptibility gradients might still play a role in the determining the value of intracellular T2. While the intrinsic T2 of intracellular water increases post-ischemia, the absolute value of the intracellular T2 relaxation times measured in this cell culture system may be affected by the presence of Gd-DTPA in the extracellular space.
The increase in intracellular T2 immediately following ischemia observed in this work might seem to be in conflict with measurements in clinical and experimental stroke, where the T2 of brain water is not observed to change until many hours after ischemia (31). However, precise values of intracellular and extracellular T2 are not known, and several reports have suggested that the intracellular T2 may be lower than the extracellular T2 in brain tissue (32–35). If the intracellular T2 was indeed lower than the extracellular T2, a change in IVF alone would result in a change of the global T2 of tissue, due to an increase in the volume of tissue at the lower T2 relaxation time. A simultaneous decrease in the extracellular T2 and/or an increase in the intracellular T2, as suggested in this work, could counteract this change and maintain a constant T2 of tissue as cells swell.
Relevance of ADC changes to ischemic stroke
The results from this study indicate that the decrease in the iADC in C6 glioma cells, measured at short diffusion times, is likely related to a decrease in the diffusivity of intracellular water within the cell. The iADC measured at long diffusion times appears insensitive to change in Dint, but sensitive of increases in cell size. Further, these results suggest that the decrease in metabolic activity within the cell is responsible for both a drop in the diffusivity of intracellular water and an increase in the IVF, which would cause a decrease in the ADC independent of the diffusion time at which experiments are being evaluated. A potential limitation in using these results to understand the mechanisms underlying ADC changes in ischemic stroke is the difference between the C6 glioma cell culture used in this report and brain tissue. The bioreactor system does not mimic brain tissue and C6 cells could respond differently to ischemic conditions than non-transformed cells. However, the two basic cellular responses to ischemia, i.e. energetic metabolism failure and cellular swelling, are present both in our C6 cell culture (this work) and regular astrocytes. This is important as these two responses are thought to be the major pathophysiological events driving ADC changes. Interestingly, a previous 31P MRS study comparing C6 glioma cells and primary cultures of astrocytes concluded that under a variety of experimental conditions, i.e. anoxia, ischemia and glucose starvation, rat astrocytes in primary culture showed a very similar behavior to that of C6 cells (36).
If the intracellular water diffusion properties observed in our 3D cell system in response to ischemia are similar to that of regular astrocytes our results imply that the decrease in tissue ADC following an ischemic stroke measured at clinically relevant diffusion times, i.e. 30 ms and longer, is primarily due to an increase in the IVF resulting from cell swelling. While this interpretation is consistent with some previous work (17, 37), it is in apparent conflict with other experiments that have limited the influence of IVF on the ADC of water. For instance, Buckley et al. perfused ouabain, which causes cell swelling without changing metabolic activity by blocking the Na+/K+ ATPase, into hippocampal slices and found only a 20% decrease in the ADC (32). Similarly, van Pul et al. measured the ADC in hippocampal slices and found only a 20% decrease in ADC due to osmotic cell swelling, and a ~40% decrease in the ADC after ischemia (38). However, both of these studies were performed at relatively short diffusion times, 10 and 7 ms respectively. Results from the current work indicate that, at these diffusion times, the ADC will be only partially sensitive to changes in the IVF, and will be most sensitive to changes in Dint. This is consistent with the 20% and 40% decrease in ADC measured cell swelling and in ischemia, respectively, in these model systems. As mentioned previously, diffusion measurements of intracellular Cs+ before and after ischemia in rat brain (23) predict a larger effect of intracellular diffusion at long diffusion times and are in apparent conflict with this interpretation. It is possible that intracellular water and Cs+ could have different responses to energy failure. However, it is also possible that this discrepancy is caused by either a difference in the response of our C6 cells to ischemia, or to morphological/structural differences between naturally heterogeneous brain tissue and the relative homogeneous 3D cell structures grown in the bioreactor.
Conclusion
In this work, the diffusive properties of intracellular water in bioreactor C6 glioma cell cultures have been measured over a wide range of diffusion times, before and after the onset of ischemia. At short diffusion times, a decrease in the intracellular ADC is measured that is directly correlated to a loss of ATP within the cells. At long diffusion times, an increase in the intracellular ADC is measured which is predicted to be indicative of an increase in the cell size. This work suggests that the biophysical mechanisms responsible for a drop in ADC following ischemia are diffusion time dependent. At short diffusion times, the ADC would be heavily influenced by the intrinsic diffusive properties of intracellular water, while at long diffusion times the ADC would be preferentially influenced by changes in cell size and the cellular volume fraction.
Acknowledgements
This work was supported by NIH grant CA88285 and the Arizona Biomedical Research Commission.
References
- 1.Moseley ME, Cohen Y, Mintorovitch J, Chileuitt L, Shimizu H, Kucharczyk J, Wendland MF, Weinstein PR. Early detection of regional cerebral ischemia in cats: Comparison of diffusion- and T2-weighted MRI and spectroscopy. Magnetic Resonance in Medicine. 1990;14(2):330–346. doi: 10.1002/mrm.1910140218. [DOI] [PubMed] [Google Scholar]
- 2.Warach S, Chien D, Li W, Ronthal M, Edelman RR. Fast magnetic resonance diffusion-weighted imaging of acute human stroke. Neurology. 1992;42(9):1717. doi: 10.1212/wnl.42.9.1717. [DOI] [PubMed] [Google Scholar]
- 3.Syková E, Svoboda J, Polák J, Chvátal A. Extracellular volume fraction and diffusion characteristics during progressive ischemia and terminal anoxia in the spinal cord of the rat. J Cereb Blood Flow Metab. 1994 Mar;14(2):301–311. doi: 10.1038/jcbfm.1994.37. [DOI] [PubMed] [Google Scholar]
- 4.Helpern JA, Ordidge RJ, Knight RA. The effect of cell membrane water permeability on the apparent diffusion coefficient of water. Berlin: 1992. p. 201. [Google Scholar]
- 5.Trouard TP, Harkins KD, Divijak JL, Gillies RJ, Galons J-P. Ischemia-induced changes of intracellular water diffusion in rat glioma cell cultures. Magnetic Resonance in Medicine. 2008;60(2):258–264. doi: 10.1002/mrm.21616. [DOI] [PMC free article] [PubMed] [Google Scholar]
- 6.Galons J-P, Lope-Piedrafita S, Divijak JL, Corum C, Gillies RJ, Trouard TP. Uncovering of intracellular water in cultured cells. Magnetic Resonance in Medicine. 2005;54(1):79–86. doi: 10.1002/mrm.20565. [DOI] [PMC free article] [PubMed] [Google Scholar]
- 7.Does MD, Parsons EC, Gore JC. Oscillating gradient measurements of water diffusion in normal and globally ischemic rat brain. Magnetic Resonance in Medicine. 2003;49(2):206–215. doi: 10.1002/mrm.10385. [DOI] [PubMed] [Google Scholar]
- 8.Stejskal EO, Tanner JE. Spin Diffusion Measurements: Spin Echoes in the Presence of a Time-Dependent Field Gradient. The Journal of Chemical Physics. 1965;42(1):288–292. [Google Scholar]
- 9.Meiboom S, Gill D. Modified Spin-Echo Method for Measuring Nuclear Relaxation Times. Review of Scientific Instruments. 1958;29(8):688–691. [Google Scholar]
- 10.Balinov B, Jonsson B, Linse P, Soderman O. The NMR Self-Diffusion Method Applied to Restricted Diffusion. Simulation of Echo Attenuation from Molecules in Spheres and between Planes. Journal of Magnetic Resonance, Series A. 1993;104(1):17–25. [Google Scholar]
- 11.Neuman CH. Spin echo of spins diffusing in a bounded medium. The Journal of Chemical Physics. 1974;60(11):4508–4511. [Google Scholar]
- 12.Mills R. Self-diffusion in normal and heavy water in the range 1–45.deg. J Phys Chem. 1973;77(5):685–688. [Google Scholar]
- 13.Zhao L, Sukstanskii AL, Kroenke CD, Song J, Piwnica-Worms D, Ackerman JJH, Neil JJ. Intracellular water specific MR of microbead-adherent cells: Hela cell intracellular water diffusion. Magnetic Resonance in Medicine. 2008;59(1):79–84. doi: 10.1002/mrm.21440. [DOI] [PMC free article] [PubMed] [Google Scholar]
- 14.LoPachin RM, Jr, Stys PK. Elemental composition and water content of rat optic nerve myelinated axons and glial cells: effects of in vitro anoxia and reoxygenation. J Neurosci. 1995;15(10):6735–6746. doi: 10.1523/JNEUROSCI.15-10-06735.1995. [DOI] [PMC free article] [PubMed] [Google Scholar]
- 15.Mackie JS, Meares P. The Diffusion of Electrolytes in a Cation-Exchange Resin Membrane. I. Theoretical. Proceedings of the Royal Society of London Series A, Mathematical and Physical Sciences. 1955;232(1191):498–509. [Google Scholar]
- 16.Pilatus U, Shim H, Artemov D, Davis D, van Zijl PC, Glickson JD. Intracellular volume and apparent diffusion constants of perfused cancer cell cultures, as measured by NMR. Magn Reson Med. 1997;37(6):825–832. doi: 10.1002/mrm.1910370605. [DOI] [PubMed] [Google Scholar]
- 17.Latour LL, Svoboda K, Mitra PP, Sotak CH. Time-Dependent Diffusion of Water in a Biological Model System. Proceedings of the National Academy of Sciences of the United States of America. 1994;91(4):1229–1233. doi: 10.1073/pnas.91.4.1229. [DOI] [PMC free article] [PubMed] [Google Scholar]
- 18.van der Toorn A, Dijkhuizen RM, Tulleken CAF, Nicolay K. Diffusion of metabolites in normal and ischemic rat brain measured by localized 1H MRS. Magnetic Resonance in Medicine. 1996;36(6):914–922. doi: 10.1002/mrm.1910360614. [DOI] [PubMed] [Google Scholar]
- 19.Duong TQ, Ackerman JJH, Ying HS, Neil JJ. Evaluation of extra- and intracellular apparent diffusion in normal and globally ischemic rat brain via 19F NMR. Magnetic Resonance in Medicine. 1998;40(1):1–13. doi: 10.1002/mrm.1910400102. [DOI] [PubMed] [Google Scholar]
- 20.Hossmann K-A. The pathophysiology of experimental brain edema. Neurosurgical Review. 1989;12(4):263–280. doi: 10.1007/BF01780838. [DOI] [PubMed] [Google Scholar]
- 21.Kroenke CD, Ackerman JJH, Neil JJ. Magnetic resonance measurement of tetramethylammonium diffusion in rat brain: Comparison of magnetic resonance and ionophoresis in vivo diffusion measurements. Magnetic Resonance in Medicine. 2003;50(4):717–726. doi: 10.1002/mrm.10579. [DOI] [PubMed] [Google Scholar]
- 22.Silva MD, Omae T, Helmer KG, Li F, Fisher M, Sotak CH. Separating changes in the intra- and extracellular water apparent diffusion coefficient following focal cerebral ischemia in the rat brain. Magnetic Resonance in Medicine. 2002;48(5):826–837. doi: 10.1002/mrm.10296. [DOI] [PubMed] [Google Scholar]
- 23.Goodman JA, Ackerman JJ, Neil JJ. Cs + ADC in rat brain decreases markedly at death. Magn Reson Med. 2008;59(1):65–72. doi: 10.1002/mrm.21418. [DOI] [PMC free article] [PubMed] [Google Scholar]
- 24.Neil J, Duong T, Ackerman J. Evaluation of intracellular diffusion in normal and globally-ischemic rat brain via 133Cs NMR. Magnetic Resonance in Medicine. 1996;35(3):329–335. doi: 10.1002/mrm.1910350310. [DOI] [PubMed] [Google Scholar]
- 25.Tanner JE, Stejskal EO. Restricted Self-Diffusion of Protons in Colloidal Systems by the Pulsed-Gradient, Spin-Echo Method. The Journal of Chemical Physics. 1968;49(4):1768–1777. [Google Scholar]
- 26.Murday JS, Cotts RM. Self-Diffusion Coefficient of Liquid Lithium. The Journal of Chemical Physics. 1968;48(11):4938–4945. [Google Scholar]
- 27.Does MD, Zhong J, Gore JC. In vivo measurement of ADC change due to intravascular susceptibility variation. Magnetic Resonance in Medicine. 1999;41(2):236–240. doi: 10.1002/(sici)1522-2594(199902)41:2<236::aid-mrm4>3.0.co;2-3. [DOI] [PubMed] [Google Scholar]
- 28.Zhong J, Kennan RP, Gore JC. Effects of susceptibility variations on NMR measurements of diffusion. Journal of Magnetic Resonance. 1991;95:267–280. [Google Scholar]
- 29.Callaghan PT. Principles of Nuclear Magnetic Resonance Microscopy. Oxford Press; 1991. [Google Scholar]
- 30.Kennan RP, Zhong J, Gore JC. Intravascular susceptibility contrast mechanisms in tissues. Magnetic Resonance in Medicine. 1994;31(1):9–21. doi: 10.1002/mrm.1910310103. [DOI] [PubMed] [Google Scholar]
- 31.Warach S, Gaa J, Siewert B, Wielopolski P, Edelman RR. Acute human stroke studied by whole brain echo planar diffusion-weighted magnetic resonance imaging. Annals of Neurology. 1995;37(2):231–241. doi: 10.1002/ana.410370214. [DOI] [PubMed] [Google Scholar]
- 32.Buckley DL, Bui JD, Phillips MI, Zelles T, Inglis BA, Plant HD, Blackband SJ. The effect of ouabain on water diffusion in the rat hippocampal slice measured by high resolution NMR imaging. Magnetic Resonance in Medicine. 1999;41(1):137–142. doi: 10.1002/(sici)1522-2594(199901)41:1<137::aid-mrm19>3.0.co;2-y. [DOI] [PubMed] [Google Scholar]
- 33.Vestergaard-Poulsen P, Hansen B, Østergaard L, Jakobsen R. Microstructural changes in ischemic cortical gray matter predicted by a model of diffusion-weighted MRI. Journal of Magnetic Resonance Imaging. 2007;26(3):529–540. doi: 10.1002/jmri.21030. [DOI] [PubMed] [Google Scholar]
- 34.Schoeniger JS, Aiken N, Hsu E, Blackband SJ. Relaxation-Time and Diffusion NMR Microscopy of Single Neurons. Journal of Magnetic Resonance, Series B. 1994;103(3):261–273. doi: 10.1006/jmrb.1994.1039. [DOI] [PubMed] [Google Scholar]
- 35.Harkins KD, Galons J-P, Secomb TW, Trouard TP. Assessment of the Effects of Cellular Tissue Properties on ADC Measurements by Numerical Simulation of Water Diffusion. Accepted with minor revisions to Magnetic Resonance in Medicine. doi: 10.1002/mrm.22155. [DOI] [PMC free article] [PubMed] [Google Scholar]
- 36.Pianet I, Merle M, Labouesse J, Canioni P. Phosphorus-31 nuclear magnetic resonance of C6 glioma cells and rat astrocytes. Evidence for a modification of the longitudinal relaxation time of ATP and Pi during glucose starvation. Eur J Biochem. 1991;195(1):87–95. doi: 10.1111/j.1432-1033.1991.tb15679.x. [DOI] [PubMed] [Google Scholar]
- 37.Szafer A, Zhong J, Gore JC. Theoretical Model for Water Diffusion in Tissues. Magnetic Resonance in Medicine. 1995;33(5):697–712. doi: 10.1002/mrm.1910330516. [DOI] [PubMed] [Google Scholar]
- 38.van Pul C, Jennekens W, Nicolay K, Kopinga K, Wijn PFF. Ischemia-induced ADC changes are larger than osmotically-induced ADC changes in a neonatal rat hippocampus model. Magnetic Resonance in Medicine. 2005;53(2):348–355. doi: 10.1002/mrm.20353. [DOI] [PubMed] [Google Scholar]