

Abstract
Temporal-lobe epilepsy (TLE) involves seizures that typically originate in the hippocampus. There is evidence that seizures involve anatomically and functionally connected brain networks within and beyond the temporal lobe. Many studies have explored the effect of TLE on gray matter and resting-state functional connectivity in the brain. However, the relationship between structural and functional changes has not been fully explored. The goal of this study was to investigate the relationship between gray matter concentration (GMC) and functional connectivity in TLE at the voxel level. A voxel-wise linear regression analysis was performed between GMC maps and whole-brain resting-state functional connectivity maps to both the left thalamus (Lthal) and the left hippocampus (LH) in a group of 15 patients with left TLE. Twenty regions were found that exhibited GMC decreases linearly correlated with resting-state functional connectivity to either the LH or the Lthal in the patient group only. A subset of these regions had significantly reduced GMC, and one of these regions also had reduced functional connectivity to the LH in TLE compared to the controls. These results suggest a network of impairment in left TLE where more severe reductions in GMC accompany decreases (LH, Lthal, right midcingulate gyrus, left precuneus, and left postcentral gyrus) or increases (LH to right thalamus) in resting functional connectivity. However, direct relationships between these imaging parameters and disease characteristics in these regions have yet to be established.
Key words: biological parametric mapping, brain, connectivity, functional MRI, functional network, robust, temporal-lobe epilepsy, voxel-based morphomentry
Introduction
Mesial temporal-lobe epilepsy (TLE) involves seizures that typically originate in the hippocampus. There is growing evidence to support a functionally and anatomically connected network or networks of neural structures within and beyond the temporal lobe that are involved in seizure propagation (Bettus et al., 2009; Blumenfeld et al., 2004; Bonilha et al., 2004; Morgan et al., 2010; Spencer, 2002). These networks frequently include the hippocampi, the thalamus, the amygdalae, the entorhinal cortices, lateral temporal neocortices, the inferior frontal lobes, the cerebellum, and the brainstem (Norden and Blumenfeld, 2002; Spencer, 2002).
The most common structural defect associated with TLE is hippocampal sclerosis (Margerison and Corsellis, 1966). However, studies examining the gray matter volume and gray matter concentration (GMC) of structures outside of the epileptic focus have revealed gray-matter alterations in structures beyond the hippocampus (Bernasconi et al., 2003; Bonilha et al., 2004, 2010; Jutila et al., 2001; Keller et al., 2002). It is still not clear if recurrent seizure activity is the cause of the observed gray matter structural changes. A number of studies have shown a reduction of gray matter in the hippocampus as well as in structures outside of the temporal lobe that increase with time (Bernasconi et al., 2005; Bonilha et al., 2006; Kalviainen et al., 2002), implying that repeated seizure activity over time is associated with gray matter atrophy.
In addition to the observed structural changes in patients with TLE, several recent studies have explored alterations in functional connectivity. A resting-state functional connectivity map represents a network of brain regions with synchronous fluctuations of blood oxygenation level-dependent (BOLD) magnetic resonance imaging (MRI) signals during the resting state (Biswal et al., 1995; Fox and Raichle, 2007; Lowe et al., 1998). Functional connectivity in both healthy (Damoiseaux et al., 2006; Newton et al., 2007) and diseased populations (Greicius et al., 2004; Zhou et al., 2008) has been previously explored. In patients with left TLE (LTLE), increased negative correlations of BOLD signal were observed in regions implicated in seizure propagation networks (Morgan et al., 2010). Bettus et al. (2009) found decreased basal functional connectivity in the left hemisphere in patients with LTLE, and in addition, they also observed increased basal functional connectivity within the right hemisphere in the same patient group. Cognitive impairments in patients with TLE have also been correlated with changes in functional connectivity (Vlooswijk et al., 2010; Waites et al., 2006; Zhang et al., 2009). Liao et al. (2010) found both increases and decreases in resting-state functional connectivity in patients with TLE; two regions with significant decreases in connectivity displayed a negative correlation with the duration of epilepsy. Similar to observed changes in gray matter, alterations in connectivity appear in structures thought to be involved in seizure networks, suggesting a relationship between repeated seizure activity and functional connectivity.
Many studies have explored the effect of TLE on the gray matter structure and volume or on resting-state functional connectivity in the brain. However, the relationship between structural and functional changes has not been fully explored. Combining different imaging methods has the potential to improve the diagnostic accuracy of each technique (Damoiseaux and Greicius, 2009), as well as lead to insights that may not be found through the lens of a single imaging modality. The goal of this study was to investigate the relationship between gray matter variations and functional connectivity at the voxel level. Specifically, in patients with LTLE, we performed a voxel-wise multiple regression analysis between GMC maps and whole-brain resting functional connectivity maps to both the thalamus and the hippocampus. Whole-brain connectivity to the left hippocampus (LH) was chosen, as this structure is highly implicated in the origination of seizure activity in patients with LTLE. Whole-brain connectivity to the left thalamus (Lthal) was also considered, as it is highly implicated as a component of the epileptogenic network; studies across several imaging modalities have observed abnormal activity in the thalamus during seizures and loss of consciousness in patients with TLE (Arthuis et al., 2009; Blumenfeld et al., 2004; Henry et al., 1993; Morgan et al., 2010; Newberg et al., 2000; Yune et al., 1998). We hypothesized that within the LTLE patient group, decreases in GMC would be associated with changes in functional connectivity from both the hippocampus and the thalamus to affected regions in the epileptic network. We posited that within the regions demonstrating changes in GMC and resting-state functional connectivity, we would observe one or more functional networks unique to the patient population.
Materials and Methods
Subjects
As a part of a larger study, 60 patients were recruited from the Vanderbilt University Epilepsy Program for functional and structural MRI. We selected 15 (mean age±standard deviation=35±10 years, 10 women, 1 left-handed) of these patients for this study. The main inclusion criterion for the study was unilateral TLE by ictal and interictal electroencephalography (EEG). Video-EEG monitoring with scalp EEG in the Epilepsy Monitoring Unit classified these patients with pure LTLE (only left-temporal interictal discharges and ictal EEG onsets; see Table 1 for individual patient characteristics). Fifteen normal healthy controls (31±11 years, three women) participated in this study, and all control subjects were right-handed by self-report. None of the controls had a history of neurological, psychiatric, or medical conditions as determined by interview. All subjects gave written informed consent.
Table 1.
Clinical and Demographic Data for 15 Patients with Left Temporal Lobe Epilepsy
| Patient No. | Gender | Age (years) | Age of seizure onset (years) | Handedness | MRI-temporal lobe |
|---|---|---|---|---|---|
| 1 | M | 45 | 39 | R | |
| 2 | M | 44 | 1 | R | |
| 3 | M | 41 | 17 | R | MTS |
| 4 | F | 46 | 5 | R | MTS |
| 5 | F | 19 | 1 | R | |
| 6 | F | 32 | 31 | R | |
| 7 | F | 31 | 26 | R | |
| 8 | M | 22 | 5 | R | |
| 9 | F | 49 | 27 | R | MTS |
| 10 | F | 39 | 23 | R | MTS |
| 11 | F | 47 | 1 | L | |
| 12 | M | 37 | 29 | R | MTS |
| 13 | F | 22 | 1 | R | MTS |
| 14 | F | 24 | 19 | R | |
| 15 | F | 34 | 32 | R | MTS |
M, male; F, female; R, right; L, left; MRI, magnetic resonance imaging; MTS, mesial temporal sclerosis identified by MRI.
Imaging
All study participants underwent an MRI scan on a 3T Philips Achieva MRI scanner (Philips Healthcare, Inc., Best, Netherlands). Subjects were asked to rest with their eyes closed and lie still. Foam padding was used to prevent head motion. Three-dimensional anatomic T1-weighed images of the brain with 1-mm3 isotropic voxels were acquired using a fast gradient-echo sequence (TR=8.9 msec, TE=4.7 msec, matrix=256×256, FOV=256×256 mm, flip angle=8°, slice thickness=1 mm, 150 or 170 slices). Two-dimensional T1-weighed structural images in the same orientation as the functional images were also acquired for coregistration. Functional images of the whole brain were acquired using a gradient-echo–echo planar imaging sequence (TR=2000 msec, TE=35 msec, matrix=64×64, FOV=240×240 mm, flip angle=79°, slice thickness=4.5 mm/0.5 mm gap, 30 slices and 300 dynamics [200 dynamics for healthy controls]).
Functional image preprocessing
The images were preprocessed and analyzed using the statistical parametric mapping software package SPM8 (www.fil.ion.ucl.ac.uk/spm). The functional image sets were corrected for slice-timing effects, motion-corrected, and spatially normalized to the Montreal Neurological Institute (MNI) template using coregistration to the three-dimensional and two-dimensional T1-weighed structural images. This produced a functional image series of 46×55×46 voxels (4×4×4 mm). These images were spatially smoothed using an 8-mm FWHM kernel. The preprocessed data were low-pass filtered at 0.1 Hz (Cordes et al., 2001) for functional connectivity analysis.
Resting-state functional connectivity maps
We selected two regions of interest (ROIs) for the whole-brain resting-state functional connectivity analysis: the LH and the Lthal. We used the atlas in the WFUpickatlas toolbox (fmri.wfubmc.edu/software/PickAtlas) to define each ROI, shown in Figure 1. For each subject, we calculated the averaged functional time series across all voxels in the ROI as the seed time series for the connectivity analysis. Low-pass filtered functional images were used for each subject, and we conducted a general linear-model analysis using the seed time series as the regressor of interest, with the cerebrospinal fluid time series and the six motion time series calculated from SPM8 as nuisance variables. The results from the analysis are in the form of t-statistic maps (spmT), which represent the spatial distributions of the resting-state functional connectivity to the ROI for each subject.
FIG. 1.
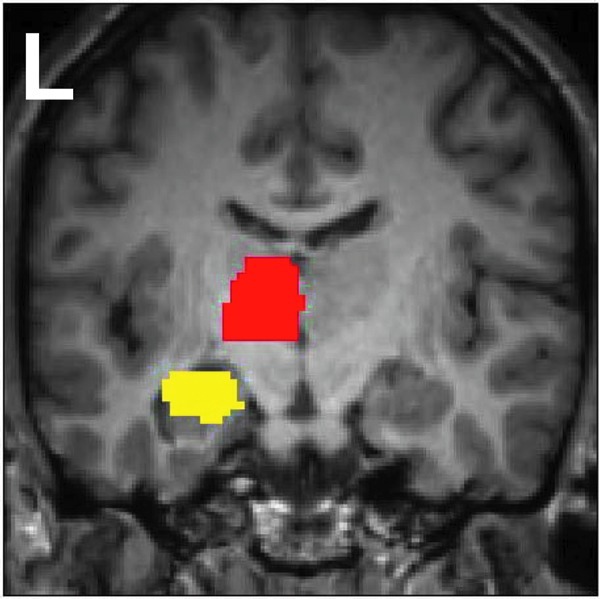
Seed regions used in resting-state functional connectivity analysis. The left hippocampus (LH) seed region is shown in yellow, and the left thalamus (Lthal) seed region in red.
Voxel-based morphometry
Voxel-based morphometry (VBM) was performed using SPM2, and a standard optimized VBM protocol was followed (Ashburner and Friston, 2000). All three-dimensional T1-weighed structural images were reoriented to match the functional images for subsequent analyses, and then the center point was manually positioned on the anterior commissure. A customized T1-weighed anatomical template was created from the average of the reoriented structural T1-weighed MR images of patients and controls that were affine transformed into the MNI space. Each subject's T1-weighed image was normalized to the customized template, and then segmented into a gray-matter image. The SPM segmentation algorithm incorporates an image intensity nonuniformity correction to address intensity variations across the image. A customized gray matter template was created from the normalized segmented images. Then, each subject's T1-weighed image in the native space was segmented into a gray matter image. Normalization parameters were determined using the gray matter template, and these parameters were then applied to each T1-weighed image in the native space. Each normalized T1-weighed image was then segmented into a gray matter image and smoothed with a 12-mm FWHM isotropic Gaussian kernel. Smoothing with a Gaussian kernel is performed to generate images with a Gaussian-like distribution for later voxel-based analyses, as well as to compensate for the approximations inherent in spatial normalization (Ashburner and Friston, 2000). The resultant smoothed image is the GMC map.
Statistical analysis
Statistical analysis of the group differences between patients with LTLE and controls was performed with SPM8 using two-sample t-tests comparing the connectivity maps to each ROI of patients with LTLE to healthy control participants. We also conducted two-sample t-tests comparing the GMC of patients with LTLE to healthy control participants; age was included as a covariate. The analysis included grand mean scaling and proportional threshold masking of 0.8. Proportional threshold masking was included to exclude nongray matter voxels; images were thresholded at the default value of 0.8, and only voxels at which all images exceeded the threshold were included. Our statistical threshold was p<0.05 (family-wise error [FWE]-corrected) with an extent threshold cluster size of 50 continuous voxels.
Biological parametric mapping and robust BPM
Biological parametric mapping (BPM) is a software package for multimodal image analysis based on a voxel-wise use of the general linear model (Casanova et al., 2007). The software package robust BPM (rBPM) is an extension of the BPM software tolerant to outliers (Yang et al., 2011) and was used to provide confirmation of the BPM results.
Linear regression analysis was performed in BPM using GMC maps as the dependent modality and the resting-state functional connectivity maps as the independent imaging covariate. Age was included as a nonimaging covariate. The analysis included the inclusion of a gray matter mask. The BPM results were thresholded at p<0.005 (uncorrected) with an extent cluster size of 10 continuous voxels. Regions of GMC both positively and negatively correlated with the resting functional connectivity to the ROI (LH or Lthal) were determined.
The same regression model was repeated in rBPM to account for the possibility of outliers in the data. Standard regression analysis assumes a normal distribution of random variations; because of this assumption, outlier data can have a large impact on the final results. Robust regression methods are designed to account for outliers by weighting the squared error of each data point. If there are no outliers, the results from robust regression are the same or close to the standard regression method. To consider potential outliers in our data, we selected the commonly used Huber weight function (Huber, 1981) for our robust analysis. The same parameters and thresholds were used as in the BPM analysis.
We hypothesized that regions where GMC and functional connectivity are linearly correlated may indicate regions of impairment in LTLE and denote unique structural and functional networks in these patients. To determine whether the relationship between functional connectivity and GMC found using BPM in patients with LTLE also existed in the healthy controls in the same regions, we performed linear correlation between GMC and functional connectivity in the resultant clusters found using BPM using IBM SPSS 20 (IBM Corp., Armonk, NY), including age as a covariate. Disease parameters, including age of onset and duration of disease, were correlated with GMC and functional connectivity in each of the regions found using the BPM to identify any linear relationships between the imaging measures and these disease characteristics in these regions. Significant correlations between these parameters may provide evidence of a more direct link between disease and the imaging parameters. Finally, we then investigated whether any of the regions detected by BPM overlapped or were directly adjacent to regions of reduced GMC in LTLE detected by VBM analysis or reduced or increased functional connectivity in LTLE.
Results
Functional connectivity group differences
We found no significant statistical difference in the resting-state functional connectivity to either ROI between patients and controls at the statistical threshold of p<0.05 (FWE-corrected) with an extent threshold cluster size of 50 continuous voxels. We chose this threshold to match that of the GMC t-test comparison.
We did find three regions with higher connectivity from the LH in the controls than the patients at p<0.001 uncorrected with extent cluster size of 10 voxels, including the left superior medial gyrus, left midcingulate gyrus, and the right posterior cingulate cortex. At the same threshold, patients had greater connectivity to the LH in the left inferior parietal lobule and the left middle temporal gyrus. From the Lthal, the connectivity in the controls was greater than the patients in the left inferior frontal gyrus at the same threshold. No regions had greater connectivity to the Lthal in the patients than the controls at this reduced threshold.
VBM group differences
The regions of GMC reduction in patients are listed in Table 2 and shown in Figure 2. The t-test revealed no regions at the p<0.05 FWE cluster size 50-voxel threshold where patients had increased GMC compared to control subjects.
Table 2.
Voxel-Based Morphometry Group Differences Summary: Gray Matter Concentration Reduction in Patients with Left Temporal Lobe Epilepsy
| Cluster | Cluster size (voxels) | MNI coordinates (mm) |
|---|---|---|
| Right thalamus | 3078 | (14,−20,8) |
| Left thalamus | 2582 | (−15,−21,2) |
| Right postcentral gyrus | 437 | (23,−30,60) |
| Right midcingulate gyrus | 242 | (6,−14,42) |
| Left precuneus | 65 | (−7,−55,37) |
| Left postcentral gyrus | 96 | (−24,−36,59) |
| Right precentral gyrus | 56 | (64,10,18) |
Two-sample t-test p-value: p<0.05 (family-wise error-corrected) and extent cluster threshold >50 voxels. Age is included as covariate.
MNI, Montreal Neurological Institute.
FIG. 2.

Regions of gray matter concentration (GMC) increase in controls over patients with left temporal lobe epilepsy (LTLE) (p<0.05 family-wise error [FWE] cluster size 50). Analysis performed using a two-sample t-test with age as a covariate. Regions are listed in Table 2 and are indicated by arrows: (1) left postcentral gyrus, (2) right postcentral gyrus, (3) right midcingulate gyrus, (4) left precuneus, (5) right superior temporal gyrus, (6) Lthal, and (7) right thalamus.
BPM results
In patients with LTLE, we found clusters in the superior temporal gyrus, putamen, precuneus, and cingulate gyrus that demonstrated a positive correlation between GMC and functional connectivity to the LH. Clusters in the cerebellum (anterior and posterior), thalamus, precuneus, precentral gyrus, and temporal lobe displayed a negative correlation between GMC and functional connectivity to the LH. The results are summarized in Table 3. Plots of the functional connectivity (quantified by the mean spmT value computed by SPM8 in the cluster) versus the GMC in both patients and controls in some regions are shown in Figure 3.
Table 3.
Biological Parametric Mapping Results Summary—Gray Matter Concentration Versus Connectivity to the Left Hippocampus
| Cluster | Cluster size (voxels) | Correlation | ρ |
|---|---|---|---|
| Left superior temporal gyrus (BA 22) | 24 | Positive | 0.94 |
| Right precuneus | 12 | Positive | 0.675 |
| Right midcingulate gyrus (BA 24) | 39 | Positive | 0.77 |
| Left putamen | 13 | Positive | 0.88 |
| Right anterior cerebellum/brainstem | 99 | Negative | −0.92 |
| Right temporal lobe (sub-gyral) | 22 | Negative | −0.78 |
| Right posterior cerebellum* | 10 | Negative | −0.78 |
| Right thalamus | 24 | Negative | −0.88 |
| Left precuneus | 15 | Negative | −0.91 |
| Left precentral gyrus | 17 | Negative | −0.88 |
denotes that cluster did not appear in rBPM results at p<0.005 threshold, but appeared at p<0.01.
ρ is the partial correlation between gray matter concentration and connectivity with age as a confound. BPM p-value: p<0.005 (uncorrected) and extent cluster threshold 10 voxels. Highlighted regions overlap with regions found from two-sample t-test results in Table 2.
BA, Brodmann area; BPM, biological parametric mapping; rBPM, robust BPM.
FIG. 3.

Plots of GMC versus connectivity to the Lthal or to LH in regions found from biological parametric mapping (BPM) analyses. Patients with LTLE are shown as circles, and control subjects as crosses. Linear regression was used to fit a line to the LTLE patient data and to the controls data for each plot. GMC and connectivity values (as a t-statistic) have arbitrary units.
Similarly, we found regions in the medial frontal gyrus, postcentral gyrus, precuneus, and midcingulate gyrus showing a positive correlation between GMC and connectivity to the Lthal. We found that regions in the insula, superior temporal gyrus, medial frontal gyrus, supramarginal gyrus, and the inferior frontal gyrus demonstrated a negative correlation between GMC and functional connectivity to the Lthal. The results are shown in Table 4. Plots of the functional connectivity versus the GMC in some regions in both patients and controls are shown in Figure 3.
Table 4.
Biological Parametric Mapping Results Summary—Gray Matter Concentration Versus Connectivity to the Left Thalamus
| Cluster | Cluster size (voxels) | Correlation | ρ |
|---|---|---|---|
| Left medial frontal gyrus* | 11 | Positive | 0.83 |
| Left postcentral gyrus** | 37 | Positive | 0.92 |
| Left precuneus | 14 | Positive | 0.81 |
| Right postcentral gyrus (BA 4) | 11 | Positive | 0.85 |
| Right midcingulate gyrus** | 11 | Positive | 0.80 |
| Right insula | 15 | Negative | −0.79 |
| Left superior temporal gyrus | 25 | Negative | −0.74 |
| Right medial frontal gyrus | 28 | Negative | −0.92 |
| Left supramarginal gyrus* | 10 | Negative | −0.83 |
| Right inferior frontal gyrus | 12 | Negative | −0.79 |
ρ is the partial correlation between gray matter concentration and connectivity with age as a confound. BPM p-value: p<0.005 (uncorrected) and extent cluster threshold 10 voxels. Highlighted regions overlap (or adjacent—denoted by **) with regions found from two-sample t-test results in Table 2. * denotes that cluster did not appear in rBPM results at p<0.005 threshold, but appeared at p<0.01.
At the same threshold, the rBPM analyses reported all regions listed previously with the following exceptions: the medial frontal gyrus cluster, the supramarginal gyrus cluster, and the posterior cerebellum cluster. These regions appeared when a more liberal statistical threshold was used (p<0.01 instead of p<0.005), and are noted in both Tables 3 and 4. The overlap between the BPM and rBPM analyses provides additional confidence in our data, as well as in the BPM results.
In the 20 regions listed in Tables 3 and 4, we performed linear correlation between GMC and functional connectivity across the control subjects with age as a covariate. No regions had statistically significant linear correlation between the two measures.
Four of the seven regions with significantly reduced GMC in patients (Table 2) overlapped with clusters of correlated GMC and functional connectivity from the BPM analysis (Tables 3 and 4). These regions are highlighted in Tables 3 and 4. The left postcentral gyrus included a region of reduced GMC adjacent to a region of positive correlation between GMC and connectivity to the Lthal using BPM (denoted by ** in Table 4). The two regions that showed significant decrease of GMC in patients compared to controls, but not correlation, to functional connectivity in the BPM analysis were the Lthal (used as a seed in one analysis) and the right precentral gyrus. One overlapping region in the right midcingulate gyrus was identified as having functional connectivity to the LH correlating to GMC, decrease in GMC in patients with LTLE compared to controls, and decreased functional connectivity in patients with LTLE compared to controls using the p<0.001 uncorrected cluster size 10 threshold. The same region was adjacent to a region of significant functional connectivity to the Lthal correlating to GMC. These overlapping/adjacent regions are shown in Figure 4.
FIG. 4.
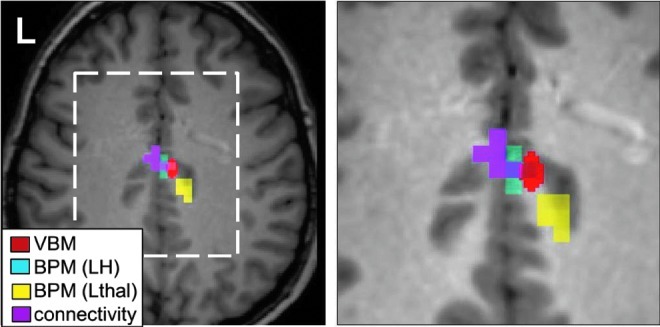
Comparison of voxel-based morphometry (VBM), BPM, and functional connectivity analyses. Red=VBM t-test shows controls GMC>LTLE GMC (p<0.05 FWE cluster size 50); cyan=BPM indicates GMC linearly correlated with functional connectivity to LH (p<0.005 uncorrected cluster size 10); yellow=BPM indicates GMC linearly correlated with functional connectivity to Lthal (p<0.005 uncorrected cluster size 10); magenta=functional connectivity in controls >LTLE (p<0.001 uncorrected cluster size 10). Figure on right is expanded view of dashed white box on left.
Discussion
In this study, we compared changes in functional connectivity to the LH and Lthal to changes in GMC using a voxel-wise general linear model in LTLE. There was consistent agreement between regions identified as having reduced GMC in the patients and those where reduced GMC correlated with change in resting functional connectivity. One region in the midcingulate gyrus showed reduced functional connectivity to the LH, reduced GMC, and correlation between GMC and functional connectivity to the LH and Lthal (adjacent region) in the patients with LTLE. The convergence of these functional and structural changes suggests that the LH, Lthal, midcingulate gyrus, right thalamus, right and left postcentral gyrus, left precuneus, and the right precentral gyrus delineate a network of impairment in LTLE.
The comparison of functional connectivity to the LH between patients and controls did not detect any regions of significant change at the same threshold as the GMC analysis. However, at lower thresholds, we found decreased functional connectivity in patients in at least one region in the frontal superior medial gyrus near regions of decreased connectivity to a manually drawn seed region in the LH detected by Pittau et al. (2012). We also found decreased connectivity in LTLE in the right posterior cingulate similar to Periera et al. (2010). The reason for our decreased significance and reduced number of regions is unclear, but size and specificity of our seed region identification may be partly responsible. We used relatively large atlas-based regions that might include nongray matter inside and outside the hippocampus. To investigate if the seed region size was a dominant factor, we correlated the functional connectivity in the BPM-detected regions listed in Tables 3 and 4 with the GMC in the LH or Lthal seed region. This showed no correlation between the two in any region, except the left superior temporal gyrus (Table 4) (p=0.002, Spearman Test). This suggests that the problem is not solely due to an oversized region, but that specificity may still be an issue. Since the spatial resolution of functional connectivity is relatively low and the potential for partial volume effects is high, increased specificity in seed identification would be difficult to achieve in an objective, repeatable, and accurate way.
A comparison of GMC between the two populations revealed several regions in the brain in which patients exhibited a statistically significant reduction of GMC. The most significant structure displaying GMC reduction was the thalamus, with the peak coordinate in the medial dorsal thalamic nucleus. A 2000 study by Bertram and Scott (Bertram and Scott, 2000) found consistent neuronal loss in the medial dorsal thalamic region in a rat population with limbic epilepsy; interestingly, they did not find consistent neuronal loss in the hippocampus, amygdala, or entorhinal cortex. In addition, many of the other regions found are consistently reported in other studies, such as the cingulate gyrus (Keller et al., 2002; Keller and Roberts, 2008) and the sensorimotor cortex primarily in the postcentral gyrus (Labate et al., 2011). The result of this comparison is consistent with other studies, and points to typical gray matter atrophy within our patient population.
The second part of our study used the BPM software package to implement a voxel-wise linear regression analysis. We looked at the relationship between GMC and the resting-state functional connectivity to the LH as well as to the Lthal in patients with LTLE. Both analyses resulted in clusters displaying a significant linear correlation between GMC and connectivity (Tables 3 and 4). None of these regions also exhibited a linear correlation between GMC and the resting-state functional connectivity in the control subjects.
As GMC reduction in TLE has been consistently found across many studies, it can be considered an indicator of disease. Many of the regions from the BPM analysis overlapped with the GMC group comparison in which patients had reduced GMC (overlapping regions highlighted in Tables 3 and 4) in comparison to controls. We focused on these regions, including the right thalamus, right and left postcentral gyrus, left precuneus, and right midcingulate gyrus, as well as the LH and Lthal as potential nodes in a network unique to the patients with LTLE. The relationship between GMC and resting functional connectivity in each of these regions is shown in Figure 3. Note that regions in the right midcingulate gyrus had GMC values that were found to be correlated with connectivity to both the LH and Lthal, and so are shown in two plots.
We can make several observations about these plots in Figure 3. First, except for right thalamus and left precuneus, the decrease in GMC in patients with LTLE compared to controls is clear. These two regions had little overlap between the VBM- and the BPM-detected region, which supports this discrepancy. Second, the similarity between the functional connectivity between the two groups in each region is also clear except in the LH to right midcingulate connection, supporting why the t-test for functional connectivity between LTLE and controls only found reduced functional connectivity in this region (at a reduced threshold) and not the others. Third, the right midcingulate gyrus (both LH and Lthal connection), the left precuneus, and the left postcentral gyrus indicate a pattern that is consistent with the idea that in LTLE, functional connectivity changes (decreases) only with greater reductions in GMC in these regions. We could speculate that in the right postcentral gyrus, the decrease in functional connectivity is yet to occur in this population, and that the connectivity from the LH to the right thalamus increases as the GMC decreases. Finally, however, we did not detect linear correlations between the GMC or functional connectivity and age of onset or duration of disease in these regions, so the direct relationship between the disease progression (as indicated by these two measures) and the imaging measures has yet to be established. Similarly, the individual patients with LTLE that appear to have significantly decreased functional connectivity in Figure 3 are not the same across regions, implying that no single patient has more severe changes than the others.
The regions shown in Figure 3 have been implicated in TLE seizure networks (Norden and Blumenfeld, 2002). There is a large body of evidence supporting the role of the thalamus in TLE, specifically in the secondary generalization of seizures (Blumenfeld et al., 2009; Englot et al., 2010; Norden and Blumenfeld, 2002; Yu and Blumenfeld, 2009). Synchronous electrical activity in the thalamus and temporal lobes during temporal lobe seizures were found using intracerebral electrical recordings (Arthuis et al., 2009; Guye et al., 2006). The degree of synchrony was related to the loss of consciousness and inversely related to better surgical outcome (Guye et al., 2006). We also reported in a recent study that the connectivity between the LH and the right thalamus was increased in patients with LTLE over patients with right TLE (Morgan et al., 2012).
Using ictal and interictal single-photon-emission computed tomography, Blumenfeld et al. (2009) successfully mapped the temporal evolution of generalized tonic–clonic seizure-related perfusion changes. While the thalamus plays a key role as described above during generalization of the seizure, post-ictally, the bilateral frontal regions near the postcentral gyrus, the precuneus, and the midcingulate region all showed significant hypoperfusion. One region that had hypoperfusion in both the pregeneralization and post-ictal phase was the midcingulate region similar to those shown in Figure 4, where several of our methods converged. In this region, three of our results overlap, while the region of linear correlation between GMC and functional connectivity to the Lthal is adjacent to them. This convergence suggests that these processes may reflect the same unique network in these patients, but that these changes in GMC and functional connectivity are not completely dependent on each other, and that other separate factors are involved in these alterations. The difference in these regions is also due in part to the statistical threshold chosen and the tissue generating the signal, such as the potential inclusion of draining veins in the functional connectivity signal.
Methodological considerations
Our population of patients included 10 women, whereas the controls only included three. While studies of gender differences in functional connectivity are rare, those in GMC have been reported (Takahashi et al., 2011). In that study, women had increased GMC over men in several regions, including the thalamus. We detected increased GMC in controls (with fewer women) in this region, contradicting the trend if gender was a significant factor. Unfortunately, we cannot assess gender directly in our study due to the low number of total subjects.
It is possible that the resting-state functional connectivity maps and the GMC maps used for the analyses are correlated with a third variable. We examined correlations in the clusters from the BPM analyses related to age of onset and duration of disease and found none in our data. Approximately half of the patients in the study had mesial temporal sclerosis (MTS), so we also examined the regions in Tables 3 and 4 for divisions based on patients with and without MTS. We found no clear demarcation between the two groups within the results. In VBM, we smoothed the GMC maps with an isotropic Gaussian kernel of 12 mm. As mentioned previously, smoothing the segmented gray matter images is a necessary step for a number of reasons, including the creation of more normally distributed GMC maps. However, the large smoothing kernel may also diminish the precision of localization within the brain.
In this work, we restrict our between-group comparisons to t-tests that assume a normal distribution. It is possible that our data may not fit this assumption well in all cases; however, our results in Figure 3 appear to have reduced GMC in the regions that were detected as having reduced GMC by t-test. We also note that we used different statistical thresholds for the t-tests and BPM analyses. These were chosen to illustrate the most focal and significant regions from each type of analysis. All thresholds are clearly stated, and Figure 3 illustrates the actual data in some regions. Finally, our analyses do not investigate the presence of nonlinear relationships between any of the measures discussed, while it is very possible that other relationships do exist, which is beyond the scope of this initial study, and will be the focus of future work.
Conclusion
In summary, we performed a voxel-wise linear regression analysis between GMC and resting-state functional connectivity across a group of 15 patients with LTLE. We found numerous regions exhibiting GMC decreases correlated with resting-state functional connectivity to either the LH or the Lthal. A subset of these regions had significantly reduced GMC when compared to the controls, and one of these regions also had reduced functional connectivity to the LH compared to the controls. These results suggest a network of impairment in LTLE where more severe reductions in GMC accompany decreases (LH, Lthal, right midcingulate gyrus, left precuneus, and left postcentral gyrus) or increases (LH to right thalamus) in resting functional connectivity. However, direct relationships between these imaging parameters and disease characteristics in these regions have yet to be established.
Acknowledgments
This work supported by NIH grants T32 EB001628, R01 NS075270, R01 NS055822, and UL1 RR024975-01.
Author Disclosure Statement
We confirm that we have read the Journal's position on issues involved in ethics publication and affirm that this report is consistent with those guidelines. No competing financial interests exist.
References
- Arthuis M. Valton L. Regis J. Chauvel P. Wendling F. Naccache L, et al. Impaired consciousness during temporal lobe seizures is related to increased long-distance cortical-subcortical synchronization. Brain. 2009;132:2091–2101. doi: 10.1093/brain/awp086. [DOI] [PubMed] [Google Scholar]
- Ashburner J. Friston KJ. Voxel-based morphometry, the methods. NeuroImage. 2000;11:805–821. doi: 10.1006/nimg.2000.0582. [DOI] [PubMed] [Google Scholar]
- Bernasconi N. Bernasconi A. Caramanos Z. Antel SB. Andermann F. Arnold DL. Mesial temporal damage in temporal lobe epilepsy: a volumetric MRI study of the hippocampus, amygdala and parahippocampal region. Brain. 2003;126:462–469. doi: 10.1093/brain/awg034. [DOI] [PubMed] [Google Scholar]
- Bernasconi N. Natsume J. Bernasconi A. Progression in temporal lobe epilepsy. Neurology. 2005;65:223–228. doi: 10.1212/01.wnl.0000169066.46912.fa. [DOI] [PubMed] [Google Scholar]
- Bertram EH. Scott C. The pathological substrate of limbic epilepsy: neuronal loss in the medial dorsal thalamic nucleus as the consistent change. Epilepsia. 2000;41:S3–S8. doi: 10.1111/j.1528-1157.2000.tb01548.x. [DOI] [PubMed] [Google Scholar]
- Bettus G. Guedj E. Joyeux F. Confort-Gouny S. Soulier E. Laguitton V, et al. Decreased basal fMRI functional connectivity in epileptogenic networks and contralateral compensatory mechanisms. Hum Brain Mapp. 2009;30:1580–1591. doi: 10.1002/hbm.20625. [DOI] [PMC free article] [PubMed] [Google Scholar]
- Biswal B. Yetkin F. Haughton V. Hyde J. Functional connectivity in the motor cortex of resting human brain using echo-planar MRI. Magn Reson Med. 1995;34:537–541. doi: 10.1002/mrm.1910340409. [DOI] [PubMed] [Google Scholar]
- Blumenfeld H. McNally K. Vanderhill S. Paige A. Chung R. Davis K, et al. Positive and negative network correlations in temporal lobe epilepsy. Cereb Cortex. 2004;14:892–902. doi: 10.1093/cercor/bhh048. [DOI] [PubMed] [Google Scholar]
- Blumenfeld H. Varghese GI. Purcaro MJ. Motelow JE. Enev M. McNally KA, et al. Cortical and subcortical networks in human secondarily generalized tonic-clonic seizures. Brain. 2009;132:999–1012. doi: 10.1093/brain/awp028. [DOI] [PMC free article] [PubMed] [Google Scholar]
- Bonilha L. Elm JJ. Edwards JC. Morgan PS. Hicks C. Lozar C, et al. How common is brain atrophy in patients with medial temporal lobe epilepsy? Epilepsia. 2010;51:1528–1167. doi: 10.1111/j.1528-1167.2010.02576.x. (Electronic). [DOI] [PubMed] [Google Scholar]
- Bonilha L. Rorden C. Appenzeller S. Carolina Coan A. Cendes F. Min Li L. Gray matter atrophy associated with duration of temporal lobe epilepsy. NeuroImage. 2006;32:1070–1079. doi: 10.1016/j.neuroimage.2006.05.038. [DOI] [PubMed] [Google Scholar]
- Bonilha L. Rorden C. Castellano G. Pereira F. Rio PA. Cendes F, et al. Voxel-based morphometry reveals gray matter network atrophy in refractory medial temporal lobe epilepsy. Arch Neurol. 2004;6:1379–1384. doi: 10.1001/archneur.61.9.1379. [DOI] [PubMed] [Google Scholar]
- Casanova R. Srikanth R. Baer A. Laurienti PJ. Burdette JH. Hayasaka S, et al. Biological parametric mapping: a statistical toolbox for multimodality brain image analysis. NeuroImage. 2007;34:137–143. doi: 10.1016/j.neuroimage.2006.09.011. [DOI] [PMC free article] [PubMed] [Google Scholar]
- Cordes D. Haughton VM. Arfanakis K. Carew JD. Turski PA. Moritz CH, et al. Frequencies contributing to functional connectivity in the cerebral cortex in “resting-state” data. Am J Neuroradiol. 2001;22:1326–1333. [PMC free article] [PubMed] [Google Scholar]
- Damoiseaux J. Greicius M. Greater than the sum of its parts: a review of studies combining structural. Brain Struct Funct. 2009;213:525–533. doi: 10.1007/s00429-009-0208-6. [DOI] [PubMed] [Google Scholar]
- Damoiseaux JS. Rombouts SARB. Barkhof F. Scheltens P. Stam CJ. Smith SM, et al. Consistent resting-state networks across healthy subjects. Proc Natl Acad Sci U S A. 2006;103:13848–13853. doi: 10.1073/pnas.0601417103. [DOI] [PMC free article] [PubMed] [Google Scholar]
- Englot DJ. Yang L. Hamid H. Danielson N. Bai XX. Marfeo A, et al. Impaired consciousness in temporal lobe seizures: role of cortical slow activity. Brain. 2010;133:3764–3777. doi: 10.1093/brain/awq316. [DOI] [PMC free article] [PubMed] [Google Scholar]
- Fox MD. Raichle ME. Spontaneous fluctuations in brain activity observed with functional magnetic resonance imaging. Nat Rev Neurosci. 2007;8:700–711. doi: 10.1038/nrn2201. [DOI] [PubMed] [Google Scholar]
- Greicius MD. Srivastava G. Reiss AL. Menon V. Default-mode network activity distinguishes Alzheimer's disease from healthy aging: evidence from functional MRI. Proc Natl Acad Sci U S A. 2004;101:4637–4642. doi: 10.1073/pnas.0308627101. [DOI] [PMC free article] [PubMed] [Google Scholar]
- Guye M. Regis J. Tamura M. Wendling F. McGonigal A. Chauvel P, et al. The role of corticothalamic coupling in human temporal lobe epilepsy. Brain. 2006;129:1917–1928. doi: 10.1093/brain/awl151. [DOI] [PubMed] [Google Scholar]
- Henry TR. Mazziotta JC. Engel J., Jr Interictal metabolic anatomy of mesial temporal lobe epilepsy. Arch Neurol. 1993;50:582–589. doi: 10.1001/archneur.1993.00540060022011. [DOI] [PubMed] [Google Scholar]
- Huber PJ. Robust Statistics. New York, NY: Wiley; 1981. [Google Scholar]
- Jutila L. Ylinen A. Partanen K. Alafuzoff I. Mervaala E. Partanen J, et al. MR volumetry of the entorhinal, perirhinal, and temporopolar cortices in drug-refractory temporal lobe epilepsy. Am J Neuroradiol. 2001;22:1490–1501. [PMC free article] [PubMed] [Google Scholar]
- Kalviainen R. Salmenpera T. Do recurrent seizures cause neuronal damage? A series of studies with MRI volumetry in adults with partial epilepsy. In: Sutula T, editor; Pitkanen A, editor. Progress in Brain Research. Amsterdam, The Netherlands: Elsevier; 2002. pp. 279–295. [DOI] [PubMed] [Google Scholar]
- Keller SS. Mackay CE. Barrick TR. Wieshmann UC. Howard MA. Roberts N. Voxel-based morphometric comparison of hippocampal and extrahippocampal abnormalities in patients with left and right hippocampal atrophy. Neuroimage. 2002;16:23–31. doi: 10.1006/nimg.2001.1072. [DOI] [PubMed] [Google Scholar]
- Keller SS. Roberts N. Voxel-based morphometry of temporal lobe epilepsy: an introduction and review of the literature. Epilepsia. 2008;49:741–757. doi: 10.1111/j.1528-1167.2007.01485.x. [DOI] [PubMed] [Google Scholar]
- Labate A. Cerasa A. Aguglia U. Mumoli L. Quattrone A. Gambardella A. Neocortical thinning in “benign” mesial temporal lobe epilepsy. Epilepsia. 2011;52:712–717. doi: 10.1111/j.1528-1167.2011.03038.x. [DOI] [PubMed] [Google Scholar]
- Liao W. Zhang Z. Pan Z. Mantini D. Ding J. Duan X, et al. Altered functional connectivity and small-world in mesial temporal lobe epilepsy. PloS One. 2010;5:e8525. doi: 10.1371/journal.pone.0008525. Article No. [DOI] [PMC free article] [PubMed] [Google Scholar]
- Lowe MJ. Mock BJ. Sorenson JA. Functional connectivity in single and multislice echoplanar imaging using resting-state fluctuations. Neuroimage. 1998;7:119–132. doi: 10.1006/nimg.1997.0315. [DOI] [PubMed] [Google Scholar]
- Margerison J. Corsellis J. Epilepsy and the temporal lobes. A clinical, electroencephalographic and neuropathological study of the brain in epilepsy, with particular reference to the temporal lobes. Brain. 1966;89:499–530. doi: 10.1093/brain/89.3.499. [DOI] [PubMed] [Google Scholar]
- Morgan V. Gore JC. Abou-Khalil B. Functional epileptic network in left mesial temporal lobe epilepsy detected using resting fMRI. Epilepsy Res. 2010;88:168–178. doi: 10.1016/j.eplepsyres.2009.10.018. [DOI] [PMC free article] [PubMed] [Google Scholar]
- Morgan VL. Sonmezturk HH. Gore JC. Abou-Khalil B. Lateralization of temporal lobe epilepsy using resting functional magnetic resonance imaging connectivity of hippocampal networks. Epilepsia. 2012;53:1628–1635. doi: 10.1111/j.1528-1167.2012.03590.x. [DOI] [PMC free article] [PubMed] [Google Scholar]
- Newberg A. Alavi A. Berlin J. Mozley P. O'Connor M. Sperling M. Ipsilateral and contralateral thalamic hypometabolism as a predictor of outcome after temporal lobectomy for seizures. J Nucl Med. 2000;41:1964–1968. [PubMed] [Google Scholar]
- Newton AT. Morgan VL. Gore JC. Task demand modulation of steady-state functional connectivity to primary motor cortex. Hum Brain Mapp. 2007;28:663–672. doi: 10.1002/hbm.20294. [DOI] [PMC free article] [PubMed] [Google Scholar]
- Norden AD. Blumenfeld H. The role of subcortical structures in human epilepsy. Epilepsy Behav. 2002;3:219–231. doi: 10.1016/s1525-5050(02)00029-x. [DOI] [PubMed] [Google Scholar]
- Pereira FRS. Alessio A. Sercheli MS. Pedro T. Bilevicius E. Rondina JM, et al. Asymmetrical hippocampal connectivity in mesial temporal lobe epilepsy: evidence from resting state fMRI. BMC Neurosci. 2010;11:66. doi: 10.1186/1471-2202-11-66. [DOI] [PMC free article] [PubMed] [Google Scholar]
- Pittau F. Grova C. Moeller F. Dubeau F. Gotman J. Patterns of altered functional connectivity in mesial temporal lobe epilepsy. Epilepsia. 2012;53:1013–1023. doi: 10.1111/j.1528-1167.2012.03464.x. [DOI] [PMC free article] [PubMed] [Google Scholar]
- Spencer SS. Neural networks in human epilepsy: evidence of and implications for treatment. Epilepsia. 2002;43:219–227. doi: 10.1046/j.1528-1157.2002.26901.x. [DOI] [PubMed] [Google Scholar]
- Takahashi R. Ishii K. Kakigi T. Yokoyama K. Gender and age differences in normal adult human brain: voxel-based morphometric study. Human Brain Mapp. 2011;32:1050–1058. doi: 10.1002/hbm.21088. [DOI] [PMC free article] [PubMed] [Google Scholar]
- Vlooswijk MCG. Jansen JFA. Majoie HJM. Hofman PAM. de Krom MCTFM. Aldenkamp AP, et al. Functional connectivity and language impairment in cryptogenic localization-related epilepsy. Neurology. 2010;75:395–402. doi: 10.1212/WNL.0b013e3181ebdd3e. [DOI] [PubMed] [Google Scholar]
- Waites AB. Briellmann RS. Saling MM. Abbott DF. Jackson GD. Functional connectivity networks are disrupted in left temporal lobe epilepsy. Ann Neurol. 2006;59:335–343. doi: 10.1002/ana.20733. [DOI] [PubMed] [Google Scholar]
- Yang X. Beason-Held L. Resnick SM. Landman BA. Biological parametric mapping with robust and non-parametric statistics. Neuroimage. 2011;57:423–430. doi: 10.1016/j.neuroimage.2011.04.046. [DOI] [PMC free article] [PubMed] [Google Scholar]
- Yu L. Blumenfeld H. Theories of impaired consciousness in epilepsy. Disord Conscious. 2009;1157:48–60. doi: 10.1111/j.1749-6632.2009.04472.x. [DOI] [PMC free article] [PubMed] [Google Scholar]
- Yune M. Lee J. Ryu Y. Kim D. Lee B. Kim S. Ipsilateral thalamic hypoperfusion on interictal SPECT in temporal lobe epilepsy. J Nucl Med. 1998;39:281–285. [PubMed] [Google Scholar]
- Zhang Z. Lu G. Zhong Y. Tan Q. Yang Z. Liao W, et al. Impaired attention network in temporal lobe epilepsy: a resting FMRI study. Neurosci Lett. 2009;458:97–101. doi: 10.1016/j.neulet.2009.04.040. [DOI] [PubMed] [Google Scholar]
- Zhou Y. Shu N. Liu Y. Song M. Hao Y. Liu H, et al. Altered resting-state functional connectivity and anatomical connectivity of hippocampus in schizophrenia. Schizophr Res. 2008;100:120–132. doi: 10.1016/j.schres.2007.11.039. [DOI] [PubMed] [Google Scholar]