

Abstract
Purpose.
We measured the bleaching and regeneration kinetics of rhodopsin in the living human eye with two-wavelength, wide-field scanning laser ophthalmoscopy (SLO), and investigated the effect of rhodopsin bleaching on autofluorescence intensity.
Methods.
The retina was imaged with an Optos P200C SLO by its reflectance of 532 and 633 nm light, and its autofluorescence excited by 532 nm light, before and after exposure to lights calibrated to bleach rhodopsin substantially. Bleaching was confined to circular retinal regions of 4.8° visual angle located approximately 16° superotemporal and superonasal to fixation. Images were captured as 12-bit tiff files and postprocessed to extract changes in reflectance and autofluorescence.
Results.
At the locus of bleaching transient increases in reflectance of the 532 nm, but not the 633 nm beam were observed readily and quantified. A transient increase in autofluorescence also occurred. The action spectrum, absolute sensitivity, and recovery of the 532 nm reflectance increase were consistent with previous measurements of human rhodopsin's spectral sensitivity, photosensitivity, and regeneration kinetics. The autofluorescence changes closely tracked the changes in rhodopsin density.
Conclusions.
The bleaching and regeneration kinetics of rhodopsin can be measured locally in the human retina with a widely available SLO. The increased autofluorescence excited by 532 nm light upon bleaching appears primarily due to transient elimination of rhodopsin's screening of autofluorescent fluorochromes in the RPE. The spatially localized measurement with a widely available SLO of rhodopsin, the most abundant protein in the retina, could be a valuable adjunct to retinal health assessment.
Rhodopsin was measured locally in the retina with a widely available, dual wavelength scanning laser ophthalmoscope that does not require pupil dilation. Increased autofluorescence attendant bleaching arises largely from transient removal of rhodopsin's screening of autofluorescent fluorochromes.
Introduction
Night vision is initiated by the capture of light by the visual pigment rhodopsin in rod photoreceptors.1 Rods are the most numerous cell type in the retina, and rhodopsin the most abundant retinal protein. Mutations in rod opsin, the apoprotein of rhodopsin, are a major cause of retinal degeneration, typically autosomal dominant retinitis pigmentosa.2–4 Because of the intrinsic importance of rhodopsin in retinal health and disease, it is useful to quantify its properties in the living eye.
Because photoreceptors are densely packed, and their visual pigments have high intrinsic absorbance and are highly concentrated (typically at approximately 3 mM) in outer segments, the properties of the pigments in the living eye can be measured with a method known as retinal reflection densitometry. The essence of this method is a comparison of light reflected from the fundus in two spectral regions–a mid-wavelength light absorbed substantially by the pigments and a long wavelength light to which the pigment is largely transparent–before and after exposure to lights that bleach the pigment.5–10
Retinal reflection densitometry has been implemented with several imaging technologies, including fundus photography and scanning laser ophthalmoscopy.11–15 In this investigation, using a wide-field scanning laser ophthalmoscope (SLO), the Optos P200 (Optos, Dunfermline, Scotland), we characterized light-induced increases in 532 nm reflectance in the near retinal periphery. Distinctive and advantageous features of this SLO are its widefield capability (152° horizontal visual angle and 114° vertical visual angle), obviation of pupil dilation, simultaneous imaging with green (532 nm) and red (633 nm) light, and brief image acquisition time (250 ms). Imaging the retina through a natural pupil, however, poses a challenge for quantification of fundus reflectance, as trial-to-trial variation in the pupil size causes proportional variation in the light captured by the imaging system. In this investigation we took up this challenge, devising a spatially ratiometric method that greatly reduced trial-to-trial variation in estimates of bleaching-induced changes in reflectance. We used this new ratiometric analysis to measure the action spectrum, absolute photosensitivity, and recovery kinetics of the changes in 532 nm reflectance consequent to bleaching exposures of a peripheral retinal region of 4.8° diameter.
The RPE is of much importance to the understanding of retinal degenerations and aging. Among its many roles, the RPE is the primary site of synthesis of the 11-cis retinal continually required for regeneration of bleached pigment.1,16,17 The RPE also is a repository of lipofuscin,18 an autofluorescent, deleterious byproduct of outer segment renewal.19,20 Lipofuscin autofluorescence thus provides a valuable assay of the RPE layer. Retinal autofluorescence imaging has been combined with flood-illuminated fundus cameras and SLO to assess the health of the RPE in vivo.21–25 Because altered autofluorescence is a characteristic of many retinal degenerations,22,23,26–28 there is much interest in its quantification. However, because light exciting RPE autofluorescence must first pass through the photoreceptor layer, absorption by visual pigment can be expected to affect the absolute level of autofluorescence. Here, we examined whether the autofluorescence evoked in the near periphery by 532 nm light is modulated substantially by bleach status–dependent rhodopsin screening.29,30
Methods
Human Subjects
All research presented in our study was approved by the institutional review boards for human studies at the University of Pennsylvania. All of the experiments followed the tenets of the Declaration of Helsinki, and were Health Insurance Portability and Accountability Act (HIPAA)–compliant. All imaging light exposures adhered to the maximum permissible exposure (MPE) limits set by the American National Standards Institute (ANSI) standard, and cumulative retinal light exposures were maintained well less than 0.5 J/cm2 per day as an additional safety precaution.31,32 Subjects' written informed consent was obtained after the nature of the study was explained. In total, 12 volunteers participated in this study: 3 male subjects aged 21 to 63 years and 9 female subjects aged 19 to 41 years. Complete data sets for rhodopsin photosensitivity, bleaching action spectrum, and regeneration kinetics were obtained from two volunteer subjects, a female subject aged 29 years (subject 1) and a male subject aged 54 years (subject 2).
Apparatus and Fundus Imaging Procedures
The apparatus comprised two units (Fig. 1): a customized illumination system designed to bleach the subject's rhodopsin homogeneously in circumscribed retinal regions, and an Optos P200C dual-wavelength SLO that imaged the subject's fundus rapidly.
Figure 1.

Photographs of the bleaching apparatus (left) and the Optos P200C SLO (right). The two apparatuses sit adjacent to one another in the experimental room, so that the subject can be positioned rapidly in the SLO after a bleaching exposure. The four whitish circular regions in the bleaching apparatus show the locations of the bleaching stimuli; they are glass diffusing plates behind which a cylinder with four LEDs of the same spectral composition can be located precisely. For the subject properly positioned on the chin rest, these diffusing plates subtend a retinal angle of 4.82° at an eccentricity of 15.9° along the diagonal from the red fixation point. Only one of the diffusing targets was used per experiment, and the results reported were all obtained from experiments using the two lower targets, which were imaged on the superior retina.
Optos P200C.
The SLO simultaneously scans the fundus with CW lasers emitting light of 532 ± 1 nm and 633 ± 1 nm, and scanned a square field of 61° × 61° visual angle (“Resmax” scan mode, 300 ms duration). The lasers have power specifications of 1.4 to 1.7 mW (532 nm) and 0.4 to 0.55 mW (633 nm), and are maintained rigorously by Optos; power variation within a session is a small fraction of the average. Assuming that the lasers of the particular P200C SLO used had powers at the upper end of these specifications, standard conversion formulas yield the average retinal energy densities produced by the 532 and 633 nm lasers (uncorrected for ocular media losses) to be 4.2 × 10⁶ and 1.6 × 10⁶ photons μm−2, respectively, corresponding to 6.0 × 10⁵ and 6.6 × 10² scot Td-s (the 633 nm beam making negligible contribution to the total scotopic energy density of a scan).33 Calculations with the Excel “OcLC” calculator of Dr Francois Delori (personal communication, 2012) predicted that a single 532 nm 1.7 mW scan would bleach 6.6% of the rhodopsin in the scan field; calculations with the bleaching functions fitted to the radiometrically calibrated data of this investigation yield an estimate of approximately 2% bleach of rhodopsin per SLO scan. (Further details are provided in the Supplement, along with an analysis of potential problems such bleaching might cause for the data collection and analysis; see Supplementary Material, http://www.iovs.org/content/54/3/2048/suppl/DC1.) P200 SLOs are designed so that the laser beams entering the eye are approximately 1 mm in diameter and pass unobstructed through the natural pupil, so that subjects' pupils need not be (and were not) dilated. P200 SLOs are approved by the FDA for an unlimited number of repeated scans. The light reflected from the eye is split into two channels, measured by photomultipliers, digitized at 12-bit depth in each channel, and stored in 12-bit tiff files, without gain control, or scaling during collection, storage, or analysis. In the Resmax scan mode, the image sampling resolution is 50.4 pixels/deg, corresponding (for a standard emmetropic eye) to 5.8 μm/pixel at the retina.
Bleaching Apparatus.
The bleaching apparatus comprised a chin rest and a blackened Ganzfeld “dome” whose surface was 17.8 cm from the subject's eyes. The dome had a central fixation light and LED light sources that delivered the bleaching stimuli. The LEDs illuminated four diffusing glass ports in the dome that subtended 4.8° of visual angle, and were located at an eccentricity of 15.9° on the diagonals of a rectangle extending 10.0° superior or inferior, and 12.4° temporal or nasal to fixation (Fig. 1A). LEDs of four different spectral composition were used (modal wavelength ± HWHM): 470 ± 13, 505 ± 16, 530 ± 17, and 590 ± 10 nm. Bleaching stimuli were calibrated by measuring the light flux at the plane of the pupil with a calibrated photodiode (UDT Pin10 DF). The measured light flux and measured source solid angle were used to derive the luminance (scot candelas m−2) of the LED sources. Finally, the time-integrated retinal irradiance (J cm2, photons μm−2) and illuminance (scot Td-s) of each bleaching exposure were calculated using the average measured area in mm2 of the subject's pupil during the exposure period (≤8 seconds), the geometric image area, and standard ocular media transmissivity functions (described below). The maximum time-integrated retinal irradiances produced by the LEDs during a single bleaching exposure was approximately 0.01 J cm−2 (corresponding to 107.7 and 107.6 scot Td-s for the 505 and 530 nm stimuli, respectively). These energy densities are less than 2% of the minimal levels shown to cause autofluorescence dimming.31
General Protocol
Subjects were dark adapted for 30 minutes before experiments. One to four (typically three) SLO scans of the dark adapted fundus, taken at intervals separated by at least one minute, were used to determine the baseline reflectance. The subject then was positioned in the bleaching dome and, while fixating a small red target, was exposed to a bleaching stimulus of preset duration up to 8 seconds. A video camera mounted on the back of the bleaching dome imaged the subject's pupil throughout the bleaching exposure. The pupil images recorded during the bleaching exposure were postprocessed to determine the average pupil area during the exposure period, and also to determine whether the subject blinked or made eye movements that would invalidate the trial. Immediately following the termination of the bleaching exposure, the subject was positioned in the SLO for imaging: the initial image usually was taken within 10 seconds of the termination of the bleaching stimulus.
“Bleach versus Intensity” Experiments.
In these experiments the subject was exposed to light of calibrated wavelength, strength, and duration, and a single postbleach measurement was made. When multiple measurements were made in a single session, at least 1 hour dark adaptation preceded each bleaching exposure.
“Bleach/Recovery” Experiments.
In these experiments a time-integrated retinal illuminance of at least 107.6 scot Td-s was used to bleach rhodopsin; by previously published results (summarized and discussed below), and results presented here, this corresponds to a full bleach. After the bleaching exposure, SLO images were captured at intervals separated by a least 5 minutes for up to 25 minutes, with the exception of the second postbleach scan, which was taken 1 minute after the first.
Autofluorescence Imaging.
Fundus autofluorescence was excited with the 532 nm SLO scan beam and the fluorescence image captured by the detector path used normally for 633 nm reflectance, but with a dichroic splitter in place that passed only light of wavelength greater than 546 nm. (The 633 nm beam did not illuminate the retina during autofluorescence imaging.) Otherwise the experimental protocol followed was identical to that used in measurement of light reflected from the fundus.
Theoretical Analysis of Rhodopsin Bleaching and Regeneration
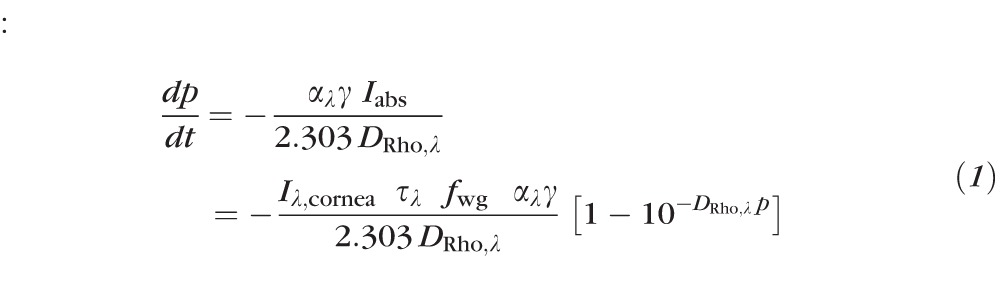
To relate measured changes in fundus reflectance to rhodopsin, we now present a formal description of rhodopsin absorption, bleaching, and regeneration in situ. During the presentation of a step of light of wavelength λ whose duration t is sufficiently short that regeneration can be neglected, the rate of change of the fraction p of rhodopsin in a rods obeys34
 : :
|
where αλγ is the photosensitivity, with αλ (unit: μm2 molecule−1) being the extinction coefficient of rhodopsin in situ for axially propagating light and γ the quantum efficiency of isomerization/bleaching, Iabs (unit: photons μm−2 s−1) is the rate of photon capture by rhodopsin per unit area of the retina occupied by rods, Iλ,cornea (unit: photons μm−2 s−1) is the retinal irradiance in the absence of losses in the ocular media, τλ is the transmissivity of the ocular media and retina up to the depth where light is guided into the rod, fwg is a dimensionless factor (≤1) by which the rod waveguide condenses or funnels light into the outer segment, DRho,λ is the optical density of the pigment in the dark adapted eye for axially propagating light, and parameters indexed by λ are wavelength-dependent. Solution of Equation 1 yields a relation in which p(t) is expressible as a function of the bleaching energy Iλ,cornea t, and “bleach versus energy” (p versus Iλ,cornea t) curves can be generated readily from it with numerical methods. In the special case of low pigment density (DRho,λ ≤ 0.1), the solution of Equation 1 is an exponential decay:
 |
The product represents the time-integrated photon irradiance incident on the base of the outer segment (after adjustment for media losses τλ and for waveguide condensation by the waveguide factor fwg), multiplied by the photosensitivity αλγ of rhodopsin in the disc membranes. The argument of the exponential in Equation 2 is dimensionless, and can be reparametrized in other useful ways. Thus, when the time-integrated irradiance is converted to illuminance (unit: scot Td-s), Equation 2 can be rewritten as:
 |
where , and sλ a scaling constant proportional to αλ.
Regeneration of rhodopsin was assumed to follow rate-limited kinetics, which characterizes rod and cone visual pigment regeneration in many species, including human, in normal and diseased conditions.1,35 Accordingly, the fraction B(t) of unregenerated rhodopsin in the rods at time t after an exposure that bleaches a fraction B0 of the pigment is given by:
 |
where Km is a dimensionless constant, r (unit: s−1) the initial, rate-limiting regeneration rate, and W(x) the “Lambert W” function.35
Model of Fundus Reflectance
We employed the model of van de Kraats et al. of foveal fundus reflectance,9 slightly modifying the model to incorporate components of reflectance from the base and tip of the outer segment observed recently with adaptive-optics–OCT (AO-OCT).36 The model comprises reflection and absorption at three distinct layers: (1) the ocular media anterior to the inner segment, where wave guiding by photoreceptors begins; (2) the photoreceptor layer, where reflection by the discs and absorption by bleachable visual pigment occurs; and (3) the postreceptor layer, which includes the highly absorptive melanin of the RPE and choroid, and the highly reflective sclera. The total reflectance of the model eye is expressed as
 |
In Equation 5, τλ is the transmissivity of the prephotoreceptor layer (“prePRL”), ρprePRL is the lumped reflectance of prePRL elements (assumed spectrally neutral9), ρPRs the internal reflectance of the photoreceptors, and ρpostPRL the reflectance of postphotoreceptor layers (further details are presented in the Supplementary Material, http://www.iovs.org/content/54/3/2048/suppl/DC1).
Image Analysis: The Reflectance Double Ratio
Fundus imaging with the OPTOS P200 SLO does not require pupil dilation, as the laser scan beams pass readily through the normal pupil. However, this feature of the instrument is a potential liability in a quantitative study, because the absolute quantity of reflected light captured by the imaging system depends necessarily on the pupil area, which can vary from trial to trial. To obviate this problem, we developed a measure that takes advantage of the intrinsically spatial nature of the fundus reflectance data of the SLO, as now described.
Pre- and postbleach 532 nm reflectance SLO images were cropped to include a large region of interest surrounding the bleach locus. The cropped 532 nm reflectance images then were registered spatially to find the x-, y-pixel displacements between each of the 532 nm cropped reflectance images and that recorded immediately following the bleach. Registration was done using a custom Matlab script25 based on the normalized cross correlation between these images. Because the bleach locus encompasses only a small portion of the full image, the alignment of each 532 nm reflectance image at the bleach location was verified visually, and the common x-, y-displacements applied to the 532 and 633 nm paired images were adjusted manually if needed.
The bleached locus was identified readily in the initial postbleach 532 nm image for most trials (Figs. 2A, 2E). For trials in which the bleached locus was not identified easily, the images from that trial were registered to a reference image where the bleach locus was identified easily using the same procedure as described above. A digital image mask (Fig. 2F) was created defining the pixels inside the bleached region from which reflectance data from all the images in a given bleach/regeneration trial were extracted. To insure that small eye movements during the bleaching exposure did not compromise the measurements, a concentric annular region of the image surrounding the bleach locus was excluded from the analysis by design of the central mask. Pixels corresponding to preretinal blood vessels also were excluded. A second larger annular concentric mask also was generated, selecting an area outside the bleached area, that is, an area not exposed to the bleaching light (Fig. 2F). The quantity of interest in the experiments is the change in fundus reflectivity arising from exposure to the bleaching stimulus. As the classic reflection densitometry literature has demonstrated amply, it is preferable to measure the ratio of reflected light of a wavelength absorbed strongly by rhodopsin to that of one absorbed negligibly. Thus, identifying I532,in as the average intensity of the 532 nm laser light reflected from the fundus region inside the bleach field and captured by the imaging system, and I633,in as the corresponding light from the 633 nm scan, we calculated for each image captured the average ratio of the light of the two wavelengths reflected from the fundus, that is, the reflectance ratio:
 |
However, as we noticed that this latter ratio (even in the absence of bleaching) was affected by several factors that varied randomly from trial-to-trial, we derived a further measure from the paired images, the “reflectance double ratio” (RDR):
 |
Because the optical paths of the scan beams illuminating and reflected from the retinal regions inside and outside the bleach exposure field are very similar, the RDR adjusts automatically for a variety of factors that can affect the absolute quantities of light captured within a given image, including patient alignment, tear film, pupil size, and trial-to-trial variations in laser power.
Figure 2.

Processing of SLO images. (A–C) Images from a single SLO scan of the fundus of the right eye of subject 02 taken immediately after exposure of the superior temporal retina to a 4.8° diameter target delivering a time-integrated retinal illuminance of 1.5 × 10⁷ scot Td-s. (A) represents the image from the 532 nm SLO channel, (B) the image from the 633 nm channel, and (C) gives the composite image. The 532 nm image clearly shows the “bleached” region in the upper left corner, along with retinal vasculature (dark), the avascular fovea, and the optic disc, while the 633 nm image is dominated by the choroidal vasculature. (D, E) Contrast-enhanced, 532 nm images of the same subject presented in grayscale and taken in the dark-adapted state (D), and immediately after the bleaching exposure ([E] represents the same image as in [A]). (F) Magnified image of the bleached region in (E), illustrating the retinal regions used in calculating the RDR: the average signal (in pixel units) from the pale blue inner circle, which is situated inside the bleached region, was used to extract I532,in and I633,in, while the average signal of the region covered by the pale yellow annulus was used to extract I532,out and I633,out (Equation 8), from which RDR (Equation 9) is derived. Pixels corresponding to blood vessels were excluded from analysis. (G) Autofluorescence image taken immediately following the bleaching exposure of 1.5 × 10⁷ scot Td-s; the autofluorescence signal increased at the locus exposed to the bleaching stimulus. (The scale in [F] is in pixel units; a pixel is estimated to be 5.8 μm × 5.8 μm; cf. Methods.)
We present evidence that of the four quantities in Equation 7, only I532,in is altered materially by the exposure to stimuli that bleach rhodopsin. Tentatively accepting this conclusion, it follows that:
 |
where “ ≡ ” signifies a definition and is a measureable constant not dependent on the bleach state of the center (“in”) region. (We will provide evidence that , and thus , is approximately directly proportional to the fraction of rhodopsin present at the retinal locus bleached.) Experimentally, we measured ΔRDR (Equation 8) by subtracting the average RDR of 1 to 4 (typically 3) images obtained from the fully dark adapted eye from the RDR derived from each postbleach image. (As we are concerned primarily with I532,in and with RDR, for simplicity we will drop the second subscript, “in,” with the understanding that unsubscripted I532 refers to the light reflected from the region exposed to the bleaching stimulus.)
To understand better the utility of the RDR and the predictions for the bleaching experiments, it is helpful to express the reflectance ratio (Equation 6) in terms of the model of the eye's reflectance (Equation 5). Thus, for the inside region exposed to the bleaching stimulus:
 |
and similarly for RRout. In Equation 9, Iλ,cornea represents the retinal flux density of the scan beam measured at the cornea, Apupil the area of the pupil, and the other factors are as in Equation 4 (referred to the inside region). By forming from Equation 9 the double ratio, RDR = RRin/RRout, one finds that dependence on the absolute intensities of the scanning beams, on pupil area (which affects the quantity of reflected light captured, but not the quantity incident on the retina), and on the prephotoreceptor media transmissivity τλ cancel out. Thus, trial-to-trial variation in the first two of these factors is predicted to be nullified by using the RDR measure.
Autofluorescence
When autofluorescence was measured, only the autofluorescence image channel was analyzed. Using the same digital image mask as described above, the autofluorescence ratio (AFR) in each image was calculated as the average pixel intensity inside the bleach area to the average pixel intensity in the surrounding area outside the bleach field.
 |
Again the dark adapted autofluorescence ratio was subtracted from each of the autofluorescence ratios of the post bleach images to give the incremental autofluorescence ratio:
 |
Least-Squares Fitting of Recovery Data
The recoveries of RDR or AFR to baseline level after a bleaching exposure were fitted by least squares with the rate-limited model of rhodopsin regeneration (Equation 4):
 |
and similarly for AFR(t). Details of the fitting procedure are provided in the Supplement (see Supplementary Material and Supplementary Fig. S5, http://www.iovs.org/content/54/3/2048/suppl/DC1).
Results
Characterization of SLO RDR measurements
To characterize the SLO data, we analyzed the four components of reflected light (I532,in; I633,in; I532,out; I633,out) measured in experiments in which subjects were exposed to retinal illuminances exceeding approximately 107 scot Td-s (Fig. 3). Such exposures produced highly significant increases in the reflectance of 532 nm light, and somewhat smaller but correspondingly significant changes in RDR. For subject 1 (Fig. 3A) there was negligible average change in the 532 nm light reflected from the annular region surrounding the bleach field (compare Fig. 2E, “outside”), and in the 633 nm light reflected from either the bleached (“inside”) or annular field. For subject 2 (Fig. 3D) there were small, but statistically reliable decreases in the 633 nm reflectance from bleached and unbleached regions, and a relatively small reliable increase in the 532 nm reflectance from the unbleached region. Comparison of the pattern of these changes between subjects suggests that the older subject 2 had somewhat poorer fixation during the bleaching exposure, and/or increased scattering of the bleaching light into the annular region surrounding the nominal bleached region.
Figure 3.

Characterization of the RDR measure and application of the model of van de Kraats et al.9 of fundus reflectance. Results are summarized from 88 experiments in which 4.8° diameter fields centered at 15.9° eccentricity (Fig. 2) on the superior retinas of two subjects were exposed to retinal illuminances exceeding 107.0 scot Td-s. (A, D) Fractional changes in the 532 and 633 nm light reflected from the “inside” (bleached) and “outside” regions (compare Fig. 2E) consequent to the bleaching exposure. Error bars: 95% confidence intervals (CI). (B, E) Scatterplots of the incremental change in RDR (ΔRDR) versus the incremental 532 nm reflectance for subjects 1 and 2. These are the trial-by-trial data underlying the average ΔRDR (black bars) and ΔI532,in/I532,in,dark (larger green bars) in (A, D). The white symbols with error bars plot the mean and standard deviations of the two sets of measurements; note the much higher CV (SD/mean) for ΔI532,in/I532,in,dark versus ΔRDR. (C, F) Application of the van de Kraats et al model.9 The smooth curves plot the total reflectance of the eye predicted for different fractions of rhodopsin ranging from 0 (uppermost curve) to 1.0 (lowermost), with absolute (right) and normalized (left) ordinates. The larger green symbols plot the measured fractional change in 532 nm reflectance from (A, D) (ΔI532, left ordinate) along with 95% CIs. Human rhodopsin is assumed to have a λmax of 491 nm,38 and to be present at this retinal location with a total axial density of 0.45, assuming an outer segment length of 30 μm39 and a specific axial density of 0.016 OD μm−1. Insets: the values of the smaller green symbols attached to the curves at 532 nm are replotted as a function of the fraction rhodopsin, and fitted with a linear regression, predicting an approximate proportionality of the fraction rhodopsin bleached and ΔI532,in (further details of the reflectance model are provided in the Supplementary Material, http://www.iovs.org/content/54/3/2048/suppl/DC1).
The trial-to-trial variability of the incremental 532 nm reflectance (ΔI532/I532) was much higher than the variability of ΔRDR. This higher variability is illustrated directly by a scatterplot of the two covariates (Figs. 3B, 3E), and confirmed by the relative magnitudes of their coefficients of variation (CV = SD/mean): CV (ΔI532/I532)/CV(ΔRDR) = 3.3, and 7.0 for subjects 1 and 2, respectively. These results support the inference that use of the RDR measure substantially reduces trial-to-trial variability by appropriate use of covariant measures not affected by bleaching. As ΔRDR is expected to be approximately proportional to ΔI532/I532 (Equation 8), the much lower CV of the former relative to the latter is at first surprising. The explanation is that for each scanning wavelength there is a very high correlation between the reflected light measured from “inside” and “outside” regions: the correlation coefficients exceeded 0.99 for the paired variables (I532,in, I532,out) and (I633,in, I633,out) for scans of dark adapted subjects (see Supplementary Material and Supplementary Figs. S3, S4, http://www.iovs.org/content/54/3/2048/suppl/DC1). Thus, because the “outside” region largely is unaffected by the bleaching exposure, its reflectance ratio (compare Equation 9) anchors the corresponding ratio from the “inside” region on individual trials following bleaching to a local, “dark adapted” value obtained on the same scan. Overall, then, ΔRDR is a variance-reduced, proportionate surrogate for ΔI532/I532. Limited results obtained from a population of 10 additional subjects exposed to the same bleaching stimulus show ΔRDR values of magnitude comparable to those of subjects 1 and 2 (Table 1).
Table 1. .
Measurements of Bleaching-Induced Incremental Reflectivity
|
Subject No. |
Age |
Eye |
Field |
ΔRDR |
N |
| 01 | 29 | OD | ST | 0.32 | 8 |
| OS | ST | 0.36 | 4 | ||
| 02 | 54 | OD | ST | 0.43 | 4 |
| OS | ST | 0.32 | 6 | ||
| 03 | 25 | OD | ST | 0.34 | 1 |
| OD | IT | 0.27 | 1 | ||
| OS | ST | 0.32 | 1 | ||
| 04 | 41 | OD | IT | 0.16 | 1 |
| 05 | 21 | OD | ST | 0.44 | 1 |
| OS | ST | 0.39 | 2 | ||
| 06 | 22 | OD | ST | 0.48 | 1 |
| 07 | 26 | OS | ST | 0.29 | 1 |
| 08 | 22 | OS | ST | 0.31 | 1 |
| 09 | 19 | OS | ST | 0.33 | 1 |
| 10 | 28 | OS | ST | 0.14 | 2 |
| 11 | 22 | OS | ST | 0.32 | 1 |
| 12 | 63 | OS | ST | 0.25 | 4 |
| Average ± 95% CI | 0.32 ± 0.04 |
ΔRDR is the incremental reflectance double ratio after exposure to light expected to fully bleach rhodopsin. ΔRDR is predicted to be directly proportional to (and close in magnitude to) the incremental change in 532 nm reflectance (Equation 11). N (final column) refers to the number of observations made immediately after exposure of the fully dark adapted eye to the bleaching stimulus; each such observation entailed 2 to 4 baseline scans from which RDRdark was calculated.
To frame these results in terms of the components of the eye responsible for fundus reflectivity, we fitted the bleach-induced increases in 532 nm light for each subject with a variant of van de Kraats et al's. model9 (see Supplementary Material and Supplementary Fig. S2, Table S1, http://www.iovs.org/content/54/3/2048/suppl/DC1) of the reflectance spectrum of the eye (Figs. 3C, 3F). The 532 nm light reflected in the dark (I532) was scaled to unity, and the measured increments (ΔI532) from Figures 3A, 3D added (larger green symbols with error bars). The van de Kraats model was constrained so that the reflectance spectra predicted for rhodopsin at its dark-adapted complement (lowermost curve) and fully bleached (uppermost curve) were in correspondence at 532 nm to the dark adapted (I532) and bleach-incremented (I532 + ΔI532) reflectances. This analysis illustrates that, as observed experimentally, rhodopsin bleaching is not expected to alter materially the fundus reflectance for 633 nm light, and predicts further that the incremental reflectance at 532 nm is an approximately linear function of the fraction of rhodopsin bleached, B = 1 − p (Figs. 3C, 3F; insets). Thus, we have the useful approximation:
 |
where the first line repeats Equation 8. (This latter relation underlies Equation 12, the formulation applying the rate-limited model of regeneration to the measurements [below].)
Action Spectrum and Photosensitivity of the Incremental Reflectance Change
We determined the photosensitivity of the incremental change in 532 nm reflectance in experiments in which the retina was exposed to calibrated exposures of 470, 505, 530, and 590 nm light (Figs. 4A, 4D). For both subjects the incremental reflectance was a graded function of the exposure intensity over approximately 2 log10 units, with 590 nm light being far less effective than light of the other wavelengths. We fitted these data simultaneously with the solution to the bleaching equation (Equation 1) and from the fitted curves extracted the action spectrum of the reflectance increase. The spectrum of the incremental reflectance change is well described by the absorption spectrum of human rhodopsin (λmax = 491 nm34,37) in situ, corrected for losses in the preretinal media (Figs. 4C, 4F, unbroken purple curves). The CIE scotopic sensitivity function (dashed curve) provides a less adequate description of the data, with the data reliably deviating from V′λ at 470 nm.
Figure 4.

Action spectrum and photosensitivity of the incremental 532 nm reflectance. (A, D) Incremental reflectance versus bleach intensity for λ = 470, 505, 530, and 590 nm, both subjects; the smooth curves represent , where p, the fraction of rhodopsin present, was obtained as the solution to Equation 1 (see Supplementary Material and Supplementary Fig. S1, http://www.iovs.org/content/54/3/2048/suppl/DC1). The curves were fitted simultaneously to the data by least squares, and each plotted point is the average of at least 8 measurements. The data of both eyes and two symmetric retinal positions have been pooled, and error bars are 95% CIs. (B, E) Data of (A, D) replotted with all bleaching intensities converted to scot Td-s. The unbroken theoretical curve gives , where p is the solution to Equation 1 appropriate to the λmax (maximal axial density), reparametrized for light intensity expressed as in photometric units. The dashed curves represent the exponential bleaching function (Equation 3), fitted to the results by least squares. (C, F) Photosensitivity spectra (reciprocal action spectra) of the incremental reflectance derived from the analysis of (A, D). The upper and lower range of the error bars represent the values of photosensitivity (αλγ in Equation 1) at which the RMS error of fitting rises 3-fold above the minimum, that is, the best-fitting value. The unbroken purple curves plot the absorption spectrum of rhodopsin for rods in situ, that is, with λmax = 491 nm, and total axial density of 0.45, corrected (as in Figs. 3C, 3F) for ocular media transmission appropriate to the observer's age (see Supplementary Material, http://www.iovs.org/content/54/3/2048/suppl/DC1). The dashed curve is the 1951 CIE scotopic luminosity function (V′λ). The apparent average photosensitivity (obtained from the fitting of the spectra in [C, F] for the two subjects, compare Equation 1) in molecular units is fwg αλmaxγ = 3.1 × 10⁻⁸ μm2; in molar units this corresponds to fwg εmax γ = 140,000 L (mole cm)−1.
To compare our results with previously published retinal densitometric measurements of rhodopsin, we converted the bleaching energies into retinal illuminance units (scot Td-s), replotted all the incremental reflectance data accordingly, and fitted them with the simplified exponential bleaching function (Figs. 4B, 4E, dashed line; Equation 3; Table 2). It bears emphasis that the fitting of Equation 3 should be taken as a parametrically simplified empirical characterization, and does not imply rhodopsin to be present in low density. This follows, because the solution to Equation 1 embodying an axial density of 0.45 clearly fits the results equally well (Figs. 4A, 4D), and moreover the theoretic bleaching curves for low and high density do not differ much in shape (see Supplementary Material and Supplementary Fig. S1, http://www.iovs.org/content/54/3/2048/suppl/DC1).
Table 2. .
Photosensitivity of Rhodopsin Bleaching In Vivo
|
Log10Qe, scot Td-s |
Reference |
| 6.9 | Rushton (1956)5 |
| 6.9 | Ripps & Weale (1969)6 |
| 7.0 | Alpern (1971)7 |
| 7.2 | Current study, subject 01 (Fig. 4B) |
| 7.2 | Current study, subject 02 (Fig. 4E) |
e is the photosensitivity, expressed in units of scotopic illuminance, extracted by fitting the Equation 3 to fundus reflectance data.
Overall, then, we concluded that the bleaching of rhodopsin is the primary factor underlying the fundus reflectance increase measured with the 532 nm SLO scan beam.
Recovery of the Dark Adapted Reflectance after Strong Bleaching Exposures
To characterize further the change in reflectance induced by bleaching exposures, we measured the time course of recovery of the 532 nm reflectance to its dark adapted level, again using the ΔRDR measure (Fig. 5). The reflectance recovered to its baseline level over a period of approximately 25 minutes, and is reasonably well described by rate-limited regeneration kinetics,1 with initial, maximal rates of 7.3% min−1 and 9% min−1 for subjects 1 and 2, respectively. These values are close to the rate (∼9%/min) extracted from previous investigations of human rhodopsin regeneration.1 The initial postbleach measurement for each subject deviated reliably from the best-fitting rate-limited kinetic model.
Figure 5.

Recovery of fundus reflectance to dark adapted level after exposure to light estimated to fully bleach rhodopsin. After 30 minutes of dark adaptation, one to several fundus images were taken to establish baseline, and the retina then exposed locally to a 4.8° diameter, 505 nm light with time-integrated retinal illuminance exceeding 4 × 10⁷ scot Td-s (compare Figs. 4B, 4E). Images then were taken at regular intervals and the incremental RDR (Equation 10) determined. Each plotted point is the mean of at least 8 measurements; the error bars are 95% CIs. The smooth curve plots the rate-limited kinetic model of rhodopsin regeneration (see Methods) fitted by least-squares to the data, with parameters of best fit (r0, Km) as follows: subject 1, 0.073 min−1, 0.25; subject 2, 0.09 min−1, 0.25. Details of the fitting are provided in the Supplement (see Supplementary Material and Supplementary Fig. S5, http://www.iovs.org/content/54/3/2048/suppl/DC1). The initial recovery point for each subject was excluded from the fitting. Based on the Optos P200C specifications, an individual SLO scan was estimated to bleach less than 3% of rhodopsin (see Methods and see Supplementary Material, http://www.iovs.org/content/54/3/2048/suppl/DC1).
Incremental Changes in Autofluorescence Associated with Bleaching
The P200C SLO permits the fundus autofluorescence generated by 532 nm excitation to be measured separately from the reflected light, and so we examined the time course of this autofluorescence after a full bleach (see Methods, Fig. 2G). There was a slightly greater than 30% increase in autofluorescence upon exposure to light that strongly bleaches rhodopsin (Fig. 6). The time course of decay of the incremental autofluorescence ratio (Equation 12) was very similar to that of the recovery of ΔRDR (Fig. 5). The autofluorescence recovery deviates significantly from the best-fitting rate-limited recovery curve at the initial measurement.
Figure 6.

Recovery of fundus autofluorescence to baseline level after exposure to light estimated to fully bleach rhodopsin. The experimental protocol used in collecting the recovery data of Figure 5 was followed, but autofluorescence excited by the 532 nm laser scan beam was recorded (see Methods). The results are the mean values ±95% bi-directional CIs for 16 replications of the experiments by each subject. The results were fitted by least squares with the rate-limited kinetic model (see Methods), with parameters of best fit (r0, Km) as follows: subject 1, 0.075 min−1, 0.4; subject 2, 0.07 min−1, 0.4. The best-fitting theory curves were offset upwards by 0.005 and 0.007, respectively, to better account for a very small, slow component of recovery (or a systematic deviation of the final recovery level from the baseline level).
Discussion
Measurement of Rhodopsin in the Living Eye with a Broadly Available Widefield SLO
Our results establish that properties of rhodopsin in the living eye can be quantified locally in the retina with a broadly deployed widefield clinical SLO, the OPTOS P200. The incremental changes in reflectance recorded by the 532 nm SLO scan channel consequent to exposure to stimuli predicted to bleach visual pigment substantially have the photosensitivity and action spectrum of rhodopsin bleaching in situ (Fig. 4), in good correspondence with previous experimental work (Table 1).11–13,15 Furthermore, the incremental 532 nm reflectance consequent to bleaching exposures decreases over time with a time course consistent with previous measurements of the regeneration of human rhodopsin1 (Fig. 5).
Comparison with Previous Measurements of Rhodopsin In Situ
Photosensitivity.
The photosensitivity of rhodopsin in situ (Qe) estimated here with Equation 3 is consistent with previous photometric estimates made with the same “low density” relation (Fig. 4, Table 2). Overwhelming evidence shows the assumption of low density to be untenable, however. Assuming rather that rods at the eccentricity of these experiments (Fig. 2) have a total axial density at the λmax (491 nm37) of rhodopsin of 0.45,38 the photosensitivity is 44% higher than that determined with the low density variant of the bleaching equation (see Supplementary Material and Supplementary Fig. S1, http://www.iovs.org/content/54/3/2048/suppl/DC1). Indeed, with an axial density of 0.45, the estimated photosensitivity (Figs. 4C, 4F; 140,000) is approximately 3-fold higher than that (εmaxγ = 56,000 L [mol cm]−1) predicted by taking only the orientation of the 11-cis retinal chromophore in the plane of the discs into consideration. Within the framework of the relatively simplistic model of bleaching (Equation 1), the only other factor available to explain the elevated photosensitivity is optical funneling or waveguiding: thus fwg in Equation 1 appears to be approximately 3. It is hoped that EM models of light propagation based on ultrastructural details of the inner segment (where waveguiding begins) might resolve this persistent puzzle.34
Regeneration Kinetics.
The recovery of normal fundus reflectivity for 532 nm light after light exposures that fully bleach rhodopsin follow rate-limited regeneration kinetics with a maximum rate consistent with previous analysis.1
Puzzle of the Absence of a Component of Reflectance Increase Arising from Cones
Histologic sections of human retina at the inner segment level at an eccentricity close to that used in these experiments show that a substantial fraction of the retinal cross section (∼30%) is occupied by cone inner segments38 (see Supplementary Material and Supplementary Fig. S2, http://www.iovs.org/content/54/3/2048/suppl/DC1). Assuming that cones and rods capture and guide light approximately in proportion to their inner segment cross sections, it seems puzzling that neither our experiments nor others reported previously at comparable retinal eccentricities exhibit a component of reflectance increase on bleaching attributable to cones. We propose that the absence of a cone contribution arises from two factors that diminish back reflection from peripheral cones: a relatively short, tapered outer segment that leads to leakage of light from the waveguide, and a lowered reflectivity at the narrow tip of the outer segment (see Supplementary Material and Supplementary Fig. S2C, http://www.iovs.org/content/54/3/2048/suppl/DC1). In contrast, the outer segments of foveal cones are much longer and negligibly tapered (i.e., nearly cylindrical), no doubt contributing to the reflectance from their distal tips. Again, it is hoped that a full electromagnetic analysis of propagation in peripheral cones might resolve this puzzle.
Changes in Fundus Autofluorescence Accompanying Bleaching
Autofluorescence imaging provides an important tool for observing the RPE cell layer in the retina.24,25 Autofluorescence excited by short and mid wavelength excitation is thought to arise primarily from lipofuscin granules that accumulate in the RPE cell as a consequence of photoreceptor outer segment phagocytosis18–20,39 Because of the relatively high axial density of visual pigments, autofluorescence of the RPE layer can be expected to be reduced by absorption of the exciting and emitted light by visual pigments. Our results confirm previous results demonstrating autofluorescence screening by visual pigment,29,30 and show specifically that the local intensity of the 532 nm-excited autofluorescence at 15° eccentricity increases by over 30% in the fully bleached retina compared to the dark adapted retina. (Figs. 2G, 6). Given the similar magnitudes, and similar kinetics of recovery of the reflectance and autofluorescence to their dark adapted levels (Figs. 5, 6), the most parsimonious explanation of the incremental autofluorescence measured in these experiments is that at this eccentricity rhodopsin screens the 532 nm excitation light from the autofluorescent fluorochromes of the RPE, and to a lesser extent the emitted fluorescent light of longer wavelengths that reaches the pupil. These results also show that quantitative measurement of autofluorescence requires bleaching the overlying visual pigment.30
In the first two minutes after a full bleach of rhodopsin, the autofluorescence of both subjects is significantly greater than that predicted from the rate-limited kinetics that describes rhodopsin regeneration (Fig. 6). This component of autofluorescence likely reflects a process other than the removal of the screening by rhodopsin; for example, a component of retinoid processing during the bleach/regeneration cycle. (It is highly unlikely, however, that any of the autofluorescence measured arose from the macular pigment, as the latter is negligible at the 15° eccentricity of the bleaching stimuli.40)
Autofluorescence levels are altered with the progression of several retinal diseases.23,26,41 Our results reveal the importance of accounting for the status of rhodopsin for accurate quantification of fundus autofluorescence. The higher autofluorescence intensity in images from patients with retinal diseases in comparison with normal retinas has been attributed to an increase in the lipofuscin accumulation in the retina.41 However, as shown here, elevated autofluorescence can be caused by a decrease in rhodopsin absorbance, as will happen not only from bleaching exposures, but also from diseases that affect rhodopsin expression and rod outer segment structure. Retinal densitometry in combination with autofluorescence could be used to distinguish between these alternatives.
Advantages of Using the P200C for Rhodopsin Measurements
Use of the P200C SLO to measure rhodopsin has a number of advantages over previous methods. The first and obvious advantage is that the raw data of the measurements are fundus images. Thus, the measurements are mapped intrinsically to the retinotopic location of the bleaching field, and so in principal can be used to investigate local properties of rods and their rhodopsin content. A second and related advantage is that the P200 can image most of the fundus at once, allowing rhodopsin to be measured at virtually any locus in the visual field. A third advantage, of particular value in working with patients, is that pupil dilation is not needed to obtain images with the P200. Thus, by using a calibrated bleaching apparatus, local measurement of rhodopsin would be readily available to many ophthalmic clinics. A fourth advantage accrues from the particular wavelengths, 532 and 633 nm, used in the dual wavelength scanning of the P200. Though reduced to approximately 55% of its absorbance at its λmax (491 nm) rhodopsin has a substantial absorbance for 532 nm, but negligible absorbance for 633 nm light (Figs. 2A, 2B, 3C, 3F). Thus, the reflected 633 nm light is ideal as a control signal reporting trial-to-trial variation due to patient alignment and pupil size (see Equation 12), but remaining unrelated to the bleach state. Furthermore, by taking advantage of the reflectance signals from an annular region surrounding an approximately 5° diameter bleaching field, a measure, the RDR, can be computed that substantially reduces trial-to-trial variation, reducing the number of measurements required to achieve reliable results (Figs. 3B, 3E). Finally, it is notable that approximately 4200 OPTOS P200 SLOs are deployed worldwide in clinics, making it possible for rhodopsin measurement to be a routine assessment.
Conclusion
We have used a widely available wide-field SLO to quantify the properties of rhodopsin locally in the human fundus without pupil dilation. This technique can be adapted readily in the clinical environment with a calibrated bleaching apparatus. Future studies should allow rhodopsin to be characterized in normal and diseased retinas simultaneously at multiple retinal loci across the retina.
Supplementary Material
Acknowledgments
Optos, PLC generously provided the P200C scanning laser ophthalmoscope for this work, and David Cairns provided much encouragement and assistance.
Footnotes
Supported by NIH EY02660, the Foundation Fighting Blindness, the RPB Foundation, the F. M. Kirby Foundation, the Institute for Translational Medicine and Therapeutics of the University of Pennsylvania (Grant UL1RR024134 from the National Center for Research Resources). The authors alone are responsible for the content and writing of the paper.
Disclosure: J.I.W. Morgan, None; E.N. Pugh Jr, None
References
- 1. Lamb TD, Pugh EN. Dark adaptation and the retinoid cycle of vision. Prog Retin Eye Res. 2004; 23: 307–380 [DOI] [PubMed] [Google Scholar]
- 2. Hartong DT, Berson EL, Dryja TP. Retinitis pigmentosa. Lancet. 2006; 368: 1795–1809 [DOI] [PubMed] [Google Scholar]
- 3. RetNet. Retinal information network. 2012. Available at https://sph.uth.tmc.edu/Retnet/ [Google Scholar]
- 4. Malanson KM, Lem J. Rhodopsin-mediated retinitis pigmentosa. Prog Mol Biol Trans Sci. 2009; 88: 1–31 [DOI] [PubMed] [Google Scholar]
- 5. Rushton WAH. The difference spectrum and the photosensitivity of rhodopsin in the living human eye. J Physiol. 1956; 134: 11–29 [DOI] [PMC free article] [PubMed] [Google Scholar]
- 6. Ripps H, Weale RA. Flash bleaching of rhodopsin in the human retina. J Physiol. 1969; 200: 151–159 [DOI] [PMC free article] [PubMed] [Google Scholar]
- 7. Alpern M. Rhodopsin kinetics in the human eye. J Physiol. 1971; 217: 447–471 [DOI] [PMC free article] [PubMed] [Google Scholar]
- 8. Van Norren D, Tiemeijer LF. Spectral reflectance of the human eye. Vision Res. 1986; 26: 313–320 [DOI] [PubMed] [Google Scholar]
- 9. van de Kraats J, Berendschot TT, Van Norren D. The pathways of light measured in fundus reflectometry. Vision Res. 1996; 36: 2229–2247 [DOI] [PubMed] [Google Scholar]
- 10. Berendschot TT, DeLint PJ, van Norren D. Fundus reflectance–historical and present ideas. Prog Retin Eye Res. 2003; 22: 171–200 [DOI] [PubMed] [Google Scholar]
- 11. Faulkner DJ, Kemp CM. Human rhodopsin measurements using a TV-based imaging fundus reflectometer. Vision Res. 1984; 24: 221–231 [DOI] [PubMed] [Google Scholar]
- 12. Elsner AE, Burns SA, Hughes GW, Webb RH. Reflectometry with a scanning laser ophthalmoscope. Appl Opt. 1992; 31: 3697–3710 [DOI] [PubMed] [Google Scholar]
- 13. Van Norren D, Van de Kraats J. Imaging retinal densitometry with a confocal scanning laser ophthalmoscope. Vision Res. 1989; 29: 1825–1830 [DOI] [PubMed] [Google Scholar]
- 14. Tornow RP, Stilling R, Zrenner E. Scanning laser densitometry and color perimetry demonstrate reduced photopigment density and sensitivity in two patients with retinal degeneration. Vision Res. 1999; 39: 3630–3641 [DOI] [PubMed] [Google Scholar]
- 15. Sheorey UB. Clinical assessment of rhodopsin in the eye. Using a standard fundus camera and a photographic technique. Br J Ophthalmol. 1976; 60: 135–141 [DOI] [PMC free article] [PubMed] [Google Scholar]
- 16. Strauss O. The retinal pigment epithelium in visual function. Physiol Rev. 2005; 85: 845–881 [DOI] [PubMed] [Google Scholar]
- 17. Thompson DA, Gal A. Vitamin A metabolism in the retinal pigment epithelium: genes mutations, and diseases. Prog Retin Eye Res. 2003; 22: 683–703 [DOI] [PubMed] [Google Scholar]
- 18. Feeneyburns L, Hilderbrand ES, Eldridge S. Aging human RPE: Morphometric analysis of macular, equatorial, and peripheral cells. Invest Ophthalmol Vis Sci. 1984; 25: 195–200 [PubMed] [Google Scholar]
- 19. Delori FC, Goger DG, Dorey CK. Age-related accumulation and spatial distribution of lipofuscin in RPE of normal subjects. Invest Ophthalmol Vis Sci. 2001; 42: 1855–1866 [PubMed] [Google Scholar]
- 20. Delori FC, Dorey CK, Staurenghi G, Arend O, Goger DG, Weiter JJ. In vivo fluorescence of the ocular fundus exhibits retinal pigment epithelium lipofuscin characteristics. Invest Ophthalmol Vis Sci. 1995; 36: 718–729 [PubMed] [Google Scholar]
- 21. Bindewald A, Jorzik JJ, Loesch A, Schutt F, Holz FG. Visualization of retinal pigment epithelial cells in vivo using digital high-resolution confocal scanning laser ophthalmoscopy. Am J Ophthalmol. 2004; 137: 556–558 [DOI] [PubMed] [Google Scholar]
- 22. Holz FG, Bellman C, Staudt S, Schutt F, Volcker HE. Fundus autofluorescence and development of geographic atrophy in age-related macular degeneration. Invest Ophthalmol Vis Sci. 2001; 42: 1051–1056 [PubMed] [Google Scholar]
- 23. Lois N, Halfyard AS, Bird AC, Fitzke FW. Quantitative evaluation of fundus autofluorescence imaged “in vivo” in eyes with retinal disease. Br J Ophthalmol. 2000; 84: 741–745 [DOI] [PMC free article] [PubMed] [Google Scholar]
- 24. von Ruckmann A, Fitzke FW, Bird AC. Distribution of fundus autofluorescence with a scanning laser ophthalmoscope. Br J Ophthalmol. 1995; 79: 407–412 [DOI] [PMC free article] [PubMed] [Google Scholar]
- 25. Morgan JIW, Dubra A, Wolfe R, Merigan WH, Williams DR. In vivo autofluorescence imaging of the human and macaque retinal pigment epithelial cell mosaic. Invest Ophthalmol Vis Sci. 2009; 50: 1350–1359 [DOI] [PMC free article] [PubMed] [Google Scholar]
- 26. Lois N, Halfyard AS, Bird AC, Holder GE, Fitzke FW. Fundus autofluorescence in Stargardt macular dystrophy-fundus flavimaculatus. Am J Ophthalmol. 2004; 138: 55–63 [DOI] [PubMed] [Google Scholar]
- 27. von Ruckmann A, Fitzke FW, Bird AC. Fundus autofluorescence in age-related macular disease imaged with a laser scanning ophthalmoscope. Invest Ophthalmol Vis Sci. 1997; 38: 478–486 [PubMed] [Google Scholar]
- 28. Holz FG, Bellmann C, Margaritidis M, Schutt F, Otto TP, Volcker HE. Patterns of increased in vivo fundus autofluorescence in the junctional zone of geographic atrophy of the retinal pigment epithelium associated with age-related macular degeneration. Graefe's Arch Clin Exp Ophthalmol. 1999; 237: 145–152 [DOI] [PubMed] [Google Scholar]
- 29. Prieto PM, McLellan JS, Burns SA. Investigating the light absorption in a single pass through the photoreceptor layer by means of the lipofuscin fluorescence. Vision Res. 2005; 45: 1957–1965 [DOI] [PMC free article] [PubMed] [Google Scholar]
- 30. Delori F, Greenberg JP, Woods RL, et al. Quantitative measurements of autofluorescence with the scanning laser ophthalmoscope. Invest Ophthalmol Vis Sci. 2011; 52: 9379–9390 [DOI] [PMC free article] [PubMed] [Google Scholar]
- 31. Morgan JIW, Hunter JJ, Merigan WH, Williams DR. The reduction of retinal autofluorescence caused by light exposure. Invest Ophthalmol Vis Sci. 2009; 50: 6015–6022 [DOI] [PMC free article] [PubMed] [Google Scholar]
- 32. Morgan JIW, Hunter JJ, Masella B, et al. Light-induced retinal changes observed using high-resolution autofluorescence imaging of the retinal pigment epithelium. Invest Ophthalmol Vis Sci. 2008; 49: 3715–3729 [DOI] [PMC free article] [PubMed] [Google Scholar]
- 33. Wyszecki G, Stiles WS. Color Science: Concepts and Methods, Quantitative Data and Formulae. 2nd ed. New York, NY: John Wiley & Sons; 1982. [Google Scholar]
- 34. Alpern M, Pugh EN Jr. The density and photosensitivity of human rhodopsin in the living retina. J Physiol. 1974; 237: 341–370 [DOI] [PMC free article] [PubMed] [Google Scholar]
- 35. Mahroo OA, Lamb TD. Recovery of the human photopic electroretinogram after bleaching exposures: estimation of pigment regeneration kinetics. J Physiol. 2004; 554: 417–437 [DOI] [PMC free article] [PubMed] [Google Scholar]
- 36. Pircher M, Zawadzki RJ, Evans JW, Werner JS, Hitzenberger CK. Simultaneous imaging of human cone mosaic with adaptive optics enhanced scanning laser ophthalmoscopy and high-speed transversal scanning optical coherence tomography. Opt Lett. 2008; 33: 22–24 [DOI] [PMC free article] [PubMed] [Google Scholar]
- 37. Baylor DA, Nunn BJ, Schnapf JL. The photocurrent, noise, and spectral sensitivity of rods of the monkey Macaca fascicularis. J Physiol. 1984; 357: 575–607 [DOI] [PMC free article] [PubMed] [Google Scholar]
- 38. Curcio CA, Sloan KR, Kalina RE, Hendrickson AE. Human photoreceptor topography. J Comp Neurol. 1990; 292: 497–523 [DOI] [PubMed] [Google Scholar]
- 39. Radu RA, Mata NL, Nusinowitz S, Liu XR, Sieving PA, Travis GH. Treatment with isotretinoin inhibits lipofuscin accumulation in a mouse model of recessive Stargardt's macular degeneration. Proc Natl Acad Sci U S A. 2003; 100: 4742–4747 [DOI] [PMC free article] [PubMed] [Google Scholar]
- 40. Delori FC, Goger DG, Hammond BR, Snodderly DM, Burns SA. Macular pigment density measured by autofluorescence spectrometry: comparison with reflectometry and heterochromatic flicker photometry. J Opt Soc Am A Opt Image Sci Vis. 2001; 18: 1212–1230 [DOI] [PubMed] [Google Scholar]
- 41. Cideciyan AV, Aleman TS, Swider M, et al. Mutations in ABCA4 result in accumulation of lipofuscin before slowing of the retinoid cycle: a reappraisal of the human disease sequence. Hum Mol Genet. 2004; 13: 525–534 [DOI] [PubMed] [Google Scholar]
Associated Data
This section collects any data citations, data availability statements, or supplementary materials included in this article.