

Abstract
Recent studies have reported that biofeedback of real-time functional magnetic resonance imaging data can enable people to gain control of activity in specific parts of their brain and can alter functional connectivity between brain areas. Here we describe a study using biofeedback of real-time functional magnetic resonance imaging data to train healthy subjects to control activity in their supplementary motor area (SMA), a region of interest in Tourette syndrome (TS). Although a significant increase in control over the SMA during biofeedback was not found, subjects were able to exert significant control over the SMA in later biofeedback sessions despite not having control in the first biofeedback session. Further, changes were found in their resting state functional connectivity. Specifically, when comparing functional connectivity to the SMA before and after biofeedback, the strength of functional connectivity with subcortical regions was reduced after the biofeedback. This suggests that biofeedback may allow subjects to develop greater conscious control over activity in their SMA by reducing the influence of corticostriatothalamocortical loops on the region. This possibility is promising for TS, where aberrant dynamics in corticostriatothalamocortical loops have long been suspected to give rise to tic symptoms. Further studies in TS patients are needed.
Key words: corticostriatothalamocortical loops, CSTC loops, functional connectivity, neurofeedback, real-time, real-time fMRI, rt-fMRI, SMA, supplementary motor area, tics, Tourette's, Tourette syndrome
Introduction
Real-time processing of functional magnetic resonance imaging data (rt-fMRI) is a novel technique that offers a promising new form of biofeedback. Conventional biofeedback provides subjects with information about their general arousal level, or poorly localized measures of their brain function. However, biofeedback of rt-fMRI data can provide subjects with information about activity in specific regions of their brain (Cox et al., 1995; Posse et al., 2003). Recent studies have established that such feedback can enable individuals to modulate brain activity in a regionally specific manner (Caria et al., 2007; deCharms et al., 2004, 2005; Haller et al., 2010; Hamilton et al., 2011; McCaig et al., 2011; Rota et al., 2009; Weiskopf et al., 2003; Yoo and Jolesz, 2002; Yoo et al., 2006), and thus to control specific aspects of their brain function. The potential to train patients to modulate brain activity so as to reduce clinical symptoms makes biofeedback of fMRI data an exciting area of translational research with a wide range of potential applications. For example, one study reported that subjects were able to learn to modulate the activity in their rostral anterior cingulate cortex, and that modulation of this activity level was correlated with a decrease in pain perception, both in healthy controls and in patients with chronic pain (deCharms et al., 2005). Biofeedback via rt-fMRI has potential clinical utility for a wide range of neuropsychiatric disorders whose pathophysiology is characterized either by regional hypo- or hyperactivation, or by distinct spatial patterns of activity of a more distributed nature.
We are interested in the potential of biofeedback of rt-fMRI data from the supplementary motor area (SMA) as a clinical treatment for Tourette syndrome (TS). There is growing evidence that the SMA is an important component in the neural network giving rise to chronic tics in TS. First, stimulation of the SMA is known to produce both movements and urges to move reminiscent of the premonitory urges TS patients experience preceding their tics (Fried et al., 1991). The nature of the movements (or corresponding urges) range from simple motor acts to complex movements, paralleling the range of simple to complex tics experienced in TS (Fried et al., 1991). Second, imaging studies have repeatedly implicated this region in chronic tics (Biswal et al., 1998; Braun et al., 1993). The SMA has been shown to be more active during periods in which patients experienced more tics (Stern et al., 2000). A study that investigated brain activity patterns immediately before and during tics reported that the SMA was active before tics (Bohlhalter et al., 2006). Although the SMA is also active before normal movement, the SMA activity before tics is even more pronounced than SMA activity before intentional movements (Hampson et al., 2009). Finally, although repetitive transcranial magnetic stimulation (rTMS) studies that have stimulated primary motor, premotor, or prefrontal areas have reported little or no symptom improvement in patients with tics (Chae et al., 2004; Münchau et al., 2002; Orth et al., 2005), two suppressive rTMS studies targeting the SMA have reported marked improvement in tic symptoms (Mantovani et al., 2006, 2007). Thus, the SMA appears to be an important region in the neural circuitry giving rise to tics and a promising locus for intervention in this disorder.
As a first step to evaluating the clinical potential of rt-fMRI biofeedback of SMA activity in TS, we conducted a study in healthy controls. The aims were to investigate whether healthy subjects can gain control over activity in their SMA when provided with biofeedback via rt-fMRI and to examine how that biofeedback affects intrinsic brain dynamics. Specifically, patterns of resting state functional connectivity to the SMA were compared before and after the biofeedback. The expectation was that subjects would learn to use prefrontal cortical areas to consciously control the SMA, and to reduce the influence of subcortical regions on the SMA. Thus, the hypothesis was that there would be an increase in functional connectivity between the SMA and prefrontal regions, and a decrease in connectivity between the SMA and subcortical regions.
To date, there is limited work examining the effects of rt-fMRI biofeedback on interregional brain dynamics. One recent study reported alterations in functional and effective connectivity to the right inferior frontal gyrus during a biofeedback intervention targeting that brain area (Rota et al., 2011) and another reported decreased functional connectivity between the subgenual anterior cingulate cortex and the posterior cingulate cortex during biofeedback of subgenual cingulate activity (Hamilton et al., 2011). In contrast, the focus in this study is on changes in intrinsic brain dynamics that extend beyond the time frame of the intervention itself. Therefore, we examined how resting state functional connectivity to the target region (SMA) was altered by the biofeedback paradigm.
There are a variety of approaches available for evaluating changes in functional connectivity. A recent study using a model to simulate neural activity patterns and the resulting fMRI data reported that psycho-physiological interaction analysis was better than a correlation-based analysis at identifying changes in connectivity during different task conditions (Kim and Horwitz, 2008). That study, however, was based upon block design data from different tasks and its relevance to resting state connectivity analyses is unclear. Further work is needed to determine the optimal approach for evaluating changes in resting state connectivity. For this study, we adopted a simple and commonly used approach: seed region correlations. The SMA was used as the seed region, and correlations to this region were compared before and after the biofeedback.
Materials and Methods
Subject recruitment
Eight healthy subjects (four men, four women, ages 19–46) were recruited by word of mouth and by flyers posted in the New Haven area. The study was performed in accordance with a protocol approved by the Human Research Protection Program of Yale University, and in accordance with the Helsinki Declaration.
Experimental paradigm
Before participation, we discussed with each subject a variety of initial strategies they could try for controlling SMA activity level. To activate the region, it was suggested they could try thinking about the complex movements they perform during sports or fine-motor skill activities, performing cognitively demanding tasks, such as mental arithmetic, and imagining the rotation of three-dimensional objects. To decrease activity in the SMA, it was suggested that they clear their minds, relax, and refrain from any attention demanding, focused cognitive thought. Subjects participated in four biofeedback scanning sessions, each of which involved the collection of eight full runs of functional data: one resting state run, six biofeedback runs, and a final resting state run. During biofeedback runs, subjects viewed a visual stimulus depicting a line graph that was updated every 2 sec to indicate the activity of their SMA. They were instructed to try to minimize the activity level in their SMA (to try to get the line to go down), when the line color was blue and to try to increase the activity level in their SMA (to try to get the line to move up) when the line color was red. To avoid any possible confusion, when the line color was blue, the word “Decrease” appeared in blue above the line graph, and when the line color was red, the word “Increase” appeared in red above the line graph. They were told to expect a 6–8 sec delay between changes in their mental state, and changes in the line graph, due to delays inherent in the hemodynamic response as well as processing delays. The visual display viewed by subjects is shown in Figure 1. For the resting runs, subjects were instructed just to lie still with their eyes open and rest. The four scanning sessions were scheduled on separate days about half a week apart, so that the entire study took approximately 2 weeks to complete for each subject. After completion of the study, the subjects were questioned regarding which strategies they found most effective for increasing and decreasing activity in the region.
FIG. 1.
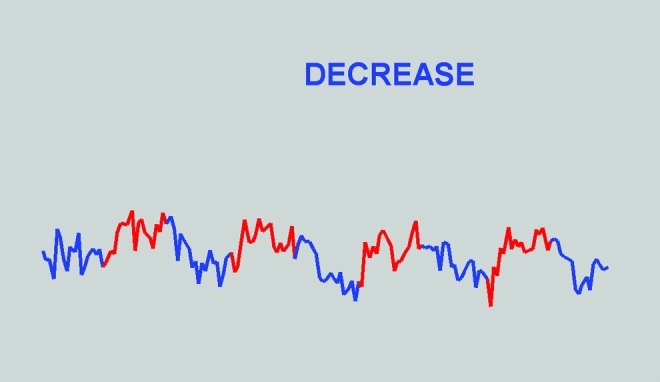
Screen shot of the visual display viewed during biofeedback, taken at the end of a run. Note that after accounting for a 6 sec delay, SMA activity was greater during red than blue periods, reflecting the success of this subject in controlling the region. The graph covers the time frame from the moment the first volume is processed (approximately 3 sec after the start of the run) until the time the 160th volume is processed (approximately 321 sec after the start of the run). The y-axis indicates percent signal change from the running mean in the SMA minus the percent signal change from the running mean in the white matter control region of interest (in this run, amplitudes ranged between 0.34 and −0.47). SMA, supplementary motor area.
Imaging protocol
Subjects were scanned in a Siemens 1.5 T Sonata scanner. Each session began with a localizer scan. In the first session, this was followed by a high-resolution sagittal scan, collected using a magnetization prepared rapid gradient echo (MPRAGE) sequence, which was used to register data to the “Colin” brain (Holmes et al., 1998). The Colin brain was used to define the overall reference coordinate system. In the later sessions, the localizer scan was followed by a shorter, lower-resolution T1-weighted sagittal scan. The sagittal scan was used to identify the line running from the superior part of the anterior commissure to the center of the posterior commissure (the AC-PC line), and then a T1-weighted anatomical scan was collected with 23 contiguous, 4.5–mm-thick AC-PC aligned axial-oblique slices with coverage extending one slice above the top of the brain (to ensure coverage of the SMA after motion correction). After these structural images, acquisition of functional data began in the same slice locations as the axial-oblique T1-weighted data. Functional images were acquired using a T2*-sensitive gradient-recalled single shot echo-planar pulse sequence (repetition time=2000 ms, echo time=40 ms, flip angle=90, Bandwidth=1446 Hz/pixel, 64×64 matrix, field of view: 220 mm×220 mm, interleaved acquisition). Functional data collection began with a short functional run of only three volumes (first two discarded), which was used as the functional reference volume. The collection of the full functional runs then commenced, and eight runs, each involving the acquisition of 164 volumes (first 2 discarded), were collected. The last two volumes in the biofeedback runs were also discarded.
Image processing before biofeedback scans
Two regions of interest (ROIs) were defined based on anatomy on the Colin brain: the SMA, and a white matter control region covering much of the white matter in the brain. In each scanning session, after the anatomical images were collected, these ROIs were transformed from the coordinate space of the Colin brain to the space of the individual subject's functional reference scan via a concatenation of three transformations: (i) a nonlinear registration of the Colin brain to that subject's MPRAGE image, (ii) a linear rigid transformation to the space of their axial-oblique anatomical data, and (iii) a linear rigid transformation to the space of the functional reference image. All transformations were performed using appropriate modules of the Yale BioImage Suite software package (www.bioimagesuite.org) and were visually inspected to ensure accuracy. The SMA region and its transformation into the space of the functional scan of an individual subject are shown in Figure 2. In this manner, in the biofeedback scanning session, before the beginning of the biofeedback scans, the SMA ROI and the control, white matter ROI were translated into the functional space of the biofeedback scans.
FIG. 2.

Example registration of the SMA region into the space of the functional scan. Panel (A) shows the SMA region as defined on the Colin brain. Panel (B) shows this region transformed (via a nonlinear registration) to the space of the subject's high-resolution magnetization prepared rapid gradient echo data, and overlayed on that data. Panel (C) shows the region transformed to the space of the subject's axial-oblique anatomical data. Panel (D) shows the region transformed to the space of the subject's functional reference scan. Slices are displayed using radiological convention (i.e. left is on the right).
Real-time fMRI
The rt-fMRI protocol was implemented by modifying the image reconstruction pipeline of Siemens' Image Calculation Environment. More specifically, we modified the online function by inserting a new local “functor” in the online processing chain, immediately before the ImageSendFunctor that sends the image to the system database. After each slice of the image is acquired and reconstructed, this functor writes the slice image as a file in a directory accessible to a separate image processing computer connected by local area network. During biofeedback scans, the image analysis program (a new module of BioImage Suite: www.bioimagesuite.org) on the image processing computer read in the slices as they appeared. When half the slices in the volume had arrived (the data were collected interleaved, so at this point every other slice in the volume had been collected), the program computed a linear rigid registration between that data and the functional reference volume. Once the complete volume had arrived, the computed registration was applied to transform that volume into the space of the functional reference volume, in order to adjust for motion. The average signal levels in the two ROIs (the SMA, and the control, white matter ROI) were then computed for the volume and output via serial port to the stimulus/feedback computer. A Matlab (www.mathworks.com) program running on the stimulus/feedback computer then computed an estimate of ROI activity normalized to adjust for drift and whole brain fluctuations using the computation described in deCharms et al. (2005). Specifically, at each time point (i.e., for each volume of data collected), percent signal change from the running mean was computed for both the SMA and white matter ROIs, and the difference in those two measures was plotted as a line graph over time.
Offline data analyses
Imaging data were motion-corrected using SPM5 (www.fil.ion.ucl.ac.uk/spm/software/spm5/) and subsequent analyses were conducted in BioImage Suite (www.bioimagesuite.org).
Evaluation of control over the target region
“Increase” blocks were defined as a regressor in a general linear model, after convolving with a standard hemodynamic response, and a beta map representing activation during “Increase” blocks was computed for each run. The average beta value in the SMA was computed for each biofeedback run of each subject and averaged across runs in each session to yield estimates of the control the subject had over their SMA in each of the four sessions. For each of the four sessions, a single sample t-test was used to determine if subjects had significant control over the brain area in that session (i.e., if the control estimates from that session for the eight subjects were significantly greater than zero). In addition, we tested for a significant increase in control across sessions using three paired t-tests, which compared (1) control in the second session to control in the first session, (2) control in the third session to control in the first session, and (3) control in the fourth session to control in the first session.
Evaluation of functional connectivity to the SMA in the resting runs
The time-course of activity in the SMA was correlated with the time-course of each pixel in the brain, removing the effects of the time-course of the slice in which that pixel was located via partial correlation. This is similar to global regression, but better at removing global transients that occur during a brief portion of the volume collection (such as cardiac pulses). The correlations were then transformed to z-values using Fisher's transform to yield a map of functional connectivity to the SMA for each resting state scan of each subject. These maps were transformed to the coordinate space of the Colin brain via a concatenation of three registrations: (i) a linear rigid transformation of the functional data to the axial-oblique anatomical data collected in the same scanning session, (ii) a linear rigid transformation of the axial-oblique anatomical data to that subject's MPRAGE image, and (iii) a nonlinear registration of that subject's MPRAGE image to the Colin brain. All registrations were inspected visually to ensure accuracy. A group map comparing functional connectivity in the resting run preceding the first biofeedback session to functional connectivity in the resting run after the last biofeedback session was computed in the space of the Colin brain using pixel-wise two-tailed paired t-tests. To correct for multiple comparisons, the resulting map was cluster corrected (p<0.05 whole-brain correction) using a Monte Carlo simulation within the AFNI (http://afni.nimh.nih.gov/afni) program AlphaSim.
Results
Control over the SMA
Based on activation during “Increase” blocks in the biofeedback runs, subjects did not exhibit significant control over their SMA in their first biofeedback session, and did not show a significant increase in control across sessions (i.e., the paired t-tests comparing control in the second, third, and fourth sessions to control in the first session did not yield significant findings). However, subjects did exhibit significant control over their SMA in the second, third, and fourth biofeedback sessions. These results are shown in Figure 3.
FIG. 3.

Estimated control over the SMA across sessions. Subjects showed significant control over the region in the later sessions, but not in the first, as indicated by the asterisks.
Our estimates of the control that subjects had over their SMA were based on whether they successfully increased activity in the region during “Increase” relative to “Decrease” periods during the biofeedback scans. Although this is a common method of assessment used in rt-fMRI biofeedback studies, it has the problem that when subjects experiment with novel strategies, which are perhaps not as effective as a strategy they know works, the assessment underestimates their true level of control. Because subjects were encouraged to experiment with new strategies throughout the study, they often received low ratings of control even after they had discovered an approach that worked well for them, because they were testing out other strategies. This method of assessment likely limited our power and contributed to the fact that we did not find a significant increase in control across sessions in our study.
The most effective strategies for controlling the region varied somewhat across individuals. However, all subjects reported that they could increase activity in the SMA by thinking about executing familiar, skilled motor acts (such as sports they regularly played, or fine motor skills they regularly used) and could decrease activity in the region by avoiding focused cognitive thought.
Resting state functional connectivity to the SMA
The group map showing changes in functional connectivity to the SMA after versus before the biofeedback at a p<0.05 whole-brain cluster corrected threshold is shown in Figure 4. There are no regions showing significant increases in connectivity to the SMA. However, significantly decreased connectivity is apparent between the SMA and subcortical regions, including the left striatum and right thalamus.
FIG. 4.

Group map comparing resting state connectivity to the SMA after biofeedback with resting state connectivity to the SMA before biofeedback, shown at a p<0.05 whole-brain cluster-corrected threshold. Slices are displayed using radiological convention (i.e. left is on the right). Decreases can be seen in subcortical regions.
Discussion
We failed to find evidence of a significant increase in control over the SMA in this study. As noted in the Results section, this may be due in part to the fact that we were assessing control during the biofeedback runs. In future biofeedback studies, we recommend including separate runs to assess control over the target region in which subjects do not receive biofeedback but are simply instructed to increase/decrease activity in their target region at specific times, using whatever strategy they believe to be most effective. This will increase power for detecting improved control in two ways. First, it will allow subjects to concentrate solely on the task of controlling their brain region without simultaneously monitoring a feedback signal when their control is being evaluated, thus providing a more sensitive measure of their control. Second, and more critically, it will ensure that subjects are not experimenting with novel strategies when their control over the brain area is being assessed.
Another factor limiting power in our study was the anatomical definition of our target region. The use of functional localizers to identify a very focal, functionally specific area in subjects can yield greater power, essentially by reducing noise in the time-course related to fluctuations in irrelevant areas. However, we were interested in the possibility that, by obtaining control over the SMA, TS patients could reduce their tic symptoms. It would be possible to identify precisely that part of the SMA involved in each patient's most frequent or troublesome tic, and try to train subjects to control that region. However, the tics of TS patients are known to migrate, that is, to move from one body part to another. Therefore, training subjects just to control one part of the SMA would likely have little clinical utility. For this reason, we used the entire SMA as a control region, rather than functionally localizing one part of it. However, for rt-fMRI biofeedback studies of different phenomena, functionally localizing the target region may be a preferable approach. Alternatively, approaches that do not focus on a specific target region, but that train subjects to achieve (or to avoid) certain whole-brain patterns of activity may be useful (LaConte et al., 2007).
One final factor that may have influenced our power in this study is the continuous form of biofeedback provided. A recent report comparing intermittent and continuous feedback paradigms found that subjects exhibited greater control over activity in their left premotor cortex during intermittent feedback than during continuous feedback (McCaig et al., 2011). This is likely due to the additional effort required for monitoring the feedback signal in the continuous feedback condition. However, because control over the brain area was assessed during the biofeedback runs in that study, it was not clear whether the decrease in control for the continuous feedback condition reflected decreased learning in that condition, or decreased ability to apply that learning to the task of controlling the region due to the greater attentional demands of continuously monitoring the timecourse during the time period in which control was being assessed. Once again, studies in which control is assessed in separate scans before and after the feedback may be helpful.
We were encouraged to find that subjects were able to control their SMA in the later biofeedback sessions, despite lacking control in the first session. One question of interest is whether this form of biofeedback can change brain dynamics in a manner that extends beyond the time frame of the biofeedback itself. A few studies have addressed this issue by examining whether activation patterns were altered after the biofeedback. Although one study reported that changes in brain activity patterns during feedback did not generalize to a post-training scan immediately after biofeedback (Hamilton et al., 2011), another reported changes in activity patterns were still present at a 2-week follow-up in a paradigm involving daily practice after the feedback session (Yoo et al., 2007). In this study, we investigated whether the biofeedback induced changes in the intrinsic functional architecture of the brain as assessed with resting state functional connectivity measures immediately after the biofeedback. Our hypothesis was that resting connectivity to the SMA would increase in prefrontal regions and decrease in subcortical regions as a result of the biofeedback. We did not see any significant increases in connectivity to the SMA in prefrontal regions at a whole-brain corrected level. We did, however, see significant decreases in the subcortical regions as hypothesized. There is growing evidence of altered structure and cellular composition in the basal ganglia of TS patients (Kalanithi et al., 2005; Kataoka et al., 2010; Peterson et al., 2003), consistent with the view that the tics of TS patients are caused by aberrant circuitry in the motor corticostriatothalamocortical (CSTC) loop (Leckman, 2002; Leckman et al., 1997). Thus, the subcortical regions are likely influencing the SMA in an unhealthy manner in TS, and possibly driving hyperactivity in the SMA. If a biofeedback paradigm can successfully reduce that influence in patients, it may disrupt the unhealthy CSTC dynamics and lead to an amelioration of tic symptoms. Thus, this finding is exciting from a clinical perspective.
A new safe and effective treatment for TS is greatly needed. TS is a disorder that is relatively common in childhood, with prevalence rates estimated close to 2% in 13–14-year-old children (Hornsey et al., 2001). Although many individuals recover, some continue to suffer throughout their lives. Chronic tics are the defining symptom of the disorder. These repetitive, undesired movements can be exhausting, dangerous, self-injurious, and socially damaging to the patient. Although a variety of drugs are available for reducing tics, there are many individuals for whom these drugs are ineffective, and even when they are effective, the side effects are often problematic. Alternative treatments are currently being developed for cases of severe TS, including deep brain stimulation, and rTMS (Bajwa et al., 2007; Chae et al., 2004; Mantovani et al., 2006, 2007; Münchau et al., 2002; Orth et al., 2005; Visser-Vandewalle et al., 2003). These approaches use direct stimulation of focal brain areas (in a biologically unnatural manner) to disrupt the network involved in producing tics. However, the disruptive and risky nature of these approaches is a serious drawback. Biofeedback may provide a safer approach to controlling tics, by enabling patients to develop control over brain activity in the neural network that gives rise to tics.
However, this study did not include a control or sham group. Thus, it is possible that the act of practicing strategies for controlling the SMA, in itself, altered subjects' intrinsic brain dynamics, and that the biofeedback was not a critical contributor. This would be interesting in a different sense, in that it would suggest novel behavioral therapies for future study, but would have very different implications. Further biofeedback studies involving control groups who participate in the same strategies without receiving the feedback (or while receiving sham biofeedback) are needed to determine the degree to which the induced alterations in resting state functional connectivity depend upon biofeedback.
Conclusion
A decrease in resting state connectivity between the SMA and subcortical regions was found after biofeedback of SMA activity level. This suggests that a similar biofeedback paradigm may yield clinical improvement in TS patients. Controlled studies in the patient group are needed to determine the efficacy of this novel treatment approach for TS.
Acknowledgments
This study was funded by the Dana Foundation (M. Hampson) and NIH (R01 EB006494, RO1 EB009666, and R01 NS051622). We thank H. Sarofin for her technical assistance.
Author Disclosure Statement
No competing financial interests exist.
References
- Bajwa RJ. Lotbinière AJd. King RA. Jabbari B. Kunze K. Quatrano S. Scahill L. Leckman JF. Deep brain stimulation in Tourette's syndrome. Mov Disord. 2007;22:1346–1350. doi: 10.1002/mds.21398. [DOI] [PubMed] [Google Scholar]
- Biswal B. Ulmer JL. Krippendorf RL. Harsch HH. Daniels DL. Hyde JS. Haughton VM. Abnormal cerebral activation associated with a motor task in Tourette syndrome. Am J Neuroradiol. 1998;19:1509–1512. [PMC free article] [PubMed] [Google Scholar]
- Bohlhalter S. Goldfine A. Matteson S. Garraux G. Hanakawa T. Kansaku K. Wurzman R. Hallet M. Neural correlates of tic generation in Tourette syndrome: an event-related functional MRI study. Brain. 2006;129:2029–2037. doi: 10.1093/brain/awl050. [DOI] [PubMed] [Google Scholar]
- Braun AR. Stoetter B. Randolph C. Hsiao JK. Vladar K. Gernert J. Carson RE. Herscovitch P. Chase TN. The functional neuroanatomy of Tourette's syndrome: an FDG-PET study. I. Regional changes in cerebral glucose metabolism differentiating patients and controls. Neuropsychopharmacology. 1993;9:277–291. doi: 10.1038/npp.1993.64. [DOI] [PubMed] [Google Scholar]
- Caria A. Veit R. Sitaram R. Lotze M. Weiskopf N. Grodd W. Birbaumer N. Regulation of anterior insula cortex activity using real-time fMRI. NeuroImage. 2007;35:1238–1246. doi: 10.1016/j.neuroimage.2007.01.018. [DOI] [PubMed] [Google Scholar]
- Chae J-H. Nahas Z. Wassermann E. Li X. Sethuraman G. Gilbert D. Sallee FR. George MS. A pilot safety study of repetitive transcranial magnetic stimulation (rTMS) in Tourette's syndrome. Cognitive and Behavioral Neurology: Off J Soc Behav Cogn Neurol. 2004;17:109–117. doi: 10.1097/01.wnn.0000116253.78804.3a. [DOI] [PubMed] [Google Scholar]
- Cox RW. Jesmanowicz A. Hyde JS. Real-time functional magnetic resonance imaging. Magn Reson Med. 1995;33:230–236. doi: 10.1002/mrm.1910330213. [DOI] [PubMed] [Google Scholar]
- deCharms RC. Christoff K. Glover GH. Pauly JM. Whitfield S. Gabrieli JDE. Learned regulation of spatially localized brain activation using real-time fMRI. NeuroImage. 2004;21:436–443. doi: 10.1016/j.neuroimage.2003.08.041. [DOI] [PubMed] [Google Scholar]
- deCharms RC. Maeda F. Glover GH. Ludlow D. Pauly JM. Soneji D. Gabrieli JDE. Mackey SC. Control over brain activation and pain learned by using real-time functional MRI. Proc Natl Acad Sci. 2005;102:18626–18631. doi: 10.1073/pnas.0505210102. [DOI] [PMC free article] [PubMed] [Google Scholar]
- Fried I. Katz A. McCarthy G. Sass KJ. Williamson P. Spencer SS. Spencer DD. Functional organization of human supplementary motor cortex studied by electrical stimulation. J Neurosci. 1991;11:3656–3666. doi: 10.1523/JNEUROSCI.11-11-03656.1991. [DOI] [PMC free article] [PubMed] [Google Scholar]
- Haller S. Birbaumer N. Veit R. Real-time fMRI feedback training may improve chronic tinnitus. Eur Radiol. 2010;20:696–703. doi: 10.1007/s00330-009-1595-z. [DOI] [PubMed] [Google Scholar]
- Hamilton JP. Glover GH. Hsu JJ. Johnson RF. Gotlib IH. Modulation of subgenual anterior cingulate cortex activity with real-time neurofeedback. Hum Brain Mapp. 2011;32:22–31. doi: 10.1002/hbm.20997. [DOI] [PMC free article] [PubMed] [Google Scholar]
- Hampson M. Tokoglu F. King RA. Constable RT. Leckman JF. Brain areas coactivating with motor cortex during chronic motor tics and intentional movements. Biol Psychiatry. 2009;65:594–599. doi: 10.1016/j.biopsych.2008.11.012. [DOI] [PMC free article] [PubMed] [Google Scholar]
- Holmes CJ. Hoge R. Collins L. Woods R. Toga AW. Evans AC. Enhancement of MR images using registration for signal averaging. J Comput Assist Tomogr. 1998;22:324–333. doi: 10.1097/00004728-199803000-00032. [DOI] [PubMed] [Google Scholar]
- Hornsey H. Banerjee S. Zeitlin H. Robertson M. The prevalence of Tourette Syndrome in 13–14-year-olds in mainstream schools. J Child Psychol Psychiatry. 2001;42:1035–1039. doi: 10.1111/1469-7610.00802. [DOI] [PubMed] [Google Scholar]
- Kalanithi PS. Zheng W. Kataoka Y. DiFiglia M. Grantz H. Saper CB. Schwartz ML. Leckman JF. Vaccarino FM. Altered parvalbumin-positive neuron distribution in basal ganglia of individuals with Tourette syndrome. Proc Natl Acad Sci U S A. 2005;102:13307–13312. doi: 10.1073/pnas.0502624102. [DOI] [PMC free article] [PubMed] [Google Scholar]
- Kataoka Y. Kalanithi PS. Grantz H. Schwartz ML. Saper C. Leckman JF. Vaccarino FM. Decreased number of parvalbumin and cholinergic interneurons in the striatum of individuals with Tourette syndrome. J Comp Neurol. 2010;518:277–291. doi: 10.1002/cne.22206. [DOI] [PMC free article] [PubMed] [Google Scholar]
- Kim J. Horwitz B. Investigating the neural basis for fMRI-based functional connectivity in a blocked design: application to interregional correlations and psycho-physiological interactions. Magn Reson Imaging. 2008;26:583–593. doi: 10.1016/j.mri.2007.10.011. [DOI] [PubMed] [Google Scholar]
- LaConte SM. Peltier SJ. Hu XP. Real-time fMRI using brain-state classification. Hum Brain Mapp. 2007;28:1033–1044. doi: 10.1002/hbm.20326. [DOI] [PMC free article] [PubMed] [Google Scholar]
- Leckman JF. Tourette's syndrome. Lancet. 2002;360:1577–1586. doi: 10.1016/S0140-6736(02)11526-1. [DOI] [PubMed] [Google Scholar]
- Leckman JF. Peterson BS. Anderson GM. Arnsten AFT. Pauls DL. Cohen DJ. Pathogenesis of Tourette's syndrome. J Child Psychol Psychiatry and Allied Discip. 1997;31:119–142. doi: 10.1111/j.1469-7610.1997.tb01508.x. [DOI] [PubMed] [Google Scholar]
- Mantovani A. Leckman JF. Grantz H. King RA. Sporn AL. Lisanby SH. Repetitive transcranial magnetic stimulation of the supplementary motor area in the treatment of Tourette Syndrome: report of two cases. Clin Neurophysiol. 2007;118:2314–2315. doi: 10.1016/j.clinph.2007.07.011. [DOI] [PubMed] [Google Scholar]
- Mantovani A. Lisanby SH. Pieraccini F. Ulivelli M. Castrogiovanni P. Rossi S. Repetitive transcranial magnetic stimulation (rTMS) in the treatment of obsessive-compulsive disorder (OCD) and Tourette's syndrome (TS) Int J Neuropsychopharm. 2006;9:95–100. doi: 10.1017/S1461145705005729. [DOI] [PubMed] [Google Scholar]
- McCaig RG. Dixon M. Keramatian K. Liu I. Christoff K. Improved modulation of merostrolateral prefrontal cortex using real-time fMRI training and meta-cognitive awareness. NeuroImage. 2011;55:1298–1305. doi: 10.1016/j.neuroimage.2010.12.016. [DOI] [PubMed] [Google Scholar]
- Münchau A. Bloem BR. Thilo KV. Trimble MR. Rothwell JC. Robertson MM. Repetitive transcranial magnetic stimulation for Tourette syndrome. Neurology. 2002;59:1789–1791. doi: 10.1212/01.wnl.0000036615.25044.50. [DOI] [PubMed] [Google Scholar]
- Orth M. Kirby R. Richardson MP. Snijders AH. Rothwell JC. Trimble MR. Robertson MM. Münchau A. Subthreshold rTMS over pre-motor cortex has no effect on tics in patiens with Gilles de la Tourette syndrome. Clin Neurophysiol. 2005;116:764–768. doi: 10.1016/j.clinph.2004.10.003. [DOI] [PubMed] [Google Scholar]
- Peterson BS. Thomas P. Kane MJ. Scahill L. Zhang H. Bronen R. King RA. Leckman JF. Staib L. Basal ganglia volumes in patients with Gilles de la Tourette Syndrome. Arch Gen Psychiatry. 2003;60:415–424. doi: 10.1001/archpsyc.60.4.415. [DOI] [PubMed] [Google Scholar]
- Posse S. Fitzgerald D. Gao K. Habel U. Rosenberg D. Moore GJ. Schneider F. Real-time fMRI of temporolimbic regions detects amygdala activation during single-trial self-induced sadness. Neuroimage. 2003;18:760–768. doi: 10.1016/s1053-8119(03)00004-1. [DOI] [PubMed] [Google Scholar]
- Rota G. Handjaras G. Sitaram R. Birbaumer N. Dogil G. Reorganization of functional and effective connectivity during real-time fMRI-BCI modulation of prosody processing. Brain Lang. 2011;117:123–132. doi: 10.1016/j.bandl.2010.07.008. [DOI] [PubMed] [Google Scholar]
- Rota G. Sitaram R. Veit R. Erb M. Weiskopf N. Dogil G. Birbaumer N. Self-regulation of regional cortical activity using real-time fMRI: the right inferior frontal gyrus and linguistic processing. Hum Brain Mapp. 2009;30:1605–1614. doi: 10.1002/hbm.20621. [DOI] [PMC free article] [PubMed] [Google Scholar]
- Stern E. Silbersweig DA. Chee K-Y. Holmes A. Robertson MM. Trimble M. Frith CD. Frackowiak RSJ. Dolan RJ. A functional neuroanatomy of tics in Tourette Syndrome. Arch Gen Psychiatry. 2000;57:741–748. doi: 10.1001/archpsyc.57.8.741. [DOI] [PubMed] [Google Scholar]
- Visser-Vandewalle V. Temel Y. Boon P. Vreeling F. Colle H. Hoogland G. Groenewegen HJ. Linden Cvd. Chronic bilateral thalamic stimulation: a new therapeutic approach in intractable Tourette syndrome. J Neurosurg. 2003;99:1094–1100. doi: 10.3171/jns.2003.99.6.1094. [DOI] [PubMed] [Google Scholar]
- Weiskopf N. Veit R. Erb M. Mathiak K. Grodd W. Goebel R. Birbaumer N. Physiological self-regulation of regional brain activity using real-time functional magnetic resonance imaging (fMRI): methodology and exemplary data. NeuroImage. 2003;19:577–586. doi: 10.1016/s1053-8119(03)00145-9. [DOI] [PubMed] [Google Scholar]
- Yoo S-S. Jolesz FA. Functional MRI for neurofeedback: feasibility study on a hand motor task. NeuroReport. 2002;13:1377–1381. doi: 10.1097/00001756-200208070-00005. [DOI] [PubMed] [Google Scholar]
- Yoo SS. Lee JH. O'Leary H. Lee V. Choo SE. Jolesz FA. Functional magnetic resonance imaging-mediated learning of increased activity in auditory areas. Neuroreport. 2007;18:1915–1920. doi: 10.1097/WNR.0b013e3282f202ac. [DOI] [PubMed] [Google Scholar]
- Yoo SS. O'Leary HM. Fairneny T. Chen NK. Panych LP. Park H. Jolesz FA. Increasing cortical activity in auditory areas through neurofeedback functional magnetic resonance imaging. Neuroreport. 2006;17:1273–1278. doi: 10.1097/01.wnr.0000227996.53540.22. [DOI] [PubMed] [Google Scholar]