

Abstract
The human brain is inherently organized as separate networks, as has been widely revealed by resting-state functional magnetic resonance imaging (fMRI). Although the large-scale functional connectivity can be partially explained by the underlying white-matter structural connectivity, the question of whether the underlying functional connectivity is related to brain metabolic factors is still largely unanswered. The present study investigated the presence of metabolic covariant networks across subjects using a set of fluorodeoxyglucose (18F, FDG) positron-emission tomography (PET) images. Spatial-independent component analysis was performed on the subject series of FDG-PET images. A number of networks that were mainly homotopic regions could be identified, including visual, auditory, motor, cerebellar, and subcortical networks. However, the anterior-posterior networks such as the default-mode and left frontoparietal networks could not be observed. Region-of-interest-based correlation analysis confirmed that the intersubject metabolic covariances within the default-mode and left frontoparietal networks were reduced as compared with corresponding time-series correlations using resting-state fMRI from an independent sample. In contrast, homotopic intersubject metabolic covariances observed using PET were comparable to the corresponding fMRI resting-state time-series correlations. The current study provides preliminary illustration, suggesting that the human brain metabolism pertains to organized covariance patterns that might partially reflect functional connectivity as revealed by resting-state blood oxygen level dependent (BOLD). The discrepancy between the PET covariance and BOLD functional connectivity might reflect the differences of energy consumption coupling and ongoing neural synchronization within these brain networks.
Key words: brain metabolism, brain network, default-mode network, independent component analysis, metabolism covariance, PET
Introduction
The human brain is intrinsically organized into different networks, as revealed by resting-state functional magnetic resonance imaging (fMRI) (Beckmann et al., 2005; Biswal et al., 2010). After the initial observation that the blood oxygen level-dependent (BOLD) signals from functionally related regions exhibit high correlation in the absence of any explicit tasks (Biswal et al., 1995), a great deal of research has been conducted to analyze the functional connectivity between regions and the network organizations of the whole brain. The brain has consequently been classified as being composed of anticorrelated task-positive and negative networks (Fox et al., 2005), or extrinsic- and intrinsic-oriented networks (Golland et al., 2008). Using spatial-independent component analysis (ICA), brain networks showing a hierarchical organization from the module level to system level have been observed (Beckmann et al., 2005; Biswal et al., 2010; Doucet et al., 2011).
Currently, the majority of the connectivity analyses of brain organization conducted have been based on fMRI time series. The fMRI signals are indirect measures of neuronal activity and subjected to intermediate physiological responses, including the cerebral metabolism rate of glucose/oxygen, cerebral blood flow (CBF), and cerebral blood volume (CBV) (Buxton et al., 1998; Raichle, 1987). Investigating the correlations of brain metabolism, CBF, and CBV among brain regions can provide insight into the underlying mechanism of the whole brain network organizations. In a seminal study, Horwitz and colleagues, using fluorodeoxyglucose (18F, FDG) positron-emission tomography (PET), investigated the intersubject metabolic correlations among brain regions, and found high correlations between homotopic regions and similar correlation pattern within the left and right hemispheres (Horwitz et al., 1984). This article suggested that there were organized patterns of brain metabolism, and the associated metabolic activity might reflect the relevant brain functions between those regions. However, a subsequent study of FDG-PET using seed-based correlations showed limited intersubject correlation distributed across the whole brain (Lee, 2008). In a recent study using cerebral metabolic rate of oxygenation (CMRO2) MRI images, Wu and colleagues observed high correlations of CMRO2 time series within functional networks, including visual network, default-mode network (DMN), and hippocampus, respectively (Wu et al., 2009). These studies using the seed-based correlation method are limited because of the requirement of prespecified number of regions of interest (ROIs). A data-driven method is helpful to study the whole-brain organization without choosing ROIs a priori (Park et al., 2003). In this study, Park and colleagues used ICA on PET data during stimulus presentation to identify eloquent brain regions corresponding to the stimulus.
In the present study, spatial ICA- and ROI-based correlations were used to study the covariance of brain metabolisms obtained using PET. Briefly, spatial ICA is a statistical procedure commonly used in fMRI studies to decompose the brain into distinct networks (Beckmann et al., 2005; Calhoun et al., 2001). The input for fMRI ICA was the concatenation of each individual subject's fMRI time-series images. The input for the PET ICA was the subject series of PET images, with one mean PET image per subject. In this study, a set of 18F FDG-PET images of 155 healthy old (63–94 years) subjects derived from the Alzheimer's Disease Neuroimaging Initiative (ADNI), reflecting regional brain glucose uptake, was analyzed using spatial ICA. Spatially independent networks were obtained based on the interindividual differences of FDG-PET measures. We predict that the regions that are functionally correlated will show distinct independent networks using either PET or resting-state fMRI datasets. As an alternative to spatial ICA, the ROI-based correlation analysis was also performed between the ROIs, which are known to be functionally connected in resting-state fMRI studies (e.g., Biswal et al., 2010). We hypothesize that the regions that are functionally connected will show higher correlations of metabolic activity than regions that are not functionally related.
Methods
FDG-PET data
Data used in the preparation of this article were obtained from the ADNI database (adni.loni.ucla.edu). The ADNI was launched in 2003 by the National Institute on Aging (NIA), the National Institute of Biomedical Imaging and Bioengineering (NIBIB), the Food and Drug Administration (FDA), private pharmaceutical companies, and nonprofit organizations as a $60 million, 5-year public–private partnership. The primary goal of ADNI has been to test whether serial MRI, PET, other biological markers, and clinical and neuropsychological assessment can be combined to measure the progression of mild cognitive impairment (MCI) and early Alzheimer's disease (AD). Determination of sensitive and specific markers of very early AD progression is intended to aid researchers and clinicians to develop new treatments and monitor their effectiveness, as well as lessen the time and cost of clinical trials.
The Principal Investigator of this initiative is Michael W. Weiner, M.D., VA Medical Center and University of California, San Francisco. ADNI is the result of efforts of many coinvestigators from a broad range of academic institutions and private corporations, and subjects have been recruited from over 50 sites across the United States and Canada.
The initial goal of ADNI was to recruit 800 adults, ages 55 to 90, to participate in the research, ∼200 cognitively normal older individuals to be followed for 3 years, 400 people with MCI to be followed for 3 years, and 200 people with early AD to be followed for 2 years. In the present study, only the healthy, nondementia subjects who had both FDG-PET and high-resolution magnetization-prepared rapid gradient echo (MPRAGE) MRI images were included in the analyses. In total 155, old subjects were included (95 men), with an age range of 63–94 years (mean=77.2; SD=6.0). The PET data were scanned from different PET scanners with different protocols. In the present study, we used the single-frame static FDG-PET image or the mean FDG-PET image, a subject from other protocols to construct a subject series of FDG-PET images. Spatial ICA and ROI-based connectivity analysis were performed on this subject series of FDG-PET images.
Resting-state fMRI data
Because in this study we only had PET images of old subjects, to control the potential effects of aging, we used resting-state BOLD images in the same age range from another set of subjects. The resting-state fMRI dataset consists of 30 subjects (all men). The age range was from 65 to 92 years (Mean=80.3; SD=5.5). The mean ages were statistically not different between the two data sets [t(183)=0.254, p=0.80].
MRI images were acquired using a 3.0T Siemens MRI scanner with a 12-channel head coil (Siemens Magnetom Tim Trio, Erlangen, Germany). All the images were acquired parallel to the anterior commissure–posterior commissure line. For the resting-state scan, 200 images were acquired with a TR of 2500 ms. The scanning parameters were as follows: TE=27; acquisition matrix=64×64; flip angle=77°; slices=43; spatial resolution=3.44×3.44×3.40 mm. A high-resolution MPRAGE structural image was also acquired for each subject. The scanning parameters were as follows: TR=2530 ms; TE=3.5 ms; flip angle=7°; resolution=1×1×1 mm (no gap).
PET image preprocessing
The image data were preprocessed using SPM8 software (www.fil.ion.ucl.ac.uk/spm/) based on MATLAB7.6 (www.mathworks.com). Three types of PET protocols were used for different subjects: static, dynamic, and quantitative. For the static protocol, there was one single PET image for each subject. For the dynamic protocol, six PET images were acquired for each subject. For the quantitative protocol, 33 PET images were acquired for each subject, of which only the last 6 images were used in the current analysis. For each subject with multiple PET images, all the six PET images were realigned to the first image, and the mean image was then calculated representing average glucose metabolisms. This resulted in one FDG-PET image for each subject. The PET image for each subject was coregistered to the subject's own high-resolution T1 structural image. The T1 images were segmented using the new segment routine implemented in SPM8. The deformation field, which was obtained during the segmentation step, was applied to the subject's PET image, so that the PET images were spatially normalized to the standard Montreal Neurological Institute (MNI) space. During the normalization step, all the PET images were resampled at 3×3×3 mm3. All the spatially normalized PET images were spatially smoothed using a Gaussian kernel of 8-mm full-width at half maximum (FWHM). Finally, all the PET images were normalized by dividing the whole-brain mean signal from the original image.
BOLD image preprocessing
For each subject, the first two scans of the resting-state fMRI BOLD images were discarded. The remaining BOLD images were motion-corrected and coregistered to the subject's own high-resolution T1 structural image. The T1 images were segmented using the new segment tool in SPM8, and the deformation fields were obtained. Then, the deformation field maps were applied to the functional images to spatially normalize all of the BOLD images into the MNI space. During the spatial normalization step, all the BOLD images were resampled at a voxel size of 3×3×3 mm3. Finally, all of the BOLD images were smoothed using a Gaussian kernel of 8-mm FWHM.
Spatial ICA
Spatial ICA was carried out using the Group ICA of fMRI Toolbox (GIFT; http://icatb.sourceforge.net/) (Calhoun et al., 2001). For the FDG-PET images, each of the subject's mean preprocessed PET images were concatenated to form a subject series and entered into the ICA process. Because the number of components present in PET metabolic images is not known, we first extracted 20 components and then 40 components. For the fMRI data, group ICA was conducted with 20 components extracted (Biswal et al., 2010). The resulting independent components were z-transformed and visualized using the threshold of z>1.96 (p<0.05). Every map was visually inspected and compared to previous resting-state ICA results (Biswal et al., 2010; Cole et al., 2010) to classify them as meaningful components or noise.
ROI-based connectivity analysis
From ICA results, we can infer that two regions that are presented in the same IC are spatially correlated. However, if two regions are not presented in the same IC, it is hard to conclude that the two regions are not correlated, because the two regions might be arbitrarily separated by the algorithm due, for example, to the extraction of too many components. Therefore, we directly calculated the correlations between regions that are generally believed to be functionally connected, to examine the differences between metabolic covariance and resting-state correlations between these regions. The ROI were defined from an ICA of 1000 subjects' resting-state fMRI data (Biswal et al., 2010). Seven commonly reported ICs were selected. The IC numbers of the Supplementary Figure S3 in Biswal et al. (2010) are listed in Table 1. The peak coordinates of the two main nodes of each IC were obtained. By calculating the correlations among the 14 ROIs (7 networks * 2 ROIs each), we can compare the differences of within-network correlations and between-network correlations. The ROIs were defined as spheres centered at the peak coordinates with a radius of 8 mm.
Table 1.
Resting-State Networks and ROIs, and the Results of ROI-Based Correlation Analyses
| |
|
|
MNI coordinate |
Fisher's z |
||||
|---|---|---|---|---|---|---|---|---|
| Network | IC # | ROI label | x | y | z | PET | fMRI (SD) | Difference t(p) |
| Default | IC6 | MPFC | 0 | 60 | −6 | 0.070 | 0.66 (0.34) | 9.51 (2.0×10⁻¹⁰)* |
| PCC | 3 | −42 | 27 | |||||
| L Executive | IC11 | LSFG | −30 | 21 | 51 | 0.36 | 0.75 (0.29) | 7.31 (4.7×10⁻⁸)* |
| LIPL_Ex | −48 | −57 | 42 | |||||
| R Executive | IC8 | RSFG | 42 | 24 | 42 | 0.49 | 0.60 (0.33) | 1.77 (0.088) |
| RIPL_Ex | 54 | −51 | 42 | |||||
| Salience | IC17 | LIFG | −36 | 18 | 3 | 0.69 | 0.76 (0.26) | 1.55 (0.13) |
| RIFG | 42 | 15 | −3 | |||||
| Attention | IC9 | LIPL_Att | −54 | −30 | 42 | 0.61 | 0.66 (0.35) | 0.816 (0.42) |
| RIPL_Att | 42 | −36 | 48 | |||||
| Sensorimotor | IC19 | LSMC | −57 | −9 | 33 | 0.63 | 0.89 (0.33) | 4.36 (1.5×10⁻⁴)* |
| RSMC | 60 | −9 | 33 | |||||
| Extrastriate | IC3 | LMOG | −33 | −90 | 9 | 1.1 | 0.82 (0.39) | −3.94 (4.7×10⁻⁴)* |
| RMOG | 33 | −87 | 15 | |||||
The ROIs were defined by the peak regions of each independent component in a large-scale ICA (Biswal et al., 2010). The Fisher's z-scores of PET were calculated from intersubject correlation of PET ROIs. The mean Fisther's z-scores of fMRI were calculated from correlations of resting-state BOLD time series.
Statistically significant at p<0.05.
BOLD, blood oxygen level dependent; fMRI, functional magnetic resonance imaging; ICA, independent component analysis; MPFC, medial prefrontal cortex; MNI, Montreal Neurological Institute; PCC, posterior cingulate cortex; ROI, region of interest; IPL, inferior parietal lobule; SMC, sensorimotor cortex; MOG, middle occipital gyrus; SFG, superior frontal gyrus; IFG, inferior frontal gyrus; R, right; L, left.
For the PET data, the intersubject correlations between the two ROIs in each network were calculated, and transformed into Fisher's z-score. For the fMRI data, after the time courses were extracted from the ROIs, the following preprocessing steps were used. First, the six rigid-body motion parameters and the first eigenvector of white matter and cerebrospinal fluid were regressed out using linear regression. Second, all the time courses were temporally filtered using a band-pass filtering of 0.01–0.1 Hz. The correlations of fMRI time series between the two ROIs in each network were first calculated for each subject, and transformed into z-score using Fisher's transformation. Then, the means and standard deviations of the z-scores were calculated across subjects. One-sample t-tests were conducted on the subject's Fisher's z-scores of fMRI time-series correlations against the corresponding z-score of intersubject PET correlation (not 0 as usually used). This test gives statistical inference on whether the mean fMRI time-series correlation is different from the intersubject PET correlation.
The effects of anatomical variances
One possible confounding variable of the PET ICA and intersubject correlation analysis is the partial volume effect. Because of the low spatial resolution of the PET images, the signals of the PET image might be affected by the underlying proportion of gray matter. Consequently, the covariance of the PET signals might be due to the variance of the underlying gray matter structure, but not metabolic signals per se. To rule out this possibility, the gray matter volume (GMV) image of each subject was obtained to control the partial volume effect. The GMV images were calculated from the segmentation of each subject's MPRAGE images. All of the GMV images were smoothed using a Gaussian kernel of 6-mm FWHM.
Two types of GMV information might affect PET connectivity analysis, within-subject spatial variance and intersubject variance. For the ICA, the question is whether the spatial covariance of PET signals is due to the underlying spatial variance of GMV. Thus, we used a spatial regression for each subject to regress out spatial GMV variance from the PET images (a similar method has been used in fMRI experiments, Di et al., 2012). After removing GMV information, the PET images were entered into the ICA procedure. Twenty components were extracted. The resulting IC maps were visually compared to the IC maps before GMV removal to verify whether the removal of GMV information would affect the PET ICA results. For the intersubject correlation of the PET signals, the high correlations might also due to high intersubject correlation of GMV. To rule out this possibility, the correlations between the PET signals and GMV for each ROI were calculated. Then, the GMV variances were regressed out from the PET signals using linear regression. PET correlations before and after removing GMV effects were calculated.
Results
Spatial ICA
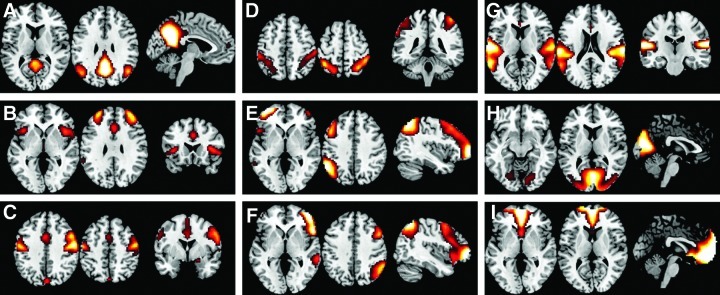
Among the 20 PET ICs, 10 were identified as meaningful network components (shown in the left two columns of Fig. 1). These included the primary visual network (Fig. 1D), higher visual network (Fig. 1F), motor network (Fig. 1C), salience network (Fig. 1B), orbital frontotemporopolar network (Fig. 1H), cerebellar network (Fig. 1G), and subcortical networks (Fig. 1I, J). The other two interesting networks are shown in Figure 1E and A. The network (Fig. 1E) comprised the right inferior parietal lobule, superior temporal gyrus, and lateral prefrontal cortex. This network resembles the right frontoparietal network as generally revealed in the BOLD ICA studies (Cole et al., 2010). The network (Fig. 1A) covered the midline regions of the cingulate regions and extended bilaterally into parietal lobule. The posterior portion of the cingulate cluster and bilateral parietal lobule overlapped with the DMN, but the cingulate cluster extended more anterior covering the whole cingulate cortex. Most importantly, the anterior part of the DMN, the medial prefrontal cortex (MPFC), was not present in this IC. Other 10 components were classified as noise (see Supplementary Fig. S1; Supplementary Data are available online at www.liebertpub.com/brain). Additional analysis showed that the ICA results of the PET images were not affected by the removal of GMV information from the PET images (see Supplementary Methods, Results, and Supplementary Fig. S2).
FIG. 1.

Metabolic network maps as revealed by spatial-independent component analysis (ICA) on the PET data. (A–J) display the 10 IC maps classified as meaningful network when 20 ICs were extracted. (K–O) illustrates additional 5 IC maps when 40 ICs were extracted. Each individual IC map was z-transformed and thresholded at z>1.96.
When extracting 40 components, additional networks could be identified, and they mostly still conveyed left–right homotopy. Some new components are illustrated in the right column of Figure 1. The new networks included the dorsal attention network (Fig. 1L), frontal polar network (Fig. 1O), and the auditory network (Fig. 1M). The networks (Fig. 1K, N) seemed to be parts of the DMN, but the MPFC was still not part of either component.
In contrast to the PET ICA results, the ICA of resting-state BOLD images of an independent old-subject group showed very similar network patterns as generally revealed by BOLD ICA. All the typical networks in Cole et al. (2010) could be identified in the resting-state BOLD image ICA (Fig. 2).
FIG. 2.
Resting-state network maps (A–I) as revealed by spatial ICA on the blood oxygen level-dependent (BOLD) data. Twenty components were extracted. Each individual IC map was z-transformed and thresholded at z>1.96.
ROI-based connectivity analysis
The correlation matrices of 14 ROIs for the PET and fMRI datasets are illustrated in Figure 3. The subsequent ROI analysis focused on the correlations between the two ROIs within each network (Fig. 4 and Table 1). For all of the BOLD time-series connectivity within the known networks, the correlations were >0.54 (Fisher's z=0.60) and were all statistically significant against zero. For the PET intersubject correlations, all the homotopic correlations were also very high (Fisher's z was always >0.60) and statistically significant. However, little or small connectivity was also observed between the MPFC and posterior cingulate cortex (PCC) (Fisher's z=0.070, p=0.39), between the left superior frontal gyrus (LSFG) and LIPL_Ex (Fisher's z=0.36, p=1.3×10⁻⁵), and between the right SFG (RSFG) and RIPL_Ex (Fisher's z=0.49, p=2.6×10⁻⁹). The comparison of mean fMRI time-series correlation against corresponding intersubject PET correlation revealed greater fMRI correlation than PET between the MPFC and PCC of the DMN [t(29)=9.51, p=2.0×10⁻¹⁰], between the LSFG and LIPL_Ex of left executive network [t(29)=7.31, p=4.7×10⁻⁸], and between the left sensorimotor cortex (LSMC) and right SMC (RSMC) of the sensorimotor network [t(29)=4.36, p=1.5×10⁻⁴]. Smaller fMRI time-series correlation compared with intersubject PET correlation was also observed between the left middle occipital gyrus (LMOG) and right MOG (RMOG) of the extrastriate visual network [t(29)=−3.94, p=4.7×10⁻⁴].
FIG. 3.

Correlation matrices of 14 region of interests for the PET (A) and functional magnetic resonance imaging (fMRI) (B) datasets. (A) Intersubject correlation matrix of PET metabolism. (B) Mean resting-state BOLD time-series correlation matrix across subjects.
FIG. 4.

Correlations between two main nodes within each network as revealed by both resting-state BOLD data and PET data. For the BOLD data, the bars and error bars represent group mean and standard deviation of Fisher's z-scores corresponding to correlations of BOLD time series. For the PET data, the bars represent the Fisher's z-scores of intersubject PET correlations. *Statistically significant difference at p<0.05.
A subsequent analysis showed that regressing out intersubject GMV variances from the PET signals had very little effects on the intersubject PET covariances (see Supplementary Results and Supplementary Fig. S3).
Discussion
Using spatial ICA and ROI-based connectivity analysis, the present study provides preliminary demonstration that the covariances of the brain metabolisms could convey similar neural networks as shown in resting-state BOLD images analyses (mostly the homotopic networks). Discrepancies were also observed in terms of the absence of anterior–posterior networks, including the DMN and left frontoparietal network.
Metabolic networks
The ICA of metabolic images demonstrated the presence of several networks that are similar to the networks identified using resting-state BOLD ICA. These networks include unimodal sensory or motor networks such as the striate visual cortex (Fig. 1D), extrastriate visual cortex (Fig. 1F), auditory cortex (Fig. 1M), motor cortex (Fig. 1C), and other networks, including the cerebellum (Fig. 1G), salience (Fig. 1B), and subcortical network, including the caudate, putamen, and thalamus (Fig. 1I). The presence of these networks suggests that the functionally related regions also have similar variances of metabolisms across the subject, and the metabolic signals can, to some extent, reflect the underlying neural architecture of these networks. These networks are generally left–right symmetric, which is in line with the earlier observations that homotopic regions have high correlations of metabolisms (Horwitz et al., 1984). Another component of the orbital frontotemporopolar network (Fig. 1H) is not usually reported in resting-state BOLD ICA, but has been reported in a study using cluster analysis (Yeo et al., 2011). As has been pointed out by Yeo et al. (2011), the BOLD images have severe signal dropout and spatial distortion in the orbitofrontal cortex and anterior temporal cortex, so the connectivity in this network might not be reliably detected using BOLD images.
The discrepancies between PET covariance networks and resting-state BOLD networks are observed mainly in the networks containing anterior–posterior large-scale connectivity, including the DMN and left frontoparietal network. Not only absent in the ICA, the correlations between two main nodes of each networks are also reduced compared with BOLD time-series correlations. The impaired covariance of the DMN and left frontoparietal network are not due to aging effects, because a separate analysis of a resting-state BOLD data with matched age sample can show typical DMN and left frontoparietal network with a small cluster located in the MPFC (Fig. 2A). The existence of the resting-state DMN in old individuals has also been consistently shown by previous studies (e.g., Greicius et al., 2004; Koch et al., 2010). The DMN and frontoparietal network can be reliably detected by resting-state fMRI connectivity analysis (Biswal et al., 2010; Zuo et al., 2010), and are supported by the underlying white matter fiber tracts (Greicius et al., 2009; van den Heuvel et al., 2008, 2009). These suggest that the impairments of covariance in the DMN and left frontoparietal network are specific to the metabolism level, and are independent of neural wiring and underlying white matter connections.
One possible explanation of this dissociation is that the current study analyzed the static properties of the brain metabolic activity. Whether the static metabolic activity is associated with the dynamic neurometabolic coupling is largely unknown. However, a study using CMRO2 measures has found correlations of CMRO2 time series between the MPFC and PCC (Wu et al., 2009). Thus, the absence of intersubject MPFC-PCC covariance found in the present might only reflect the decoupling of the static metabolic properties between these two regions, but not the dynamic ongoing fluctuations of oxygen metabolisms. Second, this discrepancy might reflect the inter-regional coupling in different temporal scales, ranging from seconds of the fMRI images to minutes of the PET images. It might be worse for the DMN, because the DMN maintained high activity during the resting-state. The cumulative effects of mind wandering in several minutes might increase the variances of the DMN metabolism; thus, the correlation of cumulative metabolisms of the MPFC and PCC would be hard to observe. In contrast, the BOLD times series might reflect ongoing fluctuations of mind wandering in seconds, and the synchronization within the DMN would be easy to observe. Third, this difference might be due to different environment noise, because the PET scanner is quiet when scanning as compared with MRI scanner. However, the long-range connectivity such as frontoparietal connectivity and MPFC-PCC connectivity observed in resting-state fMRI cannot purely due to scanner noise, because similar long-range connectivity can also be observed using other quiet methods such as electroencephalography (Musso et al., 2010) and magnetoencephalography (Brookes et al., 2011).
From structural to functional covariance networks
The commonly used BOLD contrast indirectly reflects the neural activity, which is mediated by regional tissue characteristics, metabolism, and CBF/CBV. These mediation factors may reflect underlying neural network architectures or shape the observed BOLD networks. Thus, systematically investigating the covariant networks of GMV, metabolism and CBF/CBV might solidify the foundation of networks usually observed in resting-state BOLD studies. There is an increasing interest to study the brain networks using different imaging modalities, including gray matter structures (He et al., 2007; Mechelli et al., 2005; Zielinski et al., 2010), metabolisms as revealed by PET (Lee et al., 2008; Zuendorf et al., 2003) and CMRO2 (Wu et al., 2009), CBF as revealed by PET (Friston et al., 1993; McIntosh et al., 1994; Young et al., 2003) and arterial spin labeling (Biswal et al., 1997; Viviani et al., 2011; Zou et al., 2009), CBV (Magnuson et al, 2010) (in rat brain), and amplitude of low-frequency fluctuation (ALFF) during resting state (Taylor et al., 2012; Zhang et al., 2011). The different measures of brain connectivity might reflect common infrastructure of human brain networks. However, due to the different properties measured by different imaging modalities, the network structures revealed might show slightly different patterns.
The main properties of gray matter volumetric covariance were high homotopic correlations (Mechelli et al., 2005; Zielinski et al., 2010). Similar to the current metabolism connectivity analysis, the anterior–posterior covariances within the DMN and frontoparietal network are also not evident (Mechelli et al., 2005; Zielinski et al., 2010). Interestingly, however, current analyses show that the individual differences of GMV have only none or small correlations with regional metabolisms. These suggest that the variances of GMVs and metabolisms are dissociated in the individual differences, but that they independently reflect the same underlying brain network structures. Whether the spatial distribution of correlation maps is different for the GMV and metabolism needs to be clarified in future studies.
In contrast to GMV and metabolism, analyses of intersubject covariance of ALFF can show similar networks of the DMN and task-positive networks (including frontoparietal connectivity) as regular resting-state fMRI studies (Zhang et al., 2011). It is noteworthy that the ALFF reflects the BOLD fluctuations over a period of time that has the same temporal scale as the current PET data. The different connectivity patterns in the DMN suggest that the ALFF parameter might be closer to the brain network architectures, whereas the FDG-PET values might convey lower-level properties that can only partially reflect the brain network architectures.
According to the economy principle of brain network organization, network wiring (anatomical connections) and running (metabolisms) are expensive (Bullmore and Sporns, 2012), especially for long-range connections. Some long-range functional connectivity might only occur in real-time neural coupling, but might not be reflected in the intersubject metabolic or structural correlations. We propose that systematically analyzing structural, metabolic, and ongoing fMRI connectivity on the same sample of subjects will help to test the economy principle of brain connectivity. Moreover, these covariance networks might convey a hierarchy of brain covariance properties from regional GMV to regional metabolism to regional fluctuations, with different levels of local and global network efficiencies.
Currently, only GMV, metabolism, and ALFF covariant networks have been studied, while other levels such as CBF and CBV covariances have not been examined. Systematically investigating the CBF/CBV covariances in addition to the existing covariance will complete the link from brain structure covariances to neural covariances. In addition, systematically comparing the differences between static covariance and dynamic connectivity in different levels will enrich our knowledge on how the brain is organized in different temporal scales.
Supplementary Material
Contributor Information
Collaborators: Alzheimer's Disease Neuroimaging Initiative
Acknowledgments
The authors wish to thank Dr. Paul Taylor for his helpful comments on a early version of this manuscript. This study was supported by the National Institute of Health grants 5R01AG032088. Data collection and sharing for this project were also funded by the Alzheimer's Disease Neuroimaging Initiative (ADNI; National Institutes of Health Grant U01 AG024904). ADNI is funded by the NIA, the NIBIB, and through generous contributions from the following: Abbott; Alzheimer's Association; Alzheimer's Drug Discovery Foundation; Amorfix Life Sciences Ltd.; AstraZeneca; Bayer HealthCare; BioClinica, Inc.; Biogen Idec, Inc.; Bristol-Myers Squibb Company; Eisai, Inc.; Elan Pharmaceuticals, Inc.; Eli Lilly and Company; F. Hoffmann-La Roche Ltd., and its affiliated company Genentech, Inc.; GE Healthcare; Innogenetics, N.V.; Janssen Alzheimer Immunotherapy Research & Development, LLC.; Johnson & Johnson Pharmaceutical Research & Development LLC.; Medpace, Inc.; Merck & Co., Inc.; Meso Scale Diagnostics, LLC.; Novartis Pharmaceuticals Corporation; Pfizer, Inc.; Servier; Synarc, Inc.; and Takeda Pharmaceutical Company. The Canadian Institutes of Health Research is providing funds to support ADNI clinical sites in Canada. Private sector contributions are facilitated by the Foundation for the National Institutes of Health (www.fnih.org). The grantee organization is the Northern California Institute for Research and Education, and the study is coordinated by the Rev August 16, 2011 Alzheimer's Disease Cooperative Study at the University of California, San Diego. ADNI data are disseminated by the Laboratory for Neuroimaging at the University of California, Los Angeles. This research was also supported by the NIH grants P30 AG010129 and K01 AG030514, and the Dana Foundation.
Author Disclosure Statement
No competing financial interests exist.
References
- Beckmann CF. DeLuca M. Devlin JT. Smith SM. Investigations into resting-state connectivity using independent component analysis. Philos Trans R Soc Lond B Biol Sci. 2005;360:1001–1013. doi: 10.1098/rstb.2005.1634. [DOI] [PMC free article] [PubMed] [Google Scholar]
- Biswal B. Yetkin FZ. Haughton VM. Hyde JS. Functional connectivity in the motor cortex of resting human brain using echo-planar MRI. Magn Reson Med. 1995;34:537–541. doi: 10.1002/mrm.1910340409. [DOI] [PubMed] [Google Scholar]
- Biswal BB. Mennes M. Zuo XN. Gohel S. Kelly C. Smith SM, et al. Toward discovery science of human brain function. Proc Natl Acad Sci U S A. 2010;107:4734–4739. doi: 10.1073/pnas.0911855107. [DOI] [PMC free article] [PubMed] [Google Scholar]
- Biswal BB. Van Kylen J. Hyde JS. Simultaneous assessment of flow and BOLD signals in resting-state functional connectivity maps. NMR Biomed. 1997;10:165–170. doi: 10.1002/(sici)1099-1492(199706/08)10:4/5<165::aid-nbm454>3.0.co;2-7. [DOI] [PubMed] [Google Scholar]
- Brookes MJ. Woolrich M. Luckhoo H. Price D. Hale JR. Stephenson MC. Barnes GR. Smith SM. Morris PG. Investigating the electrophysiological basis of resting state networks using magnetoencephalography. Proc Natl Acad Sci U S A. 2011;108:16783–16788. doi: 10.1073/pnas.1112685108. [DOI] [PMC free article] [PubMed] [Google Scholar]
- Bullmore E. Sporns O. The economy of brain network organization. Nat Rev Neurosci. 2012;13:336–349. doi: 10.1038/nrn3214. [DOI] [PubMed] [Google Scholar]
- Buxton RB. Wong EC. Frank LR. Dynamics of blood flow and oxygenation changes during brain activation: the balloon model. Magn Reson Med. 1998;39:855–864. doi: 10.1002/mrm.1910390602. [DOI] [PubMed] [Google Scholar]
- Calhoun VD. Adali T. Pearlson GD. Pekar JJ. A method for making group inferences from functional MRI data using independent component analysis. Hum Brain Mapp. 2001;14:140–151. doi: 10.1002/hbm.1048. [DOI] [PMC free article] [PubMed] [Google Scholar]
- Cole DM. Smith SM. Beckmann CF. Advances and pitfalls in the analysis and interpretation of resting-state FMRI data. Front Syst Neurosci. 2010;4:8. doi: 10.3389/fnsys.2010.00008. [DOI] [PMC free article] [PubMed] [Google Scholar]
- Di X. Kannurpatti SS. Rypma B. Biswal BB. Calibrating BOLD fMRI Activations with Neurovascular and Anatomical Constraints. Cereb Cortex. 2012 doi: 10.1093/cercor/bhs001. [Epub ahead of print] [DOI] [PMC free article] [PubMed] [Google Scholar]
- Doucet G. Naveau M. Petit L. Delcroix N. Zago L. Crivello F, et al. Brain activity at rest: a multiscale hierarchical functional organization. J Neurophysiol. 2011;105:2753–2763. doi: 10.1152/jn.00895.2010. [DOI] [PubMed] [Google Scholar]
- Fox MD. Snyder AZ. Vincent JL. Corbetta M. Van Essen DC. Raichle ME. The human brain is intrinsically organized into dynamic, anticorrelated functional networks. Proc Natl Acad Sci U S A. 2005;102:9673–9678. doi: 10.1073/pnas.0504136102. [DOI] [PMC free article] [PubMed] [Google Scholar]
- Friston KJ. Frith CD. Liddle PF. Frackowiak RS. Functional connectivity: the principal-component analysis of large (PET) data sets. J Cereb Blood Flow Metab. 1993;13:5–14. doi: 10.1038/jcbfm.1993.4. [DOI] [PubMed] [Google Scholar]
- Golland Y. Golland P. Bentin S. Malach R. Data-driven clustering reveals a fundamental subdivision of the human cortex into two global systems. Neuropsychologia. 2008;46:540–553. doi: 10.1016/j.neuropsychologia.2007.10.003. [DOI] [PMC free article] [PubMed] [Google Scholar]
- Greicius MD. Srivastava G. Reiss AL. Menon V. Default-mode network activity distinguishes Alzheimer's disease from healthy aging: evidence from functional MRI. Proc Natl Acad Sci U S A. 2004;101:4637–4642. doi: 10.1073/pnas.0308627101. [DOI] [PMC free article] [PubMed] [Google Scholar]
- Greicius MD. Supekar K. Menon V. Dougherty RF. Resting-state functional connectivity reflects structural connectivity in the default mode network. Cereb Cortex. 2009;19:72–78. doi: 10.1093/cercor/bhn059. [DOI] [PMC free article] [PubMed] [Google Scholar]
- He Y. Chen ZJ. Evans AC. Small-world anatomical networks in the human brain revealed by cortical thickness from MRI. Cereb Cortex. 2007;17:2407–2419. doi: 10.1093/cercor/bhl149. [DOI] [PubMed] [Google Scholar]
- Horwitz B. Duara R. Rapoport SI. Intercorrelations of glucose metabolic rates between brain regions: application to healthy males in a state of reduced sensory input. J Cereb Blood Flow Metab. 1984;4:484–499. doi: 10.1038/jcbfm.1984.73. [DOI] [PubMed] [Google Scholar]
- Koch W. Teipel S. Mueller S. Buerger K. Bokde AL. Hampel H. Coates U. Reiser M. Meindl T. Effects of aging on default mode network activity in resting state fMRI: does the method of analysis matter? Neuroimage. 2010;51:280–287. doi: 10.1016/j.neuroimage.2009.12.008. [DOI] [PubMed] [Google Scholar]
- Lee DS. Kang H. Kim H. Park H. Oh JS. Lee JS, et al. Metabolic connectivity by interregional correlation analysis using statistical parametric mapping (SPM) and FDG brain PET; methodological development and patterns of metabolic connectivity in adults. Eur J Nucl Med Mol Imaging. 2008;35:1681–1691. doi: 10.1007/s00259-008-0808-z. [DOI] [PubMed] [Google Scholar]
- Magnuson M. Majeed W. Keilholz SD. Functional connectivity in blood oxygenation level-dependent and cerebral blood volume-weighted resting state functional magnetic resonance imaging in the rat brain. J Magn Reson Imaging. 2010;32:584–592. doi: 10.1002/jmri.22295. [DOI] [PMC free article] [PubMed] [Google Scholar]
- McIntosh AR. Grady CL. Ungerleider LG. Haxby JV. Rapoport SI. Horwitz B. Network analysis of cortical visual pathways mapped with PET. J Neurosci. 1994;14:655–666. doi: 10.1523/JNEUROSCI.14-02-00655.1994. [DOI] [PMC free article] [PubMed] [Google Scholar]
- Mechelli A. Friston KJ. Frackowiak RS. Price CJ. Structural covariance in the human cortex. J Neurosci. 2005;25:8303–8310. doi: 10.1523/JNEUROSCI.0357-05.2005. [DOI] [PMC free article] [PubMed] [Google Scholar]
- Musso F. Brinkmeyer J. Mobascher A. Warbrick T. Winterer G. Spontaneous brain activity and EEG microstates. A novel EEG/fMRI analysis approach to explore resting-state networks. Neuroimage. 2010;52:1149–1161. doi: 10.1016/j.neuroimage.2010.01.093. [DOI] [PubMed] [Google Scholar]
- Park HJ. Kim JJ. Youn T. Lee DS. Lee MC. Kwon JS. Independent component model for cognitive functions of multiple subjects using [15O]H2O PET images. Hum Brain Mapp. 2003;18:284–295. doi: 10.1002/hbm.10085. [DOI] [PMC free article] [PubMed] [Google Scholar]
- Raichle ME. Circulatory and metabolic correlates of brain function in normal humans. In: Mountcastle VB, editor; Plum F, editor; Geiger SR, editor. Handbook of physiology—the nervous system. Bethesda: American Physiological Society; 1987. pp. 643–674. [Google Scholar]
- Taylor P. Gohel SR. Di X. Walter M. Biswal BB. Functional covariance networks: obtaining resting state networks from intersubject variability. Brain Connect. 2012;2:203–217. doi: 10.1089/brain.2012.0095. [DOI] [PMC free article] [PubMed] [Google Scholar]
- van den Heuvel M. Mandl R. Luigjes J. Hulshoff Pol H. Microstructural organization of the cingulum tract and the level of default mode functional connectivity. J Neurosci. 2008;28:10844–10851. doi: 10.1523/JNEUROSCI.2964-08.2008. [DOI] [PMC free article] [PubMed] [Google Scholar]
- van den Heuvel MP. Mandl RC. Kahn RS. Hulshoff Pol HE. Functionally linked resting-state networks reflect the underlying structural connectivity architecture of the human brain. Hum Brain Mapp. 2009;30:3127–3141. doi: 10.1002/hbm.20737. [DOI] [PMC free article] [PubMed] [Google Scholar]
- Viviani R. Messina I. Walter M. Resting state functional connectivity in perfusion imaging: correlation maps with BOLD connectivity and resting state perfusion. PLoS One. 2011;6:e27050. doi: 10.1371/journal.pone.0027050. [DOI] [PMC free article] [PubMed] [Google Scholar]
- Wu CW. Gu H. Lu H. Stein EA. Chen JH. Yang Y. Mapping functional connectivity based on synchronized CMRO2 fluctuations during the resting state. Neuroimage. 2009;45:694–701. doi: 10.1016/j.neuroimage.2008.12.066. [DOI] [PMC free article] [PubMed] [Google Scholar]
- Yeo BT. Krienen FM. Sepulcre J. Sabuncu MR. Lashkari D. Hollinshead M, et al. The organization of the human cerebral cortex estimated by intrinsic functional connectivity. J Neurophysiol. 2011;106:1125–1165. doi: 10.1152/jn.00338.2011. [DOI] [PMC free article] [PubMed] [Google Scholar]
- Young JP. Geyer S. Grefkes C. Amunts K. Morosan P. Zilles K, et al. Regional cerebral blood flow correlations of somatosensory areas 3a, 3b, 1, and 2 in humans during rest: a PET and cytoarchitectural study. Hum Brain Mapp. 2003;19:183–196. doi: 10.1002/hbm.10114. [DOI] [PMC free article] [PubMed] [Google Scholar]
- Zhang Z. Liao W. Zuo X-N. Wang Z. Yuan C. Jiao Q, et al. Resting-state brain organization revealed by functional covariance networks. PLoS One. 2011;6:e28817. doi: 10.1371/journal.pone.0028817. [DOI] [PMC free article] [PubMed] [Google Scholar]
- Zielinski BA. Gennatas ED. Zhou J. Seeley WW. Network-level structural covariance in the developing brain. Proc Natl Acad Sci U S A. 2010;107:18191–18196. doi: 10.1073/pnas.1003109107. [DOI] [PMC free article] [PubMed] [Google Scholar]
- Zou Q. Wu CW. Stein EA. Zang Y. Yang Y. Static and dynamic characteristics of cerebral blood flow during the resting state. Neuroimage. 2009;48:515–524. doi: 10.1016/j.neuroimage.2009.07.006. [DOI] [PMC free article] [PubMed] [Google Scholar]
- Zuendorf G. Kerrouche N. Herholz K. Baron JC. Efficient principal component analysis for multivariate 3D voxel-based mapping of brain functional imaging data sets as applied to FDG-PET and normal aging. Hum Brain Mapp. 2003;18:13–21. doi: 10.1002/hbm.10069. [DOI] [PMC free article] [PubMed] [Google Scholar]
- Zuo XN. Kelly C. Adelstein JS. Klein DF. Castellanos FX. Milham MP. Reliable intrinsic connectivity networks: test-retest evaluation using ICA and dual regression approach. Neuroimage. 2010;49:2163–2177. doi: 10.1016/j.neuroimage.2009.10.080. [DOI] [PMC free article] [PubMed] [Google Scholar]
Associated Data
This section collects any data citations, data availability statements, or supplementary materials included in this article.