

Abstract
For studying the microbiota of four Danish surface-ripened cheeses produced at three farmhouses and one industrial dairy, both a culture-dependent and culture-independent approach were used. After dereplication of the initial set of 433 isolates by (GTG)5-PCR fingerprinting, 217 bacterial and 25 yeast isolates were identified by sequencing of the 16S rRNA gene or the D1/D2 domain of the 26S rRNA gene, respectively. At the end of ripening, the cheese core microbiota of the farmhouse cheeses consisted of the mesophilic lactic acid bacteria (LAB) starter cultures Lactococcus lactis subsp. lactis and Leuconostoc mesenteorides as well as non-starter LAB including different Lactobacillus spp. The cheese from the industrial dairy was almost exclusively dominated by Lb. paracasei. The surface bacterial microbiota of all four cheeses were dominated by Corynebacterium spp. and/or Brachybacterium spp. Brevibacterium spp. was found to be subdominant compared to other bacteria on the farmhouse cheeses, and no Brevibacterium spp. was found on the cheese from the industrial dairy, even though B. linens was used as surface-ripening culture. Moreover, Gram-negative bacteria identified as Alcalignes faecalis and Proteus vulgaris were found on one of the farmhouse cheeses. The surface yeast microbiota consisted primarily of one dominating species for each cheese. For the farmhouse cheeses, the dominant yeast species were Yarrowia lipolytica, Geotrichum spp. and Debaryomyces hansenii, respectively, and for the cheese from the industrial dairy, D. hansenii was the dominant yeast species. Additionally, denaturing gradient gel electrophoresis (DGGE) analysis revealed that Streptococcus thermophilus was present in the farmhouse raw milk cheese analysed in this study. Furthermore, DGGE bands corresponding to Vagococcus carniphilus, Psychrobacter spp. and Lb. curvatus on the cheese surfaces indicated that these bacterial species may play a role in cheese ripening.
Introduction
Cheeses harbour a complex microbiota characterised by a succession of different microorganisms during milk coagulation and ripening [24]. During cheese ripening, lactic acid bacteria (LAB) starter cultures (e.g., mesophilic Lactocococcus lactis or thermophilic Streptococcus thermophilus) metabolise residual lactose and citrate to different aroma compounds [17]. Later, LAB starter numbers decrease with cell death and their subsequent lysis results in release of intracellular peptidases involved in proteolysis of peptides to free amino acids [8, 31, 54]. Several free amino acids are flavour compounds themselves, but more important free amino acids are precursors of other cheese flavour compounds including ammonia, carbonyl and sulphur compounds. Non-starter LAB (homo- and heterofermentative lactobacilli and pediococci) either present as indigenous milk microorganisms, contaminants or added as ripening cultures will grow during ripening and in most cases enhance flavour intensity [12].
Surface-ripened cheeses are characterised by an additional ripening from the cheese surface to the interior due to the activity of both yeasts and bacteria on the cheese surface [7]. During the initial ripening period, yeasts (primarily Debaryomyces hansenii for semi-soft cheeses and additionally Geotrichum candidum for soft cheeses) and coagulase-negative staphylococci (Staphylococcus equorum) are present [3, 21, 26]. Generally, D. hansenii and staphylococci on cheese surface are assumed to originate from the cheese brine, which often is not changed or pasteurised between salting of different batches [2, 3, 42]. For D. hansenii, Petersen et al. [46] showed that the dominating D. hansenii strain on cheeses of the Danish Danbo type did not originate from the added ripening culture, but from the dairy housemicrobiota present in the ripening room. D. hansenii is important during cheese ripening as it assimilates lactate and produces alkaline metabolites such as ammonia thereby increasing pH of the cheese surface [23, 46], which enables the growth of the less acid tolerant bacterial microbiota, primarily Gram-positive coryneforms (Brevibacterium spp., Corynebacterium spp. and Microbacterium spp.) [4]. In addition, subpopulations of bacteria such as Gram-positive Marinilactibacillus spp. and Gram-negative Halomonas spp., Vibrio spp. and Proteus spp., and bacteria of the Enterobacteriaceae family have been reported to occur on cheese surfaces [14, 15, 25, 34, 35, 41, 50]. The presence of Gram-negative bacteria was first hypothesised to be indicative of hygienic problems. However, more recent results have shown that they produce important cheese flavour compounds and thus might contribute positively to the cheese ripening process [11]. Several studies have characterised the cheese microbiota by both culture-dependent methods and -independent methods [43]. Following culture isolation, identification has been based on either macro- and micromorphological examinations and by genotypic identification based on DNA restriction, amplification and sequencing. Furthermore, many culture independent methods, e.g., denaturing gradient gel electrophoresis (DGGE) have been used to study microbial diversity in cheeses [27]. Most recently one study has included the pyrosequencing technique for identification of cheese microbiota [38].
During the last decade, increasing interest in high-quality cheeses produced at Danish farmhouses has resulted in an increasing number of Danish farmhouses producing a large variety of cheeses, of which many are surface-ripened. Contrary to the microbiota of, in particular, German and French surface-ripened cheese varieties, the microbiota of Danish surface-ripened cheeses have only been investigated to a limited extent [37, 38, 46].
The aim of the present study was to investigate the microbiota of three surface-ripened cheeses produced at three individual Danish farmhouses and one surface-ripened cheese produced at one Danish industrial dairy. Investigations of the cheese microbiota composition are highly relevant, as the cheese microbiota together with rennet and indigenous milk enzymes plays an important role for both the flavour (aroma and taste) and textural properties of the final product. To our knowledge, this is the first study, which simultaneously identified the cheese microbiota including both bacteria and yeasts in samples taken separately from the cheese interior and surface by both culture-dependent and -independent approaches.
Materials and Methods
Cheese Manufacture
The present study was conducted on three surface-ripened cheeses produced at three individual Danish farmhouses (dairies A, B and C) and one surface-ripened cheese produced at one Danish industrial dairy (dairy D). Cheeses from dairy A and C were of the Havarti type, whereas cheeses from dairy B and D were of the Danbo type). All cheeses were made with mesophilic LAB starters, and except for the cheese from dairy A made of pasteurized milk. After brining, cheeses from dairies A, C and D were smeared with Brevibacterium linens, whereas no commercial ripening cultures were used for the cheese from Dairy B.
Sampling and Isolation of Microbiota
For the cheeses from dairies A and C, sampling took place at the end of ripening, which for both cheeses was 12 weeks, whereas for the cheeses from dairy B and D, sampling took place prior to the washing and paraffin treatment, which was after 6 weeks of ripening. One sample from each cheese was analysed. Ten grams of cheese from the surface (depth ~ 4 mm) and the interior, respectively, was removed using a sterile scalpel, and 2 % (w/v) trisodium citrate was added to yield a 1:10 dilution in stomacher bag. The mixture was homogenized using a Stomacher for 2 min at medium speed. From this dilution, 10-fold dilutions were prepared in 0.9 % (w/v) NaCl. The interior bacterial microbiota was enumerated on M17 with 1.0 % glucose (GM17) incubated for 3–4 days aerobically at 30 °C and 37 °C, respectively, and on MRS (pH 6.2 and 5.4) incubated for 3–4 days anaerobically at 30 °C and 37 °C, respectively. The surface bacterial microbiota was enumerated on tryptic soya agar (TSA) with 0.0 % and 4.0 % (w/v) NaCl, respectively, incubated for 10–12 days aerobically at 30 °C. All media for bacterial enumeration were added 0.2 % (w/v) sorbic acid (Merck) and 0.1 % (w/v) cycloheximide (Merck) to suppress growth of moulds and yeasts. The interior and surface yeast microbiota was enumerated on Malt Yeast Glucose Peptone (MYGP) agar composed of 3.0 g of malt extract (Difco), 3.0 g yeast extract (Difco), 10 g of glucose (Merck), 5.0 g Bactopeptone (Difco) and 15 g of agar (Difco) per litre of distilled water, pH 5.6, incubated for 5–8 days aerobically at 25 °C. MYGP was added 100 mg/l chloramphenicol and 50 mg/ml chlortetracycline (Sigma, St. Louis, MO, USA) to suppress bacterial growth. Twenty to forty bacterial and yeast colonies were selected from countable plates and were purified by re-streaking twice on the appropriate media. For long-term storage, purified isolates were stored at −80°C in appropriate media containing 20 % (w/v) glycerol.
Chemical Analyses
Moisture and salt contents were determined by standard methods [32, 51]. Water activities (a w) of grated cheese samples were measured using a Aqualab CX-2 (Decagon Devices, USA). Measurements of pH were performed by placing a surface electrode (Inlab 426, Mettler-Toledo, Glostrup, Denmark) connected to a pH meter (1120, Mettler-Toledo) directly on the cheese samples. Calibration of the electrode was performed in buffers with pH 4.01 and 7.00 (Radiometer, Brønshøj, Denmark).
Repetitive Sequenced‐Based PCR (rep‐PCR)
Yeast and bacterial isolates were dereplicated using (GTG)5-PCR finger printing. Initially total DNA was extracted using InstaGene Matrix DNA extraction kit (Bio-Rad, Hercules, CA, USA) following the instructions of the manufacturer. Rep-PCR reaction was carried out in a 25-μl volume containing 1 U DreamTaqTM DNA polymerase (Fermentas, St. Leon-Rot, Germany), 2.5 μl 10 × DreamTaqTM Green Buffer containing 20 mM MgCl2 (Fermentas), 200 μM of each deoxynucleotide triphosphate (Fermentas), 0.8 μM of primer GTG5 (5′-GTG GTG GTG GTG GTG-3′) (DNA Technologies, Aarhus, Denmark), 1.5 μl of DNA template and sterile MilliQ water for adjustment of the volume to 25 μl. The PCR reaction was performed on a RoboCycler®Gradient 96 (Agilent Technologies, Santa Clara, CA, USA) using the following program: 5 min of initial denaturation at 94 °C, 30 cycles of 94 °C for 30 s, 45 °C for 60 s, 65 °C for 8 min followed by a final elongation step of 65 °C for 16 min and holding at 4 °C. The PCR products were separated by 1.5 % agarose gel electrophoresis in 1× TBE (90 mM Trizma base (Sigma), 90 mM Boric acid (Sigma), 2 mM EDTA (Merck, Darmstadt, Germany) pH8.0) (5 h, 140 V) using a Generuler 1 kb DNA ladder as reference (Fermentas). Following electrophoresis, gels were stained with ethidium bromide and photographed with UV transillumination (302 nm) using a Kodak EDAS 290 system (Eastman Kodak). Patterns were grouped based on the fraction of shared bands determined by Dice coefficient and clustering was calculated by the unweighted pair group algorithm with arithmetic averages (UPGMA).
Sequencing of 16S and 26S rRNA Genes
Bacterial isolates were identified by sequencing of the 16S rRNA gene using following primers: 7f (5′-AGAGTTTGAT(C/T)(A/C)TGGCTCAG-3′) and 1510r (5′-ACGG(C/T)TACCTTGTTACGACTT-3′). Yeast isolates were identified by sequencing of the 26S rRNA gene using the following primers: NL-1 (5′-GCATATCAATAAGCGGAGGAAAAG-3′) and NL-4 (5′-GGTCCGTGTTTCAAGACGG-3′). Reactions were performed in an automatic thermal cycler (GeneAmp®PCR System 9700, Perkin-Elmer) under the following conditions: Initial denaturation at 95 °C for 5 min; 35 cycles of 95 °C for 1 min, 52 °C for 45 s and 72 °C for 1 min; final extension at 72 °C for 7 min and holding at 4 °C. PCR products were sent to a commercial sequencing facility (Macrogene Korea). The primers 7f and 1510r or NL-1 and NL4 were used in the sequencing reactions, respectively. Sequences were manually corrected and assembled by use of the software CLC Main Workbench 6.0 (Aarhus, Denmark). Bacterial and yeast sequences were compared to the sequences reported in EzTaxon and GenBank, respectively, using the BLAST (Basic Local alignment Search Tool) algorithm. From each rep-PCR group, at least the square root of the number of isolates was sequenced. The nucleotide sequences determined in this study have been assigned Genbank Accession Nos. JQ680412–JQ680469.
DNA Extraction from Cheese Samples
Casein particles were removed from 40 ml of the 1:10 dilution by centrifugation (300×g for 10 min). The supernatant were transferred to a new tube, and cells were pelleted by centrifugation (5,000×g for 15 min) and washed once with 0.9 % (w/v) NaCl. DNA was extracted using GenElute™ Bacterial Genomic DNA Kit (NA2110; Sigma-Aldrich, St. Louis, MO, USA) following the instructions of the manufacturer.
Denaturing Gradient Gel Electrophoresis
The V3 region of the 16S rRNA gene was amplified using the universal bacterial primers PRBA338fGC/PRUN518r [45]. Furthermore, an approximately 250-bp-long fragment of D1/D2 region of the 26S rRNA gene was amplified using the eukaryotic universal primers NL1GC/LS2 [9, 29]. The reaction mixture was as described by Nielsen et al. [44], and the thermocycling conditions as described in previous reports [45, 55]. The DGGE analysis was performed using the INGENY phorU (Ingeny International BV, the Netherlands). Polyacrylamide gels (8 % (wt/vol) acrylamide–bisacrylamide (37.5:1); Bio-Rad) in 1× TAE buffer (40 mM trizma base (Sigma), 20 mM acetic acid (Merck), 1 mM EDTA (Merck) pH 8.0) were prepared with a Bio-Rad Gradient Delivery System (Model 475, Bio-Rad) using solutions containing from 35 to 70 % denaturant [100 % denaturant corresponds to 7 M urea (ICN Biomedicals, Aurora, USA) and 40 % (vol/vol) formamide (Merck)]. Gels were run at 60 °C for 16 h at a constant voltage of 120 V. After electrophoresis, gels were stained with SYBR-GOLD (Molecular Probes, Eugene, OR, USA) for 2 h with mild shaking and photographed with UV transillumination (302 nm) using a Kodak EDAS 290 system (Eastman Kodak). The identity of selected DGGE bands was revealed by sequencing. DNA fragments from selected bands excised from the gels, re-amplified, the electrophoretic mobility relative to the fragment from which they were excised, was checked. In case of several bands on the DGGE gel, the target bands were excised from the gel again and analyzed by DGGE until a single band was obtained. The fragments were sequenced by Macrogene Korea. The sequences were assembled by use of CLC Main Workbench 6.0 (CLC bio, Aarhus, Denmark) and compared to the sequences in the GenBank using BLAST (http://blast.ncbi.nlm.nih.gov, January/2011).
Statistical Analysis
To test whether there was a significant difference (95 % confidence level) between the cheese samples, a one-way ANOVA using Tukey HSD test was performed with JMP 8 (SAS Institute, Cary, NC, USA).
Results
Chemical Composition of the Cheeses
Table 1 shows the moisture content, NaCl content, NaCl-in-moisture contents, water activity (a w) and pH for three farmhouse cheeses and one industrial produced cheese. The moisture in the cheese core varied from 32 to 45 g/100 g cheese, whereas moisture on the cheese surfaces varied from 20 to 31 g/100 g cheese. The NaCl content ranged between 1.08 and 1.96 g/100 g cheese for interiors and between 0.93 and 1.40 g/100 g cheese for surfaces. For the individual cheeses, the NaCl-in-moisture content was significantly lower for interiors (3.03–4.65 % (w/v)) compared to surfaces (4.55–5.94 % (w/v)). The water activity (a w) of the interiors and surfaces varied between 0.824 and 0.876 but there were no significant difference. For all cheeses, core pH was significantly lower compared to surface pH. The core pH varied between 5.44 and 6.06, whereas surface pH varied between 6.44 and 7.28.
Table 1.
Relevant characteristics of the surface and interior of Danish surface-ripened cheeses
| Cheese | Moisture contenta | NaCl contenta | NaCl-in-moisture contenta | Water activitya | pHa |
|---|---|---|---|---|---|
| (g/100 g cheese) | (g/100 g cheese) | (%) | (a w) | ||
| Dairy A | |||||
| Core | 42 ± 0.23B | 1.96 ± 0.0021A | 4.65 ± 0.20B | 0.824 ± 0.0014D | 6.06 ± 0.070D |
| Surface | 22 ± 0.92E | 1.31 ± 0.0071CD | 5.94 ± 0.23A | 0.826 ± 0.0D | 6.44 ± 0.095C |
| Dairy B | |||||
| Core | 32 ± 0.49D | 1.08 ± 0.0E | 3.40 ± 0.053CD | 0.838 ± 0.0021CD | 5.74 ± 0.098E |
| Surface | 21 ± 0.23E | 1.24 ± 0.051D | 5.82 ± 0.30A | 0.852 ± 0.0021BC | 6.56 ± 0.076BC |
| Dairy C | |||||
| Core | 37 ± 0.60C | 1.40 ± 0.0099B | 3.84 ± 0.036C | 0.840 ± 0.0091CD | 5.71 ± 0.098E |
| Surface | 20 ± 0.24E | 0.93 ± 0.0032F | 4.62 ± 0.040B | 0.842 ± 0.0057CD | 6.69 ± 0.14B |
| Dairy D | |||||
| Core | 45 ± 0.035A | 1.36 ± 0.015BC | 3.03 ± 0.031D | 0.872 ± 0.0042AB | 5.44 ± 0.047F |
| Surface | 31 ± 1.1D | 1.40 ± 0.0021B | 4.55 ± 0.16B | 0.876 ± 0.011A | 7.28 ± 0.089A |
Dairy A: farmhouse producing cheese of the Havarti type from raw milk, ripened for 12 weeks. Dairy B: farmhouse producing cheese of the Danbo type from pasteurised milk, ripened for 6 weeks. Dairy C: farmhouse producing cheese of the Havarti type from pasteurised milk, ripened for 12 weeks. Dairy D: industrial dairy producing cheese of the Danbo type from pasteurised milk, ripened for 6 weeks
aValues in same column not marked by same superscript capitals are significantly different using one-way ANOVA with Tukey HSD test (≥95 % confidence)
Microbial Cell Counts
The bacterial and yeast counts from the cheese interior and surface are shown in Table 2. The interior bacterial counts for cheese A (3.6×10⁷ CFU g−1 on GM17, 5.6×10⁷ CFU g−1 on MRS pH 6.2 and 2.8×10⁶ CFU g−1 on MRS pH 5.4) were significantly higher than the counts for cheese B, C and D varying between 3.1 × 10⁵ and 5.7 × 10⁵ CFU g−1 on GM17, between 3.5 × 10⁵ and 6.6 × 10⁵ CFU g−1 on MRS pH 6.2 and between 6.1 × 10³ and 7.4 × 10⁵ CFU g−1 on MRS pH 5.2. Concerning the surface bacterial counts, generally no significant differences between the cheeses were observed as they varied between 1.4 × 10⁸ and 8.1 × 10⁸ CFU cm−2 on TSA without added NaCl and between 2.0×10⁸ and 6.0×10⁸ CFU cm−2 on TSA supplemented with 4.0 % (w/v) NaCl. The yeast surface counts were consistently lower than the bacterial counts. The yeast count for cheese C (3.7 × 10⁶ CFU cm−2) was significantly higher than the other cheeses varying between 1.2×10⁵ and 7.4 ×10⁵ CFU cm−2. As expected, no yeasts were identified on MYGP from the interior of the cheeses (results not shown).
Table 2.
Bacterial and yeast counts for Danish surface-ripened cheeses
| Dairy Aa | Dairy Ba | Dairy Ca | Dairy Da | |
|---|---|---|---|---|
| Interior (CFU g−1) | ||||
| Lactic acid bacteria | ||||
| GM17 | 3.6×10⁷ ± 1.4×10⁷,A | 3.1×10⁵ ± 2.8×10⁴,B | 4.9×10⁵ ± 5.0×10⁴,B | 5.7x 10⁵ ± 9.9×10⁴,B |
| MRS pH 6.2 | 5.6×10⁷ ± 1.5×10⁷,A | 4.0×10⁵ ± 2.7×10⁵,B | 3.5×10⁵ ± 1.4×10⁵,B | 6.6×10⁵ ± 2.1×10⁴,B |
| MRS pH5.4 | 2.8×10⁶ ± 3.5×10⁵,A | 6.1×10³ ± 7.1×10²,B | 4.5×10³ ± 1.6×10³,B | 7.4×10⁵ ± 1.6×10⁵,B |
| Surface (CFU cm−2) | ||||
| Aerobic bacteria | ||||
| TSA 0 % (w/v) NaCl | 8.1×10⁸ ± 3.0×10⁸,A | 1.4×10⁸ ± 2.8×10⁸,A | 5.3×10⁸ ± 2.6×10⁸,A | 6.3×10⁸ ± 1.8×10⁸,A |
| TSA 4 % (w/v) NaCl | 5.1×10⁸ ± 5.1×10⁷,A | 2.0×10⁸ ± 2.4×10⁷,B | 6.0×10⁸ ± 3.5x 10⁷,A | 5.2×10⁸ ± 2.9×10⁸,A |
| Yeasts | ||||
| MYGP | 7.4×10⁵ ± 1.7×10⁵,B | 1.2×10⁵ ± 2.4×10⁴,C | 3.7×10⁶ ± 1.4×10⁵,A | 4.8×10⁵ ± 1.3×10⁵BC |
Dairy A: farmhouse producing cheese of the Havarti type from raw milk, ripened for 12 weeks. Dairy B: farmhouse producing cheese of the Danbo type from pasteurised milk, ripened for 6 weeks. Dairy C: farmhouse producing cheese of the Havarti type from pasteurised milk, ripened for 12 weeks. Dairy D: industrial-scale dairy producing cheese of the Danbo type from pasteurised milk, ripened for 6 weeks.
aValues in same row not marked by same superscript capitals are significantly different using one-way ANOVA with Tukey HSD test (≥95 % confidence)
Grouping and Identification of the Cheese Microbiota
Detection of Rep-PCR profiles was proved to be a reliable and rapid method for grouping of both bacterial and yeast isolates (Figs. 1, 2 and 3). For the majority of the groups, variations in rep-PCR profiles were observed indicating that strain variation occurs within the groups. Similarly, different groups containing identical species is due to strain variations. Representative isolates from each rep-PCR group were identified by sequencing of rRNA genes. Most sequenced bacterial and yeast isolates showed high similarities (>99 %) to sequences in EzTaxon and Genbank, respectively (Tables 3, 4 and 5).
Figure 1.
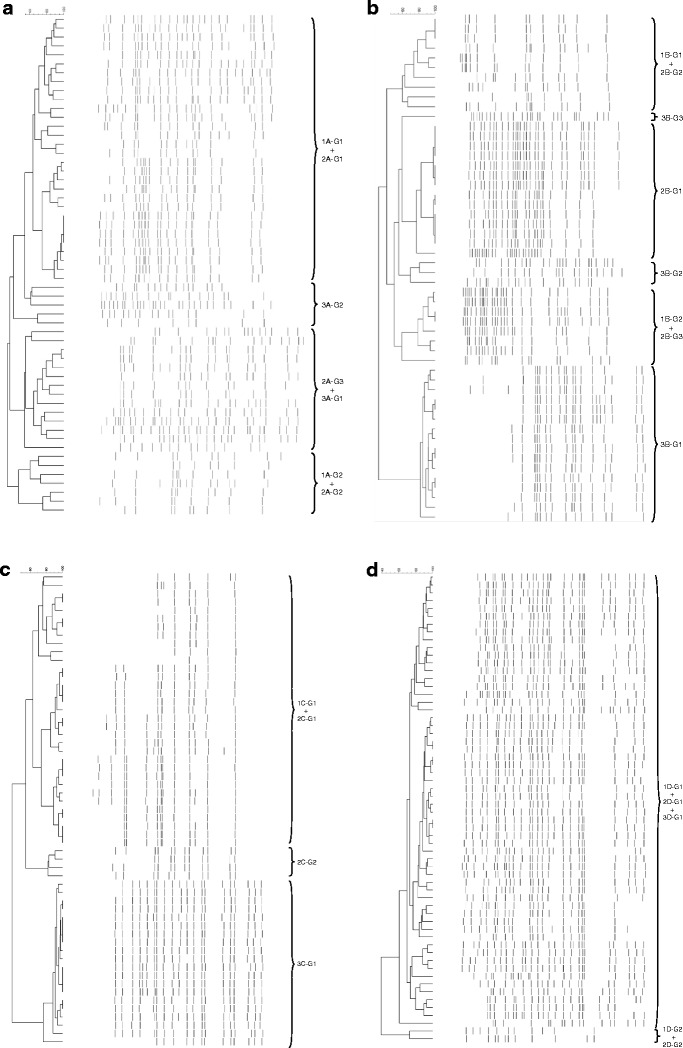
Dendrogram obtained from GTG5-PCR fingerprint of the interior bacterial isolates from GM17 and MRS with pH 6.2 and 5.4. a Dairy A, b Dairy B, c Dairy C and d Dairy D. The identification of the groups can be seen in Table 3
Figure 2.
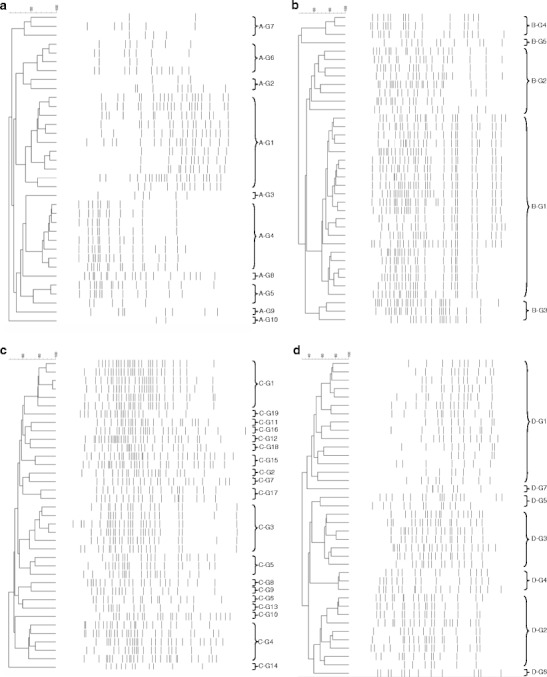
Dendrogram obtained from GTG5-PCR fingerprint of the surface bacterial isolates from TSA added 4.0 % (w/v) NaCl. a Dairy A, b Dairy B, c Dairy C and d Dairy D. The identification of the groups can be seen in Table 4
Figure 3.
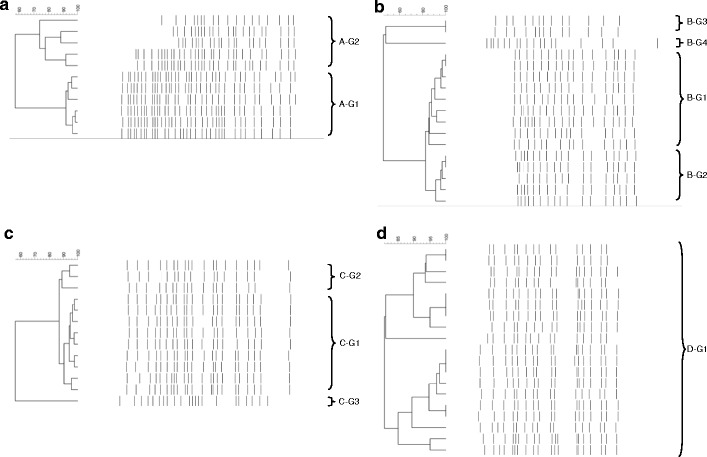
Dendrogram obtained from GTG5-PCR fingerprint of the surface yeast isolates from MYGP. a Dairy A, b Dairy B, c Dairy C and d Dairy D. The identification of the groups can be seen in Table 5
Table 3.
Identification of the interior bacterial community by culture dependent isolation followed by16S rRNA gene sequencing
| Rep-PCR group | Sequence length (bp) | Similarity (%) | Closest phylogenetic affiliation in EzTaxon | Distribution (%) | GenBank accession number |
|---|---|---|---|---|---|
| GM17 (30 °C) | |||||
| Dairy A | |||||
| 1A-G1 | 1,364 | 100 | Leuconostoc mesenteroides | 74 | JQ680412 |
| 1A-G2 | 1,375 | 99.9 | Lactococcus lactis subsp. lactis | 26 | JQ680413 |
| Dairy B | |||||
| 1B-G1 | 1,410 | 100 | Lactococcus lactis subsp. lactis | 53 | JQ680414 |
| 1B-G2 | 1,399 | 99.6 | Leuconostoc pseudomesenteroides | 47 | JQ680415 |
| Dairy C | |||||
| 1C-G1 | 1,340 | 100 | Lactococcus lactis subsp. lactis | 100 | JQ680416 |
| Dairy D | |||||
| 1D-G1 | 1,441 | 100 | Lactobacillus paracasei | 95 | JQ680417 |
| 1D-G2 | 1,415 | 99.9 | Lactococcus lactis subsp. cremoris | 5 | JQ680418 |
| MRS (pH 6.2, 30 °C) | |||||
| Dairy A | |||||
| 2A-G1 | 1,421 | 100 | Leuconostoc mesenteroides | 80 | JQ680419 |
| 2A-G2 | 1,385 | 100 | Lactococcus lactis subsp. lactis | 10 | JQ680420 |
| 2A-G3 | 1,382 | 100 | Lactobacillus paracasei | 10 | JQ680421 |
| Dairy B | |||||
| 2B-G1 | 1,425 | 99.4 | Lactobacillus oligofermentans | 82 | JQ680422 |
| 2B-G2 | 1,320 | 100 | Lactococcus lactis subsp. lactis | 12 | JQ680423 |
| 2B-G3 | 1,361 | 99.4 | Leuconostoc pseudomesenteroides | 6 | JQ680424 |
| Dairy C | |||||
| 2C-G1, 2C-G2 | 1,409 | 100 | Lactococcus lactis subsp. lactis | 100 | JQ680425 |
| Dairy D | |||||
| 2D-G1 | 1,435 | 100 | Lactobacillus paracasei | 95 | JQ680426 |
| 2D-G2 | 1,407 | 100 | Lactococcus lactis subsp. cremoris | 5 | JQ680427 |
| MRS (pH 5.4, 37 °C) | |||||
| Dairy A | |||||
| 3A-G1 | 1,405 | 99.9 | Lactobacillus paracasei | 71 | JQ680428 |
| 3A-G2 | 1,448 | 100 | Lactobacillus parabuchneri | 29 | JQ680429 |
| Dairy B | |||||
| 3B-G1 | 1,432 | 99.9 | Lactobacillus brevis | 80 | JQ680430 |
| 3B-G2 | 1,428 | 99.0 | Lactobacillus farciminis | 15 | JQ680431 |
| 3B-G3 | 1,409 | 100 | Enterococcus dispar | 5 | JQ680432 |
| Dairy C | |||||
| 3C-G1 | 1,411 | 100 | Lactobacillus paracasei | 100 | JQ680433 |
| Dairy D | |||||
| 3D-G1 | 1,438 | 100 | Lactobacillus paracasei | 100 | JQ680434 |
Table 4.
Identification of the surface bacterial community by culture dependent isolation followed by 16S rRNA gene sequencing
| Rep-PCR group | Sequence length (bp) | Similarity (%) | Closest phylogenetic affiliation in EzTaxon | Distribution | GenBank accession number |
|---|---|---|---|---|---|
| Dairy A | |||||
| A-G1, A-G2, A-G3 | 1,373 | 99.6 | Brachybacterium alimentarum | 40 | JQ680435 |
| A-G4, A-G5 | 1,348 | 99.1 | Corynebacterium casei | 31 | JQ680436 |
| A-G6, AG-7, AG-8 | 1,374 | 98.8 | Brevibacterium permense | 23 | JQ680437 |
| A-G9 | 1,371 | 99.7 | Leucobacter albus | 3 | JQ680438 |
| A-G10 | 1,380 | 99.2 | Microbacterium gubbeenense | 3 | JQ680439 |
| Dairy B | |||||
| B-G1 | 1,371 | 100 | Corynebacterium variabile | 59 | JQ680440 |
| B-G2 | 1,395 | 99.4 | Brevibacterium linens | 22 | JQ680441 |
| B-G3 | 1,387 | 99.3 | Corynebacterium casei | 8 | JQ680442 |
| B-G4 | 1,420 | 100 | Staphylococcus saprophyticus | 8 | JQ680443 |
| B-G5 | 1,390 | 99.9 | Halomonas alkaliphila | 3 | JQ680444 |
| Dairy C | |||||
| C-G1, C-G2 | 1,369 | 99.3 | Corynebacterium casei | 19 | JQ680445 |
| C-G3 | 1,398 | 100 | Staphylococcus equorum | 16 | JQ680446 |
| C-G4 | 1,397 | 99.6 | Brevibacterium aurantiacum | 14 | JQ680447 |
| C-G5, C-G6 | 1,390 | 100 | Microbacterium gubbeenense | 11 | JQ680448 |
| C-G7, C-G8, C-G9, C-G10 | 1,388 | 100 | Agrococcus casei | 11 | JQ680449 |
| C-G11, C-G12, C-C13, C-G14 | 1,317 | 98.4 | Brachybacterium spp. | 11 | JQ680450 |
| C-G15, C-G16 | 1,381 | 100 | Corynebacterium variabile | 8 | JQ680451 |
| C-G17 | 1,397 | 99.9 | Alcaligenes faecalis | 5 | JQ680452 |
| C-G18 | 1,303 | 99.8 | Proteus vulgaris | 3 | JQ680453 |
| C-G19 | 1,427 | 99.8 | Enterococcus spp. | 3 | JQ680454 |
| Dairy D | |||||
| D-G1 | 1,381 | 100 | Corynebacterium variabile | 39 | JQ680455 |
| D-G2 | 1,423 | 100 | Staphylococcus equorum | 24 | JQ680456 |
| D-G3 | 1,359 | 99.3 | Corynebacterium casei | 18 | JQ680457 |
| D-G4 | 1,419 | 100 | Staphylococcus saprophyticus | 8 | JQ680458 |
| D-G5 | 1,422 | 100 | Marinilactibacillus psychrotolerans | 5 | JQ680459 |
| D-G6 | 1,429 | 100 | Bavariicoccus seileri | 3 | JQ680460 |
| D-G7 | 1,392 | 99.7 | Micrococcus spp. | 3 | JQ680461 |
Bacterial isolates have been isolated from TSA with 4.0 % (w/v) NaCl incubated at 30 °C
Table 5.
Identification of the surface yeast community by culture dependent isolation followed by 26S rRNA gene sequencing
| Rep-PCR group | Sequence length (bp) | Similarity (%) | Closest phylogenetic affiliation in GenBank | Distribution (%) | GenBank accession number |
|---|---|---|---|---|---|
| Dairy A | |||||
| A-G1 | 538 | 100 | Yarrowia lipolytica | 55 | JQ680462 |
| A-G2 | 568 | 98.8 | Scopulariopsis brevicaulis a | 45 | JQ680463 |
| Dairy B | |||||
| B-G1, BG2 | 556 | 100 | Geotrichum spp | 82 | JQ680464 |
| B-G3 | 538 | 100 | Kluyveromyces marxianus | 12 | JQ680465 |
| B-G4 | 576 | 100 | Debaryomyces hansenii | 6 | JQ680466 |
| Dairy C | |||||
| C-G1, C-G2 | 581 | 100 | Debaryomyces hansenii | 92 | JQ680467 |
| C-G3 | 557 | 98.7 | Geotrichum spp | 8 | JQ680468 |
| Dairy D | |||||
| D-G1 | 597 | 100 | Debaryomyces hansenii | 100 | JQ680469 |
Yeast isolates have been isolated from MYGP incubated at 25 °C
a Scopulariopsis brevicaulis is classified as a mould
Figure 1 shows the grouping of the interior bacterial isolates from GM17 and MRS with pH 6.2 and 5.4. The interior bacterial isolates from the cheeses from dairies A and B were divided into more groups (four and six groups, respectively) than the interior bacterial isolates from the cheeses from dairies C and D (three and two groups, respectively). The cheeses from dairies A and C were primarily dominated by the LAB starter cultures Leuconostoc mesenteroides and Lactococcus lactis subsp. lactis (Table 3). Furthermore, the cheeses from dairies A and C were dominated by the non-starter lactic acid bacteria (NSLAB) Lactobacillus paracasei, and for the cheese from dairy A, a minor group consisting of the NSLAB Lb. parabuchneri was found. The interior bacterial isolates from the cheeses from dairies B and D were primarily dominated by NSLAB. The cheese from dairy B was dominated by a range of NSLAB including Lb. brevis, Lb. oligofermentans and Lb. farminis, whereas the cheese from dairy D was exclusively dominated by the NSLAB Lb. paracasei. Additionally, minor groups of the LAB starter cultures Lc. lactis subsp. lactis and Lc. lactis subsp. cremoris were found on the cheeses from dairies B and D, respectively.
Figure 2 shows the grouping of the surface bacterial isolates from TSA supplemented with 4.0 % (w/v) NaCl. Similar results were obtained for the surface bacterial isolates from TSA without NaCl (results not shown). Generally, the surface bacterial isolates were divided into more groups compared to the interior bacterial isolates, indicating that the surface microbiota is more complex than the interior bacterial microbiota. The surface bacterial isolates from cheeses from dairy A and C were divided into a higher number of groups (ten and 19 groups, respectively) than the surface bacterial isolates from cheeses from dairy B and D (five and seven groups, respectively). However, identifications showed the ten groups found on the cheese from dairy A only represented five different species, whereas the 19 groups found on the cheese from dairy C represented ten different species indicating strain variation as mentioned above (Table 4). For dairy B five different species were identified whereas for dairy D seven different species were identified.
Most species were Gram-positive Actinobacteria with Corynebacterium casei and/or C. variabile as the predominant (Table 4). Additionally, the cheese from dairy A was dominated by high of numbers of Brachybacterium alimentarum. Various Brevibacterium species were found on the cheeses from the farmhouses (dairies A, B and C). B. permense was found on the cheese from dairy A, B. linens was found on the cheese from dairy B and B. aurantiacum was found on the cheese from dairy C. Brevibacterium spp. could not be isolated on the cheese from dairy D. Furthermore, a number of coagulase negative staphylococci were found, i.e., Staphylococcus saprophyticus on the cheeses from dairies B and D, and Staph. equorum on the cheeses from dairies C and D. Finally, a number of Gram-negative bacteria species including Proteus vulgaris and Alcaligenes faecalis was found on the cheese from dairy C.
Figure 3 shows the grouping of the surface yeast microbiota. The yeast surface microbiota on the three farmhouse cheeses consisted of two to four groups, whereas the cheese produced at the industrial dairy (dairy D) consisted of only one single group. The cheese from dairy A was equally dominated by Yarrowia lipolytica and Scopulariopsis brevicaulis. The yeast microbiota on cheese from dairy B was primarily dominated by Geotrichum spp., however, Kluyveromyces marxianus and Debaryomyces hansenii were additionally found in minor amounts. The cheese from dairy C was dominated by D. hansenii followed by a minor group of Geothrichum spp. Finally, the cheese from dairy D was entirely dominated by D. hansenii.
Denaturing Gradient Gel Electrophoresis
Culture dependent isolation followed by genotypic identifications was basically confirmed by the culture-independent method, DGGE (Fig. 4). Additionally, in the sample from the interior of the cheese from dairy A, DGGE band with strong intensity was identified as Streptococcus thermophilus. Furthermore, DGGE bands with strong intensities from the cheese surface samples were found to represent Vagococcus carniphilus (the cheeses from dairies A, B and D), Psychrobacter spp. (the cheeses from dairies A and C) and Lb. curvatus (the cheese from dairy B) indicating that these bacterial species may play a role in cheese ripening, even though they were not found by the culture dependent approach. Unfortunately, several major DGGE bands in the samples from the cheese surface could not be successfully identified.
Figure 4.
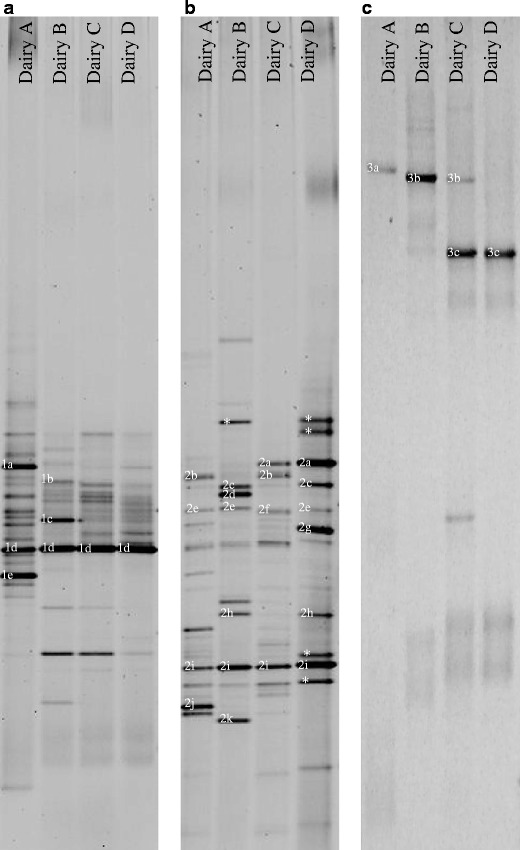
DGGE profiles for cheeses from dairies A, B, C and D. a Bacteria from interior of the cheeses, b bacteria from the surface of the cheeses and c yeasts from the surface of the cheeses. Bands were identified as 1a: Leuconostoc mesenteroides, 1b: Lactobacillus brevis, 1c: Lactobacillus oligofermentans, 1d: Lactococcus lactis subsp. lactis, 1e: Streptococcus thermophilus, 2a: Staphylococcus equorum, 2b: Vagococcus carniphilus, 2c: Bavariicoccus seileri, 2d: Lactobacillus curvatus, 2e: Psychrobacter spp., 2f: Proteus vulgaris, 2 g: Marinilactibacillus psychrotolerans, 2 h: Corynebacterium variabile, 2i: Corynebacterium casei, 2j: Brachybacterium sp., 2 k: Brevibacterium linens, 3a: Yarrowia lipolytica, 3b: Geotrichum spp., 3c: Debaryomyces hansenii. *Strong bands that were not identified
Discussion
In addition to a culture dependent approach, a culture independent approach using DGGE was included for identification of the microbial microbiota in Danish cheeses. Most significantly, the DGGE analysis found that Streptococcus thermophilus is present in raw milk cheese from dairy A, even though this thermophilic lactic acid bacterium was not included in the mesophilic LAB starter culture used for production of the raw milk cheese from dairy A. No culturable Str. thermophilus isolates was isolated from GM17 agar incubated at 37 °C (data not shown). In the study by Masoud et al. [38], Str. thermophilus was similarly detected by DGGE analysis without being added as part of the LAB starter culture. However, Masoud et al. [38] excluded that Str. thermophilus originates from the raw milk, as it was not identified in the DGGE profile of the raw milk. Even though the source of Str. thermophilus remains unknown, it is likely that Str. thermophilus may play an important role in milk acidification and cheese ripening as previously reported [36, 47, 48]. Concerning the surface microbiota, which was found to be the most complex microbiota with the highest number of species, some limitations by the DGGE method was observed as several DGGE bands with strong intensity could not be successfully sequenced, which suggests that PCR products of several bacterial species comigrated as previously reported by Sekiguchi et al. [53].
Flavour formation may be enhanced during ripening, if strains that lyse rapidly are selected [10, 18]. A difference in autolysis can be seen between the two subspecies of Lactococcus lactis. Lactococcus lactis subsp. lactis survives better in cheese than Lc. lactis subsp. cremoris [8]. This fact even though not examined in the present study suggests that the level of autolysis of the latter is the highest and thus explains why Lc. lactis subsp. cremoris was generally not found in the cheeses at the end of ripening, even though it was added as a part of the primary LAB starter culture. Contrary, the NSLAB Lactobacillus paracasei was found in three out of four cheeses. This confirms the findings by Antonsson et al. [1], who found Lb. paracasei to be the main NSLAB in several Danbo cheeses.
During the last decades, there has been an increasing interest in using surface-ripening cultures for cheese production to ensure the presence of desirable microorganisms necessary for the ripening process. However, recent investigations have revealed that these commercial ripening cultures do not establish well on the cheese surfaces [20, 46, 50]. These observations were confirmed in the present study as Brevibacterium linens was found to be subdominant compared to other bacteria on the farmhouse cheeses, and no Brevibacterium spp. was found on the cheese from the industrial dairy. Also, the variations seen at the strain level by the rep-PCR technique indicate that several indigenous cultures take part in the maturation process. This finding underlines that microorganisms selected as starter cultures expressing defined functions often behave differently in complex microbial communities or often cannot compete with the indigenous microbiota. Several studies indicate that the microbial succession during cheese ripening depends on adaption of the cultures to stress conditions such as high NaCl concentrations, low water activity [22, 40, 46]. Most recently, growth of aerobic ripening bacteria at cheese surfaces has been shown to be limited by the availability of iron [39].
B. linens was usually reported to be the most important bacterial species associated with cheese surfaces [13, 28, 49]. In the present study, various Brevibacterium spp. were found on the cheeses from the farmhouses (dairies A, B and C). B. linens and B. aurantiacum, found on the cheeses from dairies B and C, respectively, have been used for a long time as ripening cultures by the dairy industry [16], whereas the soil bacteria B. permense found on the cheese from dairy A, to our knowledge, has not previously been found on cheese.
Several studies have now shown that Corynebacterium spp. is the most dominant bacterial species on surface-ripened cheeses [3, 6, 34]. C. casei and/or C. variabile were found in the present study to be the predominant bacterial species on the surfaces of the four cheeses and thus potentially important during cheese ripening. These data confirm that strains of Corynebacterium spp. are candidates as ripening cultures for production of surface-ripened cheeses.
Since the study by Maoz et al. [34], several authors have reported a Gram-negative microbiota on surface-ripened cheeses. First, the Gram-negative bacterial microbiota was associated with hygienic problems, but more recently an interest in their role in flavour production has been reported [11]. In the present study, a significant Gram-negative bacterial microbiota consisting of Proteus vulgaris and Alcaligenes faecalis was found on cheese from dairy C. A previous study has focused on P. vulgaris as cheese ripening culture [11]. P. vulgaris was found to produce important flavour notes including aldehydes and acids, but influenced other surface-ripening cultures negatively. A. faecalis, which is found in soil, water, and environments in association with humans and generally considered non-pathogenic [19], has also previously been found on Livarot cheese [30].
The present study confirms the presence of the marine bacteria Marinilactibacillus psychrotolerans on cheese as this species was found on the surface of cheese D. Both French and German cheeses have previously been reported to contain M. psychrotolerans [14, 34]. It was suggested that M. psychrotolerans is transferred to the cheeses from the marine environments via sea salt. However, its potential role in cheese ripening remains unknown.
Yeasts play an essential role in deacidification of the cheese surface due to lactate assimilation and production of alkaline metabolites, e.g., ammonia [23, 46], which is prerequisite for development of the less acid tolerant bacterial microbiota [4]. The present study confirms that Debaryomyces hansenii and Geotrichum spp. are the dominating yeast species on surface-ripened cheeses. D. hansenii was found to be the dominating yeast species on the cheeses from dairies C and D, whereas Geotrichum spp. was found to dominate on the cheese from dairy B. On the cheese from dairy A, Yarrowia lipolytica was the dominating yeast species. Y. lipolytica is a naturally developing yeast species on cheese surfaces, and has in some cases been shown to rapidly outnumber other yeast species including D. hansenii and Geotrichum spp. [33]. This may explain why the latter yeast species are not found on the cheese from dairy A. Finally, the filamentous fungus Scopulariopsis brevicaulis was found in a high number on cheese A. S. brevicaulis has previously been found in Danish cheese [52], and has been subject to spoilage of cheeses due to its high proteolytic activity resulting in ammonia production and its production of arsenical compounds, e.g., diethylarsine, which has a very characteristic garlic-like odour [5].
In conclusion, the interior bacterial microbiota of the Danish cheeses consisted of LAB starter cultures as well as one or more NSLAB. Noticeable for the bacterial community of the cheese surfaces was that B. linens did not establish well on the cheeses, even though it was used as ripening culture. Contrarily C. casei and/or C. variabile were predominant, whereas the surface yeast microbiota resembled that otherwise stated in literature. Generally, the Danish cheeses produced at farmhouses had a more complex microbiota comprising of a higher number of bacterial strains both in the interior and on the surface compared to the Danish cheese produced at the industrial dairy. Culture dependent identifications were basically confirmed by the culture independent method DGGE, even though the latter technique proved the presence of additional cultures including Str. thermophilus in cheese interiors as well as Vagococcus carniphilus, Psychrobacter spp. and Lb. curvatus on cheese surfaces. Due to the limited number of cheeses included, further studies have to be performed to confirm the composition of the microbial ecology in Danish cheeses. Knowledge on the microbial community of cheeses may be used for improving process and ripening conditions in order to enhance the quality and consistency of the final product. Finally, the cultures isolated can potentially be used as starter or ripening cultures for production of Danbo- and Havarti-type cheeses.
Acknowledgements
This work was supported by the Danish AgriFish Agency through the project Tasteful Danish cheeses based on unique starter cultures “CheeseUnique” (3304-FVFP-08-K-10-01). Søren Nørgaard Kristiansen and Kenneth Efterstigaard Thuesen are thanked for excellent technical assistance.
References
- 1.Antonsson M, Molin G, Ardo Y. Lactobacillus strains isolated from Danbo cheese as adjunct cultures in a cheese model system. Int J Food Microbiol. 2003;85:159–169. doi: 10.1016/S0168-1605(02)00536-6. [DOI] [PubMed] [Google Scholar]
- 2.Bockelmann V, Willems P, Rademaker J, Noordman W, Heller KJ. Cultures for surface ripening of smeared soft cheese. Kieler Milchwirtschaftliche Forschungsberichte. 2003;55:277–299. [Google Scholar]
- 3.Bockelmann W, Hoppe-Seyler T. The surface flora of bacterial smear-ripened cheeses from cow's and goat's milk. Int Dairy J. 2001;11:307–314. doi: 10.1016/S0958-6946(01)00060-7. [DOI] [Google Scholar]
- 4.Bockelmann W, Willems KP, Neve H, Heller KH. Cultures for the ripening of smear cheeses. Int Dairy J. 2005;15:719–732. doi: 10.1016/j.idairyj.2004.08.022. [DOI] [Google Scholar]
- 5.Bothast RJ, Lancaster EB, Hesseltine CW. Scopulariopsis brevicaulis: effect of pH and substrate on growth. Appl Environ Microbiol. 1975;1:55–66. [Google Scholar]
- 6.Brennan NM, Ward AC, Beresford TP, Fox PF, Goodfellow M, Cogan TM. Biodiversity of the bacterial flora on the surface of a smear cheese. Appl Environ Microbiol. 2002;68:820–830. doi: 10.1128/AEM.68.2.820-830.2002. [DOI] [PMC free article] [PubMed] [Google Scholar]
- 7.Brennan N, Cogan T, Loessner M, Scherer S. Bacterial surface-ripened cheeses. In: Fox PF, McSweeney P, Cogan TM, Guinee T, editors. Cheese: chemistry, physics and microbiology. Academic Press, Amsterdam: Elsevier; 2004. pp. 199–225. [Google Scholar]
- 8.Chapot-Chartier MP, Deniel C, Rousseau L, Vassal L, Gripon JC. Autolysis of two strains of Lactococcus lactis during cheese ripening. Int Dairy J. 1994;4:251–269. doi: 10.1016/0958-6946(94)90016-7. [DOI] [Google Scholar]
- 9.Cocolin L, Bisson L, Mills DA. Direct profiling of the yeast dynamics in wine fermentations. FEMS Microbiol Lett. 2000;189:81–87. doi: 10.1111/j.1574-6968.2000.tb09210.x. [DOI] [PubMed] [Google Scholar]
- 10.Crow VL, Coolbear T, Gopal PK, Martley FG, Mckay LL, Riepe H. The role of autolysis of lactic acid bacteria in the ripening of cheese. Int Dairy J. 1995;5:855–875. doi: 10.1016/0958-6946(95)00036-4. [DOI] [Google Scholar]
- 11.Deetae P, Mounier J, Bonnarme P, Spinnler HE, Irlinger F, Helinck S. Effects of Proteus vulgaris growth on the establishment of a cheese microbial community and on the production of volatile aroma compounds in a model cheese. J Appl Microbiol. 2009;107:1404–1413. doi: 10.1111/j.1365-2672.2009.04315.x. [DOI] [PubMed] [Google Scholar]
- 12.El Soda M, Madkor SA, Tong TS. Adjunct cultures: recent developments and potential significance to the cheese industry. J Dairy Sci. 2000;83:606–619. doi: 10.3168/jds.S0022-0302(00)74920-4. [DOI] [PubMed] [Google Scholar]
- 13.Eppert I, Valdés-Stauber N, Gotz H, Busse M, Scherer S. Growth reduction of Listeria spp. caused by undefined industrial red smear cheese cultures and bacteriocin-producing Brevibacterium linens as evaluated in situ on soft cheese. Appl Environ Microbiol. 1997;63:4812–4817. doi: 10.1128/aem.63.12.4812-4817.1997. [DOI] [PMC free article] [PubMed] [Google Scholar]
- 14.Feurer C, Irlinger F, Spinnler HE, Glaser P, Vallaeys T. Assessment of the rind microbial diversity in a farm house-produced vs a pasteurized industrially produced soft red-smear cheese using both cultivation and rDNA-based methods. J Appl Microbiol. 2004;97:546–556. doi: 10.1111/j.1365-2672.2004.02333.x. [DOI] [PubMed] [Google Scholar]
- 15.Feurer C, Vallaeys T, Corrieu G, Irlinger F. Does smearing inoculum reflect the bacterial composition of the smear at the end of the ripening of a French soft, red-smear cheese? J Dairy Sci. 2004;87:3189–3197. doi: 10.3168/jds.S0022-0302(04)73454-2. [DOI] [PubMed] [Google Scholar]
- 16.Forquin M, Hébert A, Roux A, Aubert J, Proux CHJ, Landaud S, Junot C, Bonnarme P, Matin-Verstraete I. Global regulation of the reponse to sulfur availability in the cheese-related bacterium Brevibacterium aurantiacum. Appl Environ Microbiol. 2011;77:1449–1459. doi: 10.1128/AEM.01708-10. [DOI] [PMC free article] [PubMed] [Google Scholar]
- 17.Fox PF, Lucey JA, Cogan TM. Glycolysis and related reactions during cheese manufacture and ripening. Critical Reviews in Food Science and Nutrition. 1990;29:237–253. doi: 10.1080/10408399009527526. [DOI] [PubMed] [Google Scholar]
- 18.Fox PF, Wallace JM, Morgan S, Lynch CM, Niland EJ, Tobin J. Acceleration of cheese ripening. Antonie Van Leeuwenhoek. 1996;70:271–297. doi: 10.1007/BF00395937. [DOI] [PubMed] [Google Scholar]
- 19.Garrity GM. The proteobacteria, Part C: The alpha, beta, delta and epsilonproteobacteria. In: Garrity GM, Brenner DJ, Krieg NR, Staley JT, editors. Bergey's manual of systematic bacteriology. New York: Springer; 2005. pp. 647–657. [Google Scholar]
- 20.Goerges S, Mounier J, Rea MC, Gelsomino R, Heise V, Beduhn R, Cogan TM, Vancanneyt M, Scherer S. Commercial ripening starter microorganisms inoculated into cheese milk do not successfully establish themselves in the resident microbial ripening consortia of a South German red smear cheese. Appl Environ Microbiol. 2008;74:2210–2217. doi: 10.1128/AEM.01663-07. [DOI] [PMC free article] [PubMed] [Google Scholar]
- 21.Gori K, Mortensen C, Jespersen L. A comparative study of the anti-listerial activity of smear bacteria. Int Dairy J. 2010;20:555–559. doi: 10.1016/j.idairyj.2010.02.015. [DOI] [Google Scholar]
- 22.Gori K, Mortensen HD, Arneborg N, Jespersen L. Expression of the GPD1 and GPP2 orthologues and glycerol retention during growth of Debaryomyces hansenii at high NaCl concentrations. Yeast. 2005;22:1213–1222. doi: 10.1002/yea.1306. [DOI] [PubMed] [Google Scholar]
- 23.Gori K, Mortensen HD, Arneborg N, Jespersen L. Ammonia as a mediator for communication in strains of Debaryomyces hansenii and yeast species. J Dairy Sci. 2007;90:5032–5041. doi: 10.3168/jds.2006-750. [DOI] [PubMed] [Google Scholar]
- 24.Irlinger F, Mounier J. Microbial interactions in cheese: implications for cheese quality and safety. Curr Opin Biotechnol. 2009;20:142–148. doi: 10.1016/j.copbio.2009.02.016. [DOI] [PubMed] [Google Scholar]
- 25.Ishikawa M, Kodama K, Yasuda H, Okamoto-Kainuma A, Koizumi K, Yamasato K. Presence of halophilic and alkaliphilic lactic acid bacteria in various cheeses. Lett Appl Microbiol. 2007;44:308–313. doi: 10.1111/j.1472-765X.2006.02073.x. [DOI] [PubMed] [Google Scholar]
- 26.Jaeger B, Hoppe-Seyler T, Bockelmann W, Heller KJ. The influence of the brine microflora on the ripening of smear cheeses. Milchwissenschaft. 2002;57:645–648. [Google Scholar]
- 27.Jany JL, Barbier G. Culture-independent methods for identifying microbial communities in cheese. Food Microbiol. 2008;25:839–848. doi: 10.1016/j.fm.2008.06.003. [DOI] [PubMed] [Google Scholar]
- 28.Kohl W, Achenbach H, Reichenbach H. Investigations on metabolites of microorganisms: 24. The pigments of Brevibacterium linens — aromatic carotenoids. Phytochem. 1983;22:207–210. doi: 10.1016/S0031-9422(00)80090-4. [DOI] [Google Scholar]
- 29.Kurtzman CP, Robnett CJ. Identification and phylogeny of ascomycetous yeasts from analysis of nuclear large subunit (26S) ribosomal DNA partial sequences. Antonie Van Leeuwenhoek. 1998;73:331–371. doi: 10.1023/A:1001761008817. [DOI] [PubMed] [Google Scholar]
- 30.Larpin-Laborde S, Imran M, Bonaiti C, Bora N, Gelsomino R, Goerges S, Irlinger F, Goodfellow M, Ward AC, Vancanneyt M, Swings J, Scherer S, Gueguen M, Desmasures N. Surface microbial consortia from Livarot, a French smear-ripened cheese. Can J Microbiol. 2011;57:651–660. doi: 10.1139/w11-050. [DOI] [PubMed] [Google Scholar]
- 31.Law J, Haandrikman A. Proteolytic enzymes of lactic acid bacteria. Int Dairy J. 1997;7:1–11. doi: 10.1016/0958-6946(95)00073-9. [DOI] [Google Scholar]
- 32.Lynch CM, McSweeney PLH, Fox PF, Cogan TM, Drinan FD. Contribution of starter lactococci and non-starter lactobacilli to proteolysis in Cheddar cheese with a controlled microflora. Lait. 1997;77:441–459. doi: 10.1051/lait:1997431. [DOI] [Google Scholar]
- 33.Mansour S, Beckerich JM, Bonnarme P. Lactate and amino acid catabolism in the cheese-ripening yeast Yarrowia lipolytica. Appl Environ Microbiol. 2008;74:6505–6512. doi: 10.1128/AEM.01519-08. [DOI] [PMC free article] [PubMed] [Google Scholar]
- 34.Maoz A, Mayr R, Scherer S. Temporal stability and biodiversity of two complex antilisterial cheese-ripening microbial consortia. Appl Environ Microbiol. 2003;69:4012–4018. doi: 10.1128/AEM.69.7.4012-4018.2003. [DOI] [PMC free article] [PubMed] [Google Scholar]
- 35.Maoz A, Mayr R, Scherer S. Temporal stability and biodiversity of two complex antilisterial cheese-ripening microbial consortia. Appl Environ Microbiol. 2003;69:4012–4018. doi: 10.1128/AEM.69.7.4012-4018.2003. [DOI] [PMC free article] [PubMed] [Google Scholar]
- 36.Marino MMM, Rondinini G. Microbiological characterisation of artisanal Montasio cheese: analysis of its indigenous lactic acid bacteria. FEMS Microbiol Lett. 2003;229:138–140. doi: 10.1016/S0378-1097(03)00816-4. [DOI] [PubMed] [Google Scholar]
- 37.Masoud W, Jakobsen M. The combined effects of pH, NaCl and temperature on growth, of cheese ripening cultures of Debaryomyces hansenii and coryneform bacteria. Int Dairy J. 2005;15:69–77. doi: 10.1016/j.idairyj.2004.05.008. [DOI] [Google Scholar]
- 38.Masoud W, Takamiya M, Vogensen FK, Lillevang S, Abu Al-Soud W, Sorensen SJ, Jakobsen M. Characterization of bacterial populations in Danish raw milk cheeses made with different starter cultures by denaturating gradient gel electrophoresis and pyrosequencing. Int Dairy J. 2011;21:142–148. doi: 10.1016/j.idairyj.2010.10.007. [DOI] [Google Scholar]
- 39.Monnet C, Back A, Irlinger F. Growth of aerobic ripening bacteria at the cheese surface is limited by the availability of Iron. Appl Environ Microbiol. 2012;78:3185–3192. doi: 10.1128/AEM.00085-12. [DOI] [PMC free article] [PubMed] [Google Scholar]
- 40.Mortensen HD, Gori K, Siegumfeldt H, Nissen P, Jespersen L, Arneborg N. Intracellular pH homeostasis plays a role in the NaCl tolerance of Debaryomyces hansenii strains. Appl Microbiol Biotechnol. 2005;71:713–719. doi: 10.1007/s00253-005-0196-2. [DOI] [PubMed] [Google Scholar]
- 41.Mounier J, Gelsomino R, Goerges S, Vancanneyt M, Vandemeulebroecke K, Hoste B, Scherer S, Swings J, Fitzgerald GF, Cogan TM. Surface microflora of four smear-ripened cheeses. Appl Environ Microbiol. 2005;71:6489–6500. doi: 10.1128/AEM.71.11.6489-6500.2005. [DOI] [PMC free article] [PubMed] [Google Scholar]
- 42.Mounier J, Goerges S, Gelsomino R, Vancanneyt M, Vandemeulebroecke K, Hoste B, Brennan NM, Scherer S, Swings J, Fitzgerald GF, Cogan TM. Sources of the adventitious microflora of a smear-ripened cheese. J Appl Microbiol. 2006;101:668–681. doi: 10.1111/j.1365-2672.2006.02922.x. [DOI] [PubMed] [Google Scholar]
- 43.Ndoye B, Rasolofo EA, LaPointe G, Roy D. A review of the molecular approaches to investigate the diversity and activity of cheese microbiota. Dairy Sci Technol. 2011;91:495–524. doi: 10.1007/s13594-011-0031-8. [DOI] [Google Scholar]
- 44.Nielsen DS, Honholt S, Tano-Debrah K, Jespersen L. Yeast populations associated with Ghanaian cocoa fermentations analysed using denaturing gradient gel electrophoresis (DGGE) Yeast. 2005;22:271–284. doi: 10.1002/yea.1207. [DOI] [PubMed] [Google Scholar]
- 45.Ovreas L, Forney L, Daae FL, Torsvik V. Distribution of bacterioplankton in meromictic Lake Saelenvannet, as determined by denaturing gradient gel electrophoresis of PCR-amplified gene fragments coding for 16S rRNA. Appl Environ Microbiol. 1997;63:3367–3373. doi: 10.1128/aem.63.9.3367-3373.1997. [DOI] [PMC free article] [PubMed] [Google Scholar]
- 46.Petersen KM, Westall S, Jespersen L. Microbial succession of Debaryomyces hansenii strains during the production of Danish surfaced-ripened cheeses. J Dairy Sci. 2002;85:478–486. doi: 10.3168/jds.S0022-0302(02)74098-8. [DOI] [PubMed] [Google Scholar]
- 47.Randazzo CL, Pitino I, Ribbera A, Caggia C. Pecorino Crotonese cheese: study of bacterial population and flavor compounds. Food Microbiol. 2010;27:363–374. doi: 10.1016/j.fm.2009.11.010. [DOI] [PubMed] [Google Scholar]
- 48.Randazzo CL, Torriani S, Akkermans ADL, de Vos WM, Vaughan EE. Diversity, dynamics, and activity of bacterial communities during production of an artisanal Silician cheese as evaluated by 16S rRNA analysis. Appl Environ Microbiol. 2002;68:1882–1892. doi: 10.1128/AEM.68.4.1882-1892.2002. [DOI] [PMC free article] [PubMed] [Google Scholar]
- 49.Rattray FP, Fox PF. Aspects of enzymology and biochemical properties of Brevibacterium linens relevant to cheese ripening: A review. J Dairy Sci. 1999;82:891–909. doi: 10.3168/jds.S0022-0302(99)75308-7. [DOI] [PubMed] [Google Scholar]
- 50.Rea MC, Gorges S, Gelsomino R, Brennan NM, Mounier J, Vancanneyt M, Scherer S, Swings J, Cogan TM. Stability of the biodiversity of the surface consortia of Gubbeen, a red-smear cheese. J Dairy Sci. 2007;90:2200–2210. doi: 10.3168/jds.2006-377. [DOI] [PubMed] [Google Scholar]
- 51.Rehn U, Vogensen F, Persson S, Saeden K, Nilsson B, Ardo Y. Influence of microflora on texture and contents of amino acids, organic acids, and volatiles in semi-hard cheese made with DL-starter and propionibacteria. Journal of Dairy Science. 2011;94:1098–1111. doi: 10.3168/jds.2010-3146. [DOI] [PubMed] [Google Scholar]
- 52.Ropars J, Cruaud C, Lacoste S, Dupont J. A taxonomic and ecological overview of cheese fungi. Int J Food Microbiol. 2012;155:199–210. doi: 10.1016/j.ijfoodmicro.2012.02.005. [DOI] [PubMed] [Google Scholar]
- 53.Sekiguchi H, Tomioka N, Nakahara T, Uchiyama H. A single band does not alvways represent single bacterial strains in denaturing gradient gel electrophoresis. Biotechnol Lett. 2001;1205:1208. [Google Scholar]
- 54.Tan PST, Poolman B, Konings WN. Proteolytic enzymes of Lactococcus lactis. J Dairy Res. 1993;60:269–286. doi: 10.1017/S0022029900027606. [DOI] [PubMed] [Google Scholar]
- 55.Zoetendal E, Akkermans ADL, de Vos WM. Temperature gradient gel electrophoresis analysis of 16S rRNA from human fecal samples reveals stable and host-specific communities of active bacteria. Appl Environ Microbiol. 1998;64:3854–3859. doi: 10.1128/aem.64.10.3854-3859.1998. [DOI] [PMC free article] [PubMed] [Google Scholar]