

Abstract
In 2010, the authors published a hypothetical model of the major biomarkers of Alzheimer’s disease (AD). The model was received with interest because we described the temporal evolution of AD biomarkers in relation to each other and to the onset and progression of clinical symptoms. In the interim, evidence has accumulated that supports the major assumptions of this model. Evidence has also appeared that challenges some of the assumptions underlying our original model. Recent evidence has allowed us to modify our original model. Refinements include indexing subjects by time rather than clinical symptom severity; incorporating inter-subject variability in cognitive response to the progression of AD pathophysiology; modifications of the specific temporal ordering of some biomarkers; and, recognition that the two major proteinopathies underlying AD biomarker changes, Aβ and tau, may be initiated independently in late onset AD where we hypothesize that an incident Aβopathy can accelerate an antecedent tauopathy.
Introduction
The authors proposed a model of Alzheimer’s disease (AD) biomarkers that was intended to be a framework for in vivo staging of AD. The model focused on the 5 most well-established biomarkers of AD which we propose can be divided into two major categories:
Measures of brain Aβ deposition: These are cerebrospinal fluid (CSF) Aβ42 1–5 and position emission tomography (PET) amyloid imaging 6–8.
Measures of neurodegeneration where neurodegeneration is defined as progressive loss of neurons or their processes (axons and dendrites) with a corresponding progressive impairment in neuronal function. These are increased levels of CSF total (t-tau) and phosphorylated (p-tau) tau 2, 4, 5, 9, hypo metabolism on FDG PET10 and atrophy on structural MRI 11–16. FDG PET and MRI follow a modality specific topology that is characteristic of AD.
The model was initially presented at the International Conference on Alzheimer’s Disease in July 200917 and published in the January 2010 issue of Lancet Neurology 18. It was based on evidence available at the time with the assumption that empirical evaluation was needed. The purpose of this update is to review evidence addressing our model that has accumulated since it was published and to propose modifications to the original model based on these new data.
Our Original Model – Lancet Neurology 2010
Our AD biomarker model is predicated on the assumption that biomarkers reflect specific pathophysiological processes. This is supported by various biomarker-autopsy correlation studies. Low CSF Aβ42 19, 20 and uptake of amyloid PET tracers 21–24 correlate with fibrillar Aβ deposits. It is difficult to disambiguate CSF tau and Aβ42 to neuropathology correlations because unlike imaging, region to region correlations are not possible. Elevations in t-tau 20 and p-tau 20, 25 correlate with neurofibrillary tangle (NFT) burden at autopsy, and in AD p-tau and t-tau have very similar behavior 2, 26, 27. Atrophy on MRI correlates with both neuron loss 28, 29 and Braak NFT stage 30–33, and does not correlate with Aβ load measured by immunohistology34. Thus MRI is a measure of tau related neurodegeneration. Antemortem FDG hypometabolism is also correlated to NFT burden and not to plaque burden at autopsy 35.
Our original AD biomarker model was intended to incorporate the following principles that data available at the time suggested were true.
The major AD biomarkers become abnormal in a temporally ordered manner36–40. CSF Aβ42 and amyloid PET are dynamic earliest followed by CSF tau and FDG PET, then structural MRI, followed by clinical symptoms. Aβ biomarkers were denoted as upstream and neurodegenerative biomarkers as downstream. The 2010 model (like our updated model) does not propose that one biomarker changes and then stops, then the next one changes and then stops, etc. Rather the model assumes that the maximum rate of change moves sequentially from one biomarker class to the next, and, as the disease progresses all biomarkers become progressively more abnormal simultaneously, albeit at rates that change over time in an ordered manner.
Aβ dysregulation, which leads to plaque formation, is necessary but not sufficient to produce the clinical AD syndrome. Cognitive decline is only loosely coupled to the rate or magnitude of amyloid PET and CSF Aβ4239, 40, but is closely coupled to the magnitude and rate of neurodegenerative biomarkers 41–43. This is true not only in typical AD but also in atypical AD syndromes 44, 45.
Rates of alteration in each biomarker follow a non-linear temporal course 46, 47, which we hypothesized to be sigmoid shaped with time.
A subject-specific lag in time exists between biomarker evidence of AD pathophysiology and the emergence of cognitive impairment which is likely mediated by differences in brain resiliency or cognitive reserve 48.
The added contributions of other brain pathophysiologies (vascular disease, Lewy bodies, TDP-43 inclusions, etc.) that commonly co-occur in aging also contribute significantly to inter-individual variations in clinical disease expression 49.
The biomarker model was summarized by a diagram (reproduced in Figure 1 18) showing all biomarker values for a single prototypical individual with the vertical axis representing severity of biomarker abnormality and the horizontal axis representing progression along the AD pathophysiological pathway.
Figure 1. Original Dynamic biomarkers of the AD pathological cascade model – 2010.
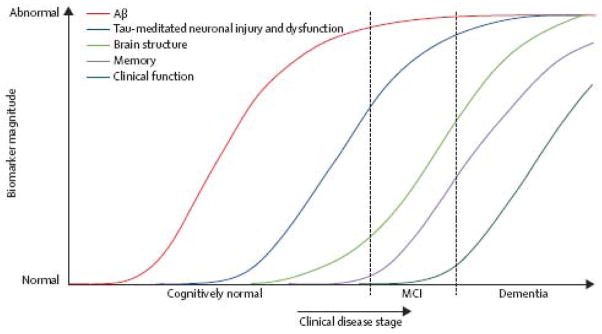
Aβ amyloid is identified by CSF Aβ42 or PET amyloid imaging. Neuronal injury and dysfunction is identified by CSF tau or FDG-PET. Neurodegenerative atrophy is measured by structural MRI. Reproduced from Jack et al 18.
Empirical testing of basic features of the model can be approached along 2 lines – one, addressing the order in which different biomarkers become abnormal with disease progression over time, and the other, addressing the shapes of the biomarker curves as a function of these same disease and temporal parameters. Below we review recent studies that address these features of our model.
Recent evidence concerning the order in which biomarkers become abnormal
Buchave et al 26 followed 137 individual subjects for an average of 9.2 years after a baseline CSF analysis. All subjects carried a diagnosis of mild cognitive impairment (MCI) at baseline and progressed to a diagnosis of AD dementia. They found that CSF Aβ42 was fully abnormal 5–10 years or more prior to dementia diagnosis. In contrast, both CSF t-tau and p-tau became progressively more abnormal as the time to diagnosis of dementia decreased. P-tau and t-tau behaved identically over time. Figure 2 is reproduced from Buchave et al 26.
Figure 2. Temporal ordering of CSF biomarkers.

Mean baseline levels of CSFAβ42 (A), P-tau (B), and t-tau (C) stratified into patients with MCI who developed AD dementia within 0 to 2.5 years (n=28), 2.5 to 5 years (n=32), and 5 to 10 years (n=12). Biomarker levels in a cognitively healthy control group are also given. Levels of Aβ42 did not differ among any of the MCI-AD groups with different intervals to AD dementia. Levels of t-tau and P-tau were significantly lower in late converters (5–10 years) compared with very early converters (0–2.5 years). Error bars represent the SEM. Reproduced with permission from Buchhave et al 26.
The authors evaluated temporal ordering of CSF biomarkers and structural MRI in 401 elderly cognitively normal (CN), MCI and AD dementia subjects from the Alzheimer’s Disease Neuroimaging Initiative (ADNI) 50. Temporal ordering would be implied if one biomarker was abnormal more often than another earlier in the course of the disease. Within each clinical group CSF Aβ42 was abnormal more often than t-tau or hippocampal volume. CSF t-tau was more abnormal than hippocampal volume only within CN subjects (Fig 3) 50.
Figure 3. Evidence for temporal ordering of CSF Aβ42, tau and MRI.

Estimated probability of abnormality for each AD biomarker). The probability of an abnormal biomarker test (point estimate and 95% CI) is shown by clinical diagnosis (i.e. CN, MCI, or AD) (A) and Mini-Mental State Examination (MMSE) score (B). The cutoffs used are 192 pg/mL for the CSF Aβ42 level, 93 pg/mL for the CSF total tau level (t-tau), and 0.48 for the adjusted hippocampal volume (HVa). Reproduced with permission from Jack et al50.
Lo et al 51 examined rates of change in CSF Aβ42, FDG uptake, and hippocampal volume in 819 ADNI subjects. They concluded that the longitudinal biomarker patterns support a sequence in which amyloid deposition is an early event that precedes hypometabolism or hippocampal atrophy.
Forster et al 52 followed 20 mild AD subjects with longitudinal FDG PET and amyloid PET. They found little change in the anatomic extent of amyloid PET over time, whereas FDG PET hypometabolism expanded significantly. They concluded that by the time subjects were demented, amyloid deposition was relatively static while the expansion of FDG hypometabolism was an ongoing process.
Landau et al 53 examined associations between amyloid PET, hypometabolism on FDG PET, and retrospective longitudinal cognitive measurements in 426 ADNI subjects. They concluded that “amyloid deposition has an early and subclinical impact on cognition that precedes metabolic changes,” and that hypometabolism becomes more pronounced later in the course of the disease when it is closely linked temporally to overt cognitive symptoms.
Recent reports from the dominantly inherited Alzheimer’s network (DIAN) 54 and studies in Columbian kindred carriers of a PS1 mutation 55 support the concept of a protracted preclinical period during which time biomarkers become abnormal sequentially while subjects remain clinically asymptomatic. In addition, the DIAN results suggest that CSF Aβ42 may become abnormal before amyloid PET with CSF Aβ42 initially starting at high levels followed by a progressive decline 54. DIAN results also suggest that tau becomes abnormal before FDG PET and that FDG PET and MRI become abnormal in close temporal proximity to each other (Fig 4) 54.
Figure 4.
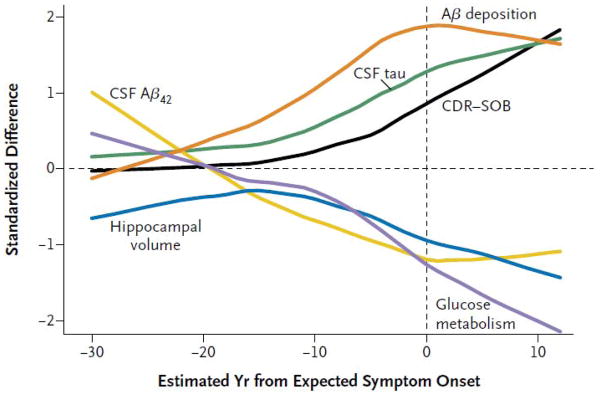
Cross sectional data from the DIAN study indicating temporal ordering of biomarkers in subjects harboring autosomal dominant mutations. Temporal ordering is inferred by anchoring each subject’s current age to the age of dementia onset in his/her affected parent. The proposed order in which biomarkers become abnormal is, CSF Aβ42, amyloid PET, CSF tau, FDG PET and structural MRI, followed by clinical symptoms. Reproduced with permission from Bateman et al54.
In summary, the evidence reviewed above that has accumulated since our model18 was first published clearly supports the general temporal ordering framework of our model where amyloid biomarkers become abnormal first then biomarkers of neurodegeneration, followed by clinical symptoms.
Recent evidence concerning the shapes of biomarker curves
In our model 18, we proposed that AD biomarker curves assume a sigmoidal shape as a function of time. A sigmoid shape implies an initial period of acceleration and later deceleration. Our reasoning was based on imaging, biofliud39, 56 and autopsy 36 data available at the time. Following publication of our model in 2010, several studies have evaluated the shape of biomarker curve trajectories in populations.
Caroli, et al57 analyzed cross-sectional data in 576 ADNI subjects. They found that baseline hippocampal volume, CSF Aβ42, and CSF tau data were better modeled as a function of worsening cognition with sigmoid-shaped curves compared to linear fits.
Sabuncu, et al58 and Schuff et al 59 independently examined brain atrophy rates in ADNI participants. Both found that atrophy rates in some brain regions exhibit early acceleration followed by deceleration which is consistent with a sigmoid shaped trajectory, however rates of change in other areas did not seem to plateau. Both emphasized that atrophy does not affect all areas of the brain simultaneously but rather in a staged manner.
Several of us recently evaluated the shapes of the trajectories of CSF Aβ42 and t-tau; amyloid and FDG PET imaging, and structural MRI in 897 subjects from the Mayo Clinic Study of Aging and ADNI combined 60. In at least one of several models we evaluated, baseline adjusted hippocampal volume, amyloid PET and FDG PET data showed evidence of reaching a plateau as MMSE worsened, which is consistent with a sigmoid shaped trajectory.
We modeled the temporal trajectory of Aβ amyloid accumulation using serial amyloid PET imaging in 260 subjects spanning the cognitive continuum from the Mayo Clinic61. We found a sigmoidal relationship between amyloid load and time. The same finding was recently reported from the Australian Imaging, Biomarkers and Lifestyle study of aging 62. Thus a sigmoid shaped trajectory with respect to time was replicated in two large independent cohorts using different amyloid PET ligands.
In summary, evidence from several sources indicates that amyloid biomarkers do follow a sigmoid shaped trajectory over time and approach a plateau. There is some evidence that FDG PET and some MRI atrophy measures follow a sigmoid shaped trajectory. Some of the evidence cited above implies that in our original model the MRI and FDG curves should have been constructed with slopes that are not parallel to the amyloid biomarker curve and continue to change significantly through the dementia phase of the disease (Fig 1).
The sigmoid curves our model proposes for AD biomarker changes are reminiscent of sigmoidal curves for in vitro tau 63 and Aβ peptide 64 amyloid fibrillization assays, which prompts the intriguing speculation that these biomarker changes reflect the pathological formation of tau and Aβ amyloid fibrils.
Challenges encountered in empirical testing of our model
Modeling AD in elderly populations where non-AD pathophysiology is common
Our hypothetical model 18 was intended to model pure AD which in late onset disease is most likely an abstraction as AD pathophysiology usually co-exists with other pathologies particularly cerebrovascular disease and synucleinopathy although hippocampal sclerosis, TDP-43 and potentially non-AD tauopathies such as agyrophyllic grain disease are also important contributors 65–70. Non-AD pathophysiology presents two closely related conceptual challenges to empiric AD biomarker modeling in the elderly; 1), the high prevalence of elderly individuals with 2 or more co-occurring pathophysiological processes one of which is AD; 2), the presence of individuals who have predominately a non-AD pathophysiological process. One solution to the confounding problem of non-AD pathophysiologies in elderly cohorts 50, 58, 60, 71 is to analyze the subset of participants who are AD biomarker positive in order to screen out subjects who are not in the AD pathophysiological pathway. That approach does suggest the need for different thresholds for biomarker positivity, lenient thresholds to identify subjects who have just entered the AD pathway, and more stringent thresholds for clinical use as diagnostics 72.
Definition of the vertical axis: scaling biomarker abnormalities
Our model 18 was designed to have quantifiable horizontal and vertical axes (Fig 1) – thus permitting empirical testing of its validity. We constructed the vertical axis on a minimum to maximum scale (Fig 1), so that each biomarker is scaled in relation to its own full dynamic range from values found in completely unaffected individuals to maximally abnormal values. This approach will work well if subjects in end stage dementia are studied.
Definition of the horizontal axis
Identifying appropriate units for the horizontal axis has been problematic in empiric testing. In our original model we placed progressive clinical disease stage on the horizontal axis (Fig 1). While it is certainly true that every subject who develops AD dementia exhibits progressive cognitive decline, indexing subjects on the horizontal axis by clinical disease stage or continuous measures of cognitive impairment has proved to be a flawed approach for several reasons. 1) Important pathophysiological changes occur in the preclinical phase which may constitute half or more of the total disease duration and it is in the preclinical stage that measures of cognitive decline are most imprecise. 2) Inter-subject variation in cognitive reserve obscures the relationship between pathophysiological severity and cognitive performance 73–78. 3) Cognitive impairment in the elderly occurs in the context of other common age related brain pathologies and non-AD pathophysiologies modulate the specific relationship between AD pathophysiology and cognitive impairment in unpredictable ways on an individual basis.
Possible solutions to forming the horizontal axis: “distance traveled along the pathophysiological pathway”
The ideal data set with which to model AD biomarker trajectories would consist of all biomarkers obtained at multiple sampling points in many representative individuals followed prospectively for decades beginning in middle age. It will take decades to acquire these data. In the interim, modeling will have to be performed in a piece-wise fashion from data in individual subjects who are at various stages in the disease. In order of increasing validity such approaches include: purely cross sectional data; cross sectional imaging with longitudinal clinical follow up; short term (3–5 years) concurrent serial imaging and clinical assessments. All of these approaches require that individual subjects’ data be placed in an appropriate order along a logical notion of the distance traveled along the AD pathophysiological pathway. Some recent examples are discussed below.
Forming the horizontal axis as time in years relative to an anchoring event
Buchhave et al 26 and Knopman et al 79 used an incident clinical diagnosis (of either dementia or MCI) as the anchoring event and then compared biomarker and clinical trajectories in units of time relative to this event. The dominantly inherited Alzheimer’s network study 80 has used the age of onset of dementia in the affected parent as the temporal anchor for mutation carriers thus permitting estimates of the longitudinal behavior of clinical and biomarker metrics prior to estimated onset of symptoms.
Donohue et al 81 modeled long term biomarker trends from short term within subject data in ADNI using shape invariant modeling that places time on the x axis. These methods can model subject-specific rescaling and shifting of time in data sets with no specific common anchoring event such as incident dementia.
Novel composite horizontal axes that capture the latent trait descriptors of the underlying AD pathophysiological process
Jednyak et al 82 and Mungas et al 83 have combined multiple biomarkers in a nonlinear fashion to represent the entire disease spectrum with a single horizontal-axis metric which can be thought of as a latent trait 83. Each biomarker contributes to this single latent trait metric, with greater weighting where it is most dynamic in the disease spectrum.
Model Revision
Figure 5 is a revised version of our original 2010 model that incorporates new findings and also addresses some of the shortcomings described in the preceding paragraphs. While our revised model (Fig 5) has many similarities with our 2010 model (Fig 1), differences do exist. These are:
Figure 5. Revised dynamic biomarkers of the AD pathological cascade model – 2012.

For both Figures 5a and 5b, Aβ amyloid is identified by CSF Aβ42 (purple) or PET amyloid imaging (red). Elevated CSF tau (blue). Neurodegeneration is measured by FDG PET and structural MRI respectively which are drawn concordantly (orange). By definition, all curves converge at the top right-hand corner of the plot, the point of maximum abnormality. The horizontal axis of disease progression is expressed as time. Cognitive response is illustrated as a zone (green filled area) with low and high risk boarders. Figure 5b, illustrates operational use of this model. The vertical black line denotes a given time (T). Projection of the intersection of time T with the biomarker curves to the left vertical axis (horizontal dashed arrows) gives values of each biomarker at time T, with the lead biomarker (CSF Aβ42) being most abnormal at any given time in the progression of the disease. Intersection of time T with the cognitive impairment zone gives cognitive impairment at that fixed point in time. Subjects who are at high risk of cognitive impairment due to AD pathophysiology are shown with a cognitive response curve that is shifted to the left. In contrast, the cognitive response curve is shifted to the right in subjects with a protective genetic profile, high cognitive reserve and the absence of comorbid brain pathologies – illustrating that two subjects with the same biomarker profile (at time T) can have different cognitive outcomes (denoted by yellow circles at the intersection of time T and low vs. high risk cognitive profiles).
In our revised model (Fig 5) the horizontal axis is expressed as time, not clinical disease stage. The absolute time in years required to traverse the disease pathway from left to right as well as the specific age at which a person enters the disease pathway will vary among individuals.
A range of possible cognitive outcomes is illustrated at given positions along the horizontal axis. This reflects the fact that individual subjects respond to AD pathophysiology uniquely75, 76. Subjects who are at high risk of cognitive impairment due to AD pathophysiology are shown in both panels of Figure 5 with a cognitive response curve that is shifted to the left in time. Such high-risk subjects may harbor more genetic risk alleles, have low cognitive reserve, pursue lifestyles that increase the likelihood for cognitive impairment or have other co-morbid brain pathologies. In contrast, low-risk subjects with a protective genetic profile, high cognitive reserve and the absence of co-morbid brain pathologies and low lifestyle risks for dementia can co-exist with substantial AD pathophysiology and still maintain normal cognitive function. Thus cognitive response in Figure 5 is illustrated as a zone with low and high risk borders.
The revised model includes modifications of the specific ordering of some biomarkers based on recent reports described above. CSF Aβ42 has been moved before amyloid PET, which is followed by CSF tau. FDG PET and MRI are drawn coincidentally as the last biomarkers to become abnormal, but the 2 biomarkers that track most closely with progressive cognitive impairment.
All biomarkers are still configured as sigmoids, but the shapes of the sigmoid curves are no longer identical. The curves have a progressively steeper slope in the right-hand tail for later changing biomarkers.
The biomarker curves are drawn closer together indicating less distinct temporal separation.
Biomarkers vs. histopathology: Autopsy evidence that tau pathophysiology can precede AB
Ours is a model of the temporal evolution of AD biomarkers in relation to each other and to the progression of clinical symptoms. While biomarkers do reflect the specific pathophysiological processes that they measure, the sensitivity of histopathological assays is almost certainly greater than that of in vivo biomarkers. This review addresses three different concepts that should be kept distinct: biomarkers of AD pathophysiology; histopathology that can be measured at autopsy; and, pathophysiological processes that are not accurately measureable yet with either biomarkers or histopathology, e.g. detection of various oligomeric forms of Aβ.
One of the most important criticisms of our AD biomarker model was that it failed to account for the fact that tau pathology appears at a younger age than Aβ amyloid plaques in some individuals 84. Indeed, since our model was published, Braak and Del Tredici85 published a study using AT8 immunostaining in autopsy cases under 30 years old. AT8 is a phosphorylation specific anti-tau monoclonal antibody that recognizes pathologically phosphorylated tau at Ser202. AT8 positive pretangles (i.e. positively stained perikarya) were found in a high proportion of young individuals (as young as 6 years old) in select subcortical and brainstem nuclei and the entorhinal cortex. Based on youngest age of appearance, Braak and Del Tredici85 propose that the location where tau pathology begins is the locus coeruleus. It then spreads to other brainstem nuclei and to the entorhinal cortex, perhaps by direct cell-to-cell transmission 86, 87.
Braak and Del Tredici85 therefore propose that subcortical tau deposition is the starting point of the AD pathophysiological cascade, beginning as early as the first decade of life. An alternative point of view, however, posits that since the AT8 staining tauopathy occurs in such a high proportion of clinically asymptomatic young individuals, this does not represent the beginning of the AD pathophysiological cascade, but instead a variant of aging that does not inevitably lead to cognitive impairment. Or it may lead to subtle cognitive impairment but not AD dementia.
The amyloid hypothesis 88 assumes serial causal events, with abnormal elevations in Aβ causing tau hyperphosphorylation89. Small and Duff 89, however, have suggested that tau hyper-phosphorylation and Aβ elevation may be independent pathophysiological processes that share a common upstream etiology. Mesulam90 specifically suggested that prolonged exposure to upregulation of cellular activity related to neural plasticity could represent the common upstream etiology for both tau hyper-phosphorylation and Aβ elevation. In an editorial accompanying the Braak and Del Tredici85 paper, Duyckaerts91 also suggested that tau and Aβ could be independent processes, but with pathogenic synergy.
Model incorporating tau and Aβ as independent processes
We have 2 sets of evidence that on the surface seem contradictory: 1) multiple independent sources of AD biomarker evidence in the elderly and in young mutation carriers indicating that the sequence of events depicted by these biomarkers is Aβ pathophysiology first, then tau related neurodegeneration, 2) autopsy data 85 in young individuals indicating that AD-like tauopathy precedes Aβ deposition. One way to integrate these apparently conflicting data into a coherent model of disease is a variation on the theme of tauopathy and Aβopathy arising independently. This model requires recognition that the earliest evidence of AD pathophysiology lies beneath the detection threshold of every in vivo AD biomarker. In this proposed model, which is illustrated in Figure 6, subcortical tauopathy is the first AD pathophysiology to appear in some individuals and it is currently detectable only by immunostaining methods. This tauopathy alone however does not by itself lead to AD dementia. Aβopathy arises later and independent from this pre-existing tauopathy. Through unknown mechanisms Aβ pathophysiology qualitatively transforms and accelerates the antecedent tauopathy leading to neocortical spread of neurofibrillary tangles. Departure of the initial tauopathy trajectory then occurs after Aβ biomarkers markers become abnormal. FDG PET and MRI biomarker changes and then overt clinical symptoms follow the accelerated abnormal trajectory of tau.
Figure 6. Model integrating AD immuno-hisotology and biomarkers.

The threshold for biomarker detection of pathophysiology is denoted by a horizontal line. The grey area denotes the zone in which abnormal pathophysiology lies below the biomarker detection threshold. In this illustration, tau pathology precedes Aβ amyloid deposition in time – but early on exists at a subthreshold biomarker detection level. Aβ amyloid deposition then occurs independently and rises above biomarker threshold detection (purple and red arrows). This induces acceleration of tauopathy with CSF tau then rising above threshold level (blue arrow). Later still, FDG PET and MRI (orange arrow) rise above threshold detection level. Finally, cognitive impairment becomes evident (green arrow), with a range of cognitive responses that depend on the individual’s risk profile (green filled area).
In the elderly the theme of tauopathy and Aβopathy as independent processes with a common causal factor is consistent with the notion of a general age-related failure to clear misfolded proteins, a failure of protective mechanisms to sequester toxic soluble forms of these proteins, or both. However, we propose in Figure 6 that an independently arising Aβopathy can accelerate an antecedent tauopathy based on the following observations. The fact that genetically determined Aβ over production leads to fully developed AD 92 whereas genetically determined tauopathies do not 93 does support a causal, initiating role for Aβ and not tau in early onset AD. In addition, a recently discovered coding mutation in the amyloid precursor protein gene protects against late onset AD 94. Therefore, the case for causality points to Aβ as the disease initiator in early onset AD, and in a subject-specific manner as either the initiator or an accelerator in late onset AD. We do not propose that all late onset cases follow the pattern outlined in Figure 6. Rather, that at least 2 pathways to late onset AD exist – one as illustrated in Figure 5 and the other in Figure 6.
Biomarkers that precede Aβ
An important direction that biomarker research is taking is the search for biomarker abnormalities that temporally precede Aβ amyloid biomarkers. There is evidence that FDG PET hypometabolism in an AD-like pattern occurs in some APOE4 carriers in middle age and young adults95, 96. The presumption is that this reflects an effect of APOE4 on glucose metabolism that temporally precedes amyloid deposition. This must be tempered, however, with more recent data indicating that FDG PET is a later changing biomarker than amyloid PET or CSF AB42 51–54.While APOE4 is known to increase risk and the amount of Aβ accumulation, and lower the age at which Aβ amyloid deposition appears 97, 98, APOE4 has also been linked to mechanisms that are unrelated to amyloid deposition 99, 100.
Recently studies have focused on functional MRI as a tool to probe relationships between synaptic activity and features of AD. Task free functional MRI (TF-fMRI) is particularly appealing because measures of functional connectivity and network dynamics are obtained without administering a functional activation task (which requires specialized equipment that is not available at many MRI centers). Both Mesulam90 and Buckner et al 101 have proposed pathophysiological models relating the long term demands of cognitive activity to AD pathophysiology 90 and imaging changes 101, thus providing a mechanistic link between the physiologic processes interrogated by TF-fMRI and AD pathophysiology. TF-fMRI disturbances in the task-negative (i.e., default mode) and task-positive functional networks have been described in AD dementia and MCI 102–105, in elderly cognitively normal APOE ε4 carriers, and in cognitively normal subjects who are amyloid positive 106–108. Network disturbances have also been described in middle-aged and elderly cognitively normal subjects who are APOE ε4 carriers but who have normal amyloid PET scans 109, in APOE ε4 carriers in young adulthood (20s)110, and in asymptomatic carriers of autosomal dominate mutations years prior to estimated age of dementia onset 111. Using a functional connectivity optical intrinsic signal imaging technique, Bero et al 112 have demonstrated reduced functional connectivity in young transgenic AD mice in the same topologic locations where amyloid deposits appear later in life. These observations suggest that TF-fMRI may show abnormalities before amyloid biomarkers become abnormal thereby prompting Jagust and Mormino113 to propose a cause and effect relationship between life-long synaptic activity and amyloid deposition in multimodal cortical network hubs. Greater synaptic activity generally leads to greater amyloid deposition; however, this relationship is modulated by inter-individual variation in cognitive reserve and the effects of APOE.
Future directions
The discussion above points out the need for discovery of new biomarkers that would permit testing hypotheses that can now only be framed in theoretical terms. This list includes CSF markers or PET ligands that are sensitive to the AT8 tauopathy described in the young by Braak and Del Tredici85 and PET ligands that measure NFTs and soluble Aβ114. Imaging and or biofliud markers of TDP-43 and α-synuclein, and imaging detection of hippocampal sclerosis and microinfarctions are needed. The absence of reliable plasma biomarkers for any of the above pathophysiological processes is a major hurdle to population screening, but strategies to overcome this limitation may be on the horizon 115.
“AD-signature” topographic patterns of abnormality have been identified for MRI and FDG PET 11, 116–118. However, much biomarker modeling has been done by compressing multi-voxel imaging data into a single value representing the prototypical AD-signature for each imaging modality. Additional research should be devoted to evaluating topographic spread of disease within each imaging modality as a marker of disease stage 119, 120.
In addition to the development of new biomarkers to fill in current gaps in tracking relevant pathophysiological processes, appropriate cohorts for evaluating biomarker evolution are needed. Most large longitudinal cohorts that incorporate AD biomarkers suffer from at least 3 major design limitations. 1) Middle aged individuals are inadequately sampled. Therefore the onset of biomarker abnormalities is not captured in middle age. 2) Individuals in end stage dementia are not included. Therefore the full dynamic range of biomarker abnormities cannot be known. This bias has the particularly insidious effect of selectively truncating the apparent dynamic range of later changing relative to earlier changing biomarkers. 3) Lack of long term within-subject longitudinal data. Most current biomarker modeling studies model long term trends with cross sectional or short term follow up, which leads to conclusions that are dominated by cross sectional trends with the associated biases. Decades-long prospective multimodal observational studies, ideally in representative populations, will be necessary to provide definitive elucidation of the precise sequence and shape of AD biomarker changes. Finally, it will be important to follow as many subjects as possible whose biomarkers are studied during life to autopsy 70.
Search strategy and selection criteria
References for this paper were identified through searches of PubMed between 1984 and August 2012, with combinations of the search terms “Alzheimer’s disease”, “MCI”, “PiB”, “amyloid imaging”, “PET and Alzheimer’s”, “MRI and Alzheimer’s”, and “Alzheimer’s biomarkers”. The search also included papers presented at the 2012 Alzheimer’s Association International Conference. Articles were also identified through searches of the authors’ own files. Only papers published in English were reviewed.
Footnotes
Author contributions
All authors contributed to preparation of this manuscript.
Conflicts of interest
Dr. Jack serves on scientific advisory boards for Elan/Janssen AI, Bristol Meyer Squibb, Eli Lilly & Company, GE Healthcare, Siemens, and Eisai Inc.; receives research support from Baxter International Inc., Allon Therapeutics, Inc., the NIH/NIA, and the Alexander Family Alzheimer’s Disease Research Professorship of the Mayo Foundation; and holds stock in Johnson & Johnson. Dr. Knopman serves as Deputy Editor for Neurology®; served on a data safety monitoring board for Eli Lilly and Company; served as a consultant for Elan/Janssen. Dr. Jagust served as a consultant to GE Healthcare, which manufactures flutemetamol, and collaborates with Avid Radiopharmaceuticals, which manufactures florbetapir, through the Alzheimer’s Disease Neuroimaging Initiative. Dr. Weiner serves on the advisory boards for Elan/Wyeth, Novartis, Banner, Lilly, VACO, Biogen Idec, Araclon and Pfizer; serves as a consultant to Elan/Wyeth, Novartis, Forest, Ispen, Daiichi Sankyo, Inc., Astra Zeneca, Araclon, Pfizer, TauRx Therapeutics LTD, Bayer, Biogen Idec, Exonhit Therapeutics, Servier, Synarc; received honoraria from American Academy of Neurology, ipsen, NeuroVigil, Inc., and Insitut Catala de Neurociencies Aplicades; receives research funding from Merck and Avid; owns stock in Synarc and Elan; and serves on the editorial advisory board for Alzheimer’s and Dementia, and MRI. Dr. Aisen serves on a scientific advisory board for NeuroPhage; serves as a consultant to Elan Corporation, Wyeth, Eisai Inc., Bristol-Myers Squibb, Eli Lilly and Company, NeuroPhage, Merck & Co., Roche, Amgen, Abbott, Pfizer Inc., Novartis, Bayer, Astellas, Dainippon, Biomarin, Solvay, Otsuka, Daiichi, AstraZeneca, Janssen and Medivation Inc.; receives research support from Pfizer Inc., and Baxter International Inc.; and has received stock options from Medivation Inc., and NeuroPhage. Dr. Petersen serves on scientific advisory boards for the Alzheimer’s Association, the National Advisory Council on Aging (NIA), Elan/Janssen AI, Pfizer Inc (Wyeth), and GE Healthcare; receives royalties from publishing Mild Cognitive Impairment (Oxford University Press, 2003); serves as a consultant for Elan/Janssen AI and GE Healthcare; and receives research support from the NIH/NIA. Dr. Shaw serves on the technical advisory board for Saladax Biomedical. Dr. Vemuri, Ms. Wiste, Mr. Weigand, Mr. Lesnick, and Dr. Pankratz report no disclosures. Dr. Trojanowski serves as an Associate Editor of Alzheimer’s & Dementia; may accrue revenue in the future on patents submitted by the University of Pennsylvania wherein he is co-Inventor and he received revenue from the sale of Avid to Eli Lily as co-inventor on imaging related patents submitted by the University of Pennsylvania; receives research support from the NIH, Bristol Myer Squib, AstraZenica and several non-profits. Dr. Donohue has served as consultant to Bristol-Meyers Squibb.
Publisher's Disclaimer: This is a PDF file of an unedited manuscript that has been accepted for publication. As a service to our customers we are providing this early version of the manuscript. The manuscript will undergo copyediting, typesetting, and review of the resulting proof before it is published in its final citable form. Please note that during the production process errors may be discovered which could affect the content, and all legal disclaimers that apply to the journal pertain.
References
- 1.Fagan AM, Roe CM, Xiong C, Mintun MA, Morris JC, Holtzman DM. Cerebrospinal fluid tau/beta-amyloid(42) ratio as a prediction of cognitive decline in nondemented older adults. Arch Neurol. 2007;64:343–349. doi: 10.1001/archneur.64.3.noc60123. [DOI] [PubMed] [Google Scholar]
- 2.Shaw LM, Vanderstichele H, Knapik-Czajka M, et al. Cerebrospinal fluid biomarker signature in Alzheimer’s disease neuroimaging initiative subjects. Ann Neurol. 2009;65:403–413. doi: 10.1002/ana.21610. [DOI] [PMC free article] [PubMed] [Google Scholar]
- 3.Li G, Sokal I, Quinn JF, et al. CSF tau/Abeta42 ratio for increased risk of mild cognitive impairment: a follow-up study. Neurology. 2007;69:631–639. doi: 10.1212/01.wnl.0000267428.62582.aa. [DOI] [PubMed] [Google Scholar]
- 4.Mattsson N, Zetterberg H, Hansson O, et al. CSF biomarkers and incipient Alzheimer disease in patients with mild cognitive impairment. JAMA. 2009;302:385–393. doi: 10.1001/jama.2009.1064. [DOI] [PubMed] [Google Scholar]
- 5.Visser PJ, Verhey F, Knol DL, et al. Prevalence and prognostic value of CSF markers of Alzheimer’s disease pathology in patients with subjective cognitive impairment or mild cognitive impairment in the DESCRIPA study: a prospective cohort study. Lancet Neurol. 2009;8:619–627. doi: 10.1016/S1474-4422(09)70139-5. [DOI] [PubMed] [Google Scholar]
- 6.Klunk WE, Engler H, Nordberg A, et al. Imaging brain amyloid in Alzheimer’s disease with Pittsburgh Compound-B. Ann Neurol. 2004;55:306–319. doi: 10.1002/ana.20009. [DOI] [PubMed] [Google Scholar]
- 7.Rowe CC, Ellis KA, Rimajova M, et al. Amyloid imaging results from the Australian Imaging, Biomarkers and Lifestyle (AIBL) study of aging. Neurobiol Aging. 2010;31:1275–1283. doi: 10.1016/j.neurobiolaging.2010.04.007. [DOI] [PubMed] [Google Scholar]
- 8.Villemagne VL, Pike KE, Chetelat G, et al. Longitudinal assessment of Abeta and cognition in aging and Alzheimer disease. Ann Neurol. 2011;69:181–192. doi: 10.1002/ana.22248. [DOI] [PMC free article] [PubMed] [Google Scholar]
- 9.Fagan AM, Head D, Shah AR, et al. Decreased cerebrospinal fluid Abeta(42) correlates with brain atrophy in cognitively normal elderly. Ann Neurol. 2009;65:176–183. doi: 10.1002/ana.21559. [DOI] [PMC free article] [PubMed] [Google Scholar]
- 10.Jagust WJ, Bandy D, Chen K, et al. The Alzheimer’s Disease Neuroimaging Initiative positron emission tomography core. Alzheimers Dement. 2010;6:221–229. doi: 10.1016/j.jalz.2010.03.003. [DOI] [PMC free article] [PubMed] [Google Scholar]
- 11.Dickerson BC, Wolk DA. MRI cortical thickness biomarker predicts AD-like CSF and cognitive decline in normal adults. Neurology. 2012;78:84–90. doi: 10.1212/WNL.0b013e31823efc6c. [DOI] [PMC free article] [PubMed] [Google Scholar]
- 12.Vemuri P, Wiste HJ, Weigand SD, et al. MRI and CSF biomarkers in normal, MCI, and AD subjects: Diagnostic discrimination and cognitive correlations. Neurology. 2009;73:287–293. doi: 10.1212/WNL.0b013e3181af79e5. [DOI] [PMC free article] [PubMed] [Google Scholar]
- 13.Desikan RS, Cabral HJ, Hess CP, et al. Automated MRI measures identify individuals with mild cognitive impairment and Alzheimer’s disease. Brain. 2009;132:2048–2057. doi: 10.1093/brain/awp123. [DOI] [PMC free article] [PubMed] [Google Scholar]
- 14.DeCarli C, Frisoni GB, Clark CM, et al. Qualitative estimates of medial temporal atrophy as a predictor of progression from mild cognitive impairment to dementia. Arch Neurol. 2007;64:108–115. doi: 10.1001/archneur.64.1.108. [DOI] [PubMed] [Google Scholar]
- 15.Grundman M, Sencakova D, Jack CR, Jr, et al. Brain MRI hippocampal volume and prediction of clinical status in a mild cognitive impairment trial. J Mol Neurosci. 2002;19:23–27. doi: 10.1007/s12031-002-0006-6. [DOI] [PubMed] [Google Scholar]
- 16.Fleisher A, Grundman M, Jack CR, Jr, et al. Sex, apolipoprotein E epsilon 4 status, and hippocampal volume in mild cognitive impairment. Arch Neurol. 2005;62:953–957. doi: 10.1001/archneur.62.6.953. [DOI] [PubMed] [Google Scholar]
- 17.Jack CR., Jr Measuring progression of AD with imaging: Outcome measures for trials. ICAD 2009; 2009; Vienna, Austria. 2009. pp. S1–03. [Google Scholar]
- 18.Jack CR, Jr, Knopman DS, Jagust WJ, et al. Hypothetical model of dynamic biomarkers of the Alzheimer’s pathological cascade. Lancet Neurol. 2010;9:119–128. doi: 10.1016/S1474-4422(09)70299-6. [DOI] [PMC free article] [PubMed] [Google Scholar]
- 19.Strozyk D, Blennow K, White LR, Launer LJ. CSF Abeta 42 levels correlate with amyloid-neuropathology in a population-based autopsy study. Neurology. 2003;60:652–656. doi: 10.1212/01.wnl.0000046581.81650.d0. [DOI] [PubMed] [Google Scholar]
- 20.Tapiola T, Alafuzoff I, Herukka SK, et al. Cerebrospinal fluid {beta}-amyloid 42 and tau proteins as biomarkers of Alzheimer-type pathologic changes in the brain. Arch Neurol. 2009;66:382–389. doi: 10.1001/archneurol.2008.596. [DOI] [PubMed] [Google Scholar]
- 21.Ikonomovic MD, Klunk WE, Abrahamson EE, et al. Post-mortem correlates of in vivo PiB-PET amyloid imaging in a typical case of Alzheimer’s disease. Brain. 2008;131:1630–1645. doi: 10.1093/brain/awn016. [DOI] [PMC free article] [PubMed] [Google Scholar]
- 22.Kantarci K, Yang C, Schneider JA, et al. Ante mortem amyloid imaging and beta-amyloid pathology in a case with dementia with Lewy bodies. Neurobiol Aging. 2010;33:878–885. doi: 10.1016/j.neurobiolaging.2010.08.007. [DOI] [PMC free article] [PubMed] [Google Scholar]
- 23.Fleisher AS, Chen K, Liu X, et al. Using positron emission tomography and florbetapir F18 to image cortical amyloid in patients with mild cognitive impairment or dementia due to Alzheimer disease. Arch Neurol. 2011;68:1404–1411. doi: 10.1001/archneurol.2011.150. [DOI] [PubMed] [Google Scholar]
- 24.Sojkova J, Driscoll I, Iacono D, et al. In vivo fibrillar beta-amyloid detected using [11C]PiB positron emission tomography and neuropathologic assessment in older adults. Arch Neurol. 2011;68:232–240. doi: 10.1001/archneurol.2010.357. [DOI] [PMC free article] [PubMed] [Google Scholar]
- 25.Buerger K, Ewers M, Pirttila T, et al. CSF phosphorylated tau protein correlates with neocortical neurofibrillary pathology in Alzheimer’s disease. Brain. 2006;129:3035–3041. doi: 10.1093/brain/awl269. [DOI] [PubMed] [Google Scholar]
- 26.Buchhave P, Minthon L, Zetterberg H, Wallin AK, Blennow K, Hansson O. Cerebrospinal Fluid Levels of beta-Amyloid 1–42, but Not of Tau, Are Fully Changed Already 5 to 10 Years Before the Onset of Alzheimer Dementia. Arch Gen Psychiatry. 2012;69:98–106. doi: 10.1001/archgenpsychiatry.2011.155. [DOI] [PubMed] [Google Scholar]
- 27.Fagan AM, Mintun MA, Shah AR, et al. Cerebrospinal fluid tau and ptau(181) increase with cortical amyloid deposition in cognitively normal individuals: implications for future clinical trials of Alzheimer’s disease. EMBO Mol Med. 2009;1:371–380. doi: 10.1002/emmm.200900048. [DOI] [PMC free article] [PubMed] [Google Scholar]
- 28.Bobinski M, de Leon MJ, Wegiel J, et al. The histological validation of post mortem magnetic resonance imaging-determined hippocampal volume in Alzheimer’s disease. Neuroscience. 2000;95:721–725. doi: 10.1016/s0306-4522(99)00476-5. [DOI] [PubMed] [Google Scholar]
- 29.Zarow C, Vinters HV, Ellis WG, et al. Correlates of hippocampal neuron number in Alzheimer’s disease and ischemic vascular dementia. Ann Neurol. 2005;57:896–903. doi: 10.1002/ana.20503. [DOI] [PMC free article] [PubMed] [Google Scholar]
- 30.Jack CR, Jr, Dickson DW, Parisi JE, et al. Antemortem MRI findings correlate with hippocampal neuropathology in typical aging and dementia. Neurology. 2002;58:750–757. doi: 10.1212/wnl.58.5.750. [DOI] [PMC free article] [PubMed] [Google Scholar]
- 31.Vemuri P, Whitwell JL, Kantarci K, et al. Antemortem MRI based STructural Abnormality iNDex (STAND)-scores correlate with postmortem Braak neurofibrillary tangle stage. Neuroimage. 2008;42:559–567. doi: 10.1016/j.neuroimage.2008.05.012. [DOI] [PMC free article] [PubMed] [Google Scholar]
- 32.Whitwell JL, Dickson DW, Murray ME, et al. Neuroimaging correlates of pathologically defined subtypes of Alzheimer’s disease: a case-control study. Lancet Neurol. 2012;11:868–877. doi: 10.1016/S1474-4422(12)70200-4. [DOI] [PMC free article] [PubMed] [Google Scholar]
- 33.Whitwell JL, Josephs KA, Murray ME, et al. MRI correlates of neurofibrillary tangle pathology at autopsy: a voxel-based morphometry study. Neurology. 2008;71:743–749. doi: 10.1212/01.wnl.0000324924.91351.7d. [DOI] [PMC free article] [PubMed] [Google Scholar]
- 34.Josephs KA, Whitwell JL, Ahmed Z, et al. Beta-amyloid burden is not associated with rates of brain atrophy. Ann Neurol. 2008;63:204–212. doi: 10.1002/ana.21223. [DOI] [PMC free article] [PubMed] [Google Scholar]
- 35.DeCarli CS, Atack JR, Ball MJ, et al. Postmortem regional neurofibrillary tangle densities, but not senile plaque densities, are related to regional cerebral metabolic rates for glucose during life in Alzheimer’s disease. Neurodegeneration. 1992;1:113–121. [Google Scholar]
- 36.Ingelsson M, Fukumoto H, Newell KL, et al. Early Abeta accumulation and progressive synaptic loss, gliosis, and tangle formation in AD brain. Neurology. 2004;62:925–931. doi: 10.1212/01.wnl.0000115115.98960.37. [DOI] [PubMed] [Google Scholar]
- 37.Perrin RJ, Fagan AM, Holtzman DM. Multimodal techniques for diagnosis and prognosis of Alzheimer’s disease. Nature. 2009;461:916–922. doi: 10.1038/nature08538. [DOI] [PMC free article] [PubMed] [Google Scholar]
- 38.Mormino EC, Kluth JT, Madison CM, et al. Episodic memory loss is related to hippocampal-mediated beta-amyloid deposition in elderly subjects. Brain. 2009;132:1310–1323. doi: 10.1093/brain/awn320. [DOI] [PMC free article] [PubMed] [Google Scholar]
- 39.Jack CR, Jr, Lowe VJ, Senjem ML, et al. 11C PiB and structural MRI provide complementary information in imaging of Alzheimer’s disease and amnestic mild cognitive impairment. Brain. 2008;131:665–680. doi: 10.1093/brain/awm336. [DOI] [PMC free article] [PubMed] [Google Scholar]
- 40.Jack CR, Jr, Lowe VJ, Weigand SD, et al. Serial PIB and MRI in normal, mild cognitive impairment and Alzheimer’s disease: implications for sequence of pathological events in Alzheimer’s disease. Brain. 2009;132:1355–1365. doi: 10.1093/brain/awp062. [DOI] [PMC free article] [PubMed] [Google Scholar]
- 41.Hyman BT. Amyloid-dependent and amyloid-independent stages of Alzheimer disease. Arch Neurol. 2011;68:1062–1064. doi: 10.1001/archneurol.2011.70. [DOI] [PubMed] [Google Scholar]
- 42.Fox NC, Scahill RI, Crum WR, Rossor MN. Correlation between rates of brain atrophy and cognitive decline in AD. Neurology. 1999;52:1687–1689. doi: 10.1212/wnl.52.8.1687. [DOI] [PubMed] [Google Scholar]
- 43.Jack CR, Jr, Petersen RC, Xu Y, et al. Rates of hippocampal atrophy correlate with change in clinical status in aging and AD. Neurology. 2000;55:484–489. doi: 10.1212/wnl.55.4.484. [DOI] [PMC free article] [PubMed] [Google Scholar]
- 44.Rabinovici GD, Jagust WJ, Furst AJ, et al. Abeta amyloid and glucose metabolism in three variants of primary progressive aphasia. Ann Neurol. 2008;64:388–401. doi: 10.1002/ana.21451. [DOI] [PMC free article] [PubMed] [Google Scholar]
- 45.Wolk DA, Price JC, Madeira C, et al. Amyloid imaging in dementias with atypical presentation. Alzheimers Dement. 2012;8:389–398. doi: 10.1016/j.jalz.2011.07.003. [DOI] [PMC free article] [PubMed] [Google Scholar]
- 46.Ridha BH, Barnes J, Bartlett JW, et al. Tracking atrophy progression in familial Alzheimer’s disease: a serial MRI study. Lancet Neurol. 2006;5:828–834. doi: 10.1016/S1474-4422(06)70550-6. [DOI] [PubMed] [Google Scholar]
- 47.Jack CR, Jr, Weigand SD, Shiung MM, et al. Atrophy rates accelerate in amnestic mild cognitive impairment. Neurology. 2008;70:1740–1752. doi: 10.1212/01.wnl.0000281688.77598.35. [DOI] [PMC free article] [PubMed] [Google Scholar]
- 48.Stern Y. Cognitive reserve and Alzheimer disease. Alzheimer Dis Assoc Disord. 2006;20:S69–74. doi: 10.1097/00002093-200607001-00010. [DOI] [PubMed] [Google Scholar]
- 49.Nelson PT, Abner EL, Schmitt FA, et al. Modeling the Association between 43 Different Clinical and Pathological Variables and the Severity of Cognitive Impairment in a Large Autopsy Cohort of Elderly Persons. Brain Pathol. 2010;20:66–79. doi: 10.1111/j.1750-3639.2008.00244.x. [DOI] [PMC free article] [PubMed] [Google Scholar]
- 50.Jack CR, Jr, Vemuri P, Wiste HJ, et al. Evidence for Ordering of Alzheimer Disease Biomarkers. Arch Neurol. 2011;68:1526–1535. doi: 10.1001/archneurol.2011.183. [DOI] [PMC free article] [PubMed] [Google Scholar]
- 51.Lo RY, Hubbard AE, Shaw LM, et al. Longitudinal Change of Biomarkers in Cognitive Decline. Arch Neurol. 2011;68:1257–1266. doi: 10.1001/archneurol.2011.123. [DOI] [PMC free article] [PubMed] [Google Scholar]
- 52.Forster S, Grimmer T, Miederer I, et al. Regional expansion of hypometabolism in Alzheimer’s disease follows amyloid deposition with temporal delay. Biol Psychiatry. 2012;71:792–797. doi: 10.1016/j.biopsych.2011.04.023. [DOI] [PubMed] [Google Scholar]
- 53.Landau SM, Mintun MA, Joshi AD, et al. Amyloid deposition, hypometabolism, and longitutdinal cognitive decline. Accepted for publication in Annals of Neurology. doi: 10.1002/ana.23650. In Press. [DOI] [PMC free article] [PubMed] [Google Scholar]
- 54.Bateman RJ, Xiong C, Benzinger TL, et al. Clinical and Biomarker Changes in Dominantly Inherited Alzheimer’s Disease. N Engl J Med. 2012;367:795–804. doi: 10.1056/NEJMoa1202753. [DOI] [PMC free article] [PubMed] [Google Scholar]
- 55.Chen K, Quiroz Y, Jakimovich L, et al. Age-associated trajectories of biomarkers in early-onset Alzheimer’s disease, for the Alzheimer’s Prevention Initiative. Alzheimer’s Association International Conference; 2012; Vancouver, British Columbia, Canada: Alzheimer’s Association; 2012. [Google Scholar]
- 56.Fagan AM, Mintun MA, Mach RH, et al. Inverse relation between in vivo amyloid imaging load and cerebrospinal fluid Abeta42 in humans. Ann Neurol. 2006;59:512–519. doi: 10.1002/ana.20730. [DOI] [PubMed] [Google Scholar]
- 57.Caroli A, Frisoni GB. The dynamics of Alzheimer’s disease biomarkers in the Alzheimer’s Disease Neuroimaging Initiative cohort. Neurobiol Aging. 2010;31:1263–1274. doi: 10.1016/j.neurobiolaging.2010.04.024. [DOI] [PMC free article] [PubMed] [Google Scholar]
- 58.Sabuncu MR, Desikan RS, Sepulcre J, et al. The Dynamics of Cortical and Hippocampal Atrophy in Alzheimer Disease. Arch Neurol. 2011;68:1040–1048. doi: 10.1001/archneurol.2011.167. [DOI] [PMC free article] [PubMed] [Google Scholar]
- 59.Schuff N, Tosun D, Insel PS, et al. Nonlinear time course of brain volume loss in cognitively normal and impaired elders. Neurobiol Aging. 2012;33:845–855. doi: 10.1016/j.neurobiolaging.2010.07.012. [DOI] [PMC free article] [PubMed] [Google Scholar]
- 60.Jack CR, Jr, Vemuri P, Wiste HJ, et al. Shapes of the Trajectories of 5 Major Biomarkers of Alzheimer Disease. Arch Neurol. 2012;69:856–867. doi: 10.1001/archneurol.2011.3405. [DOI] [PMC free article] [PubMed] [Google Scholar]
- 61.Jack CR, Jr, Wiste HJ, Lesnick T, et al. Brain beta amyloid load approaches a plateau. Accepted for publication in Neurology. doi: 10.1212/WNL.0b013e3182840bbe. In Press. [DOI] [PMC free article] [PubMed] [Google Scholar]
- 62.Thurfjell L, Lundqvist R, Villemagne VL, Rowe CC. A data-derived Aβ biomarker model computed using longitudinal PiB data from AIBL. Alzheimer’s Association International Conference; 2012; Vancouver, British Columbia, Canada: Alzheimer’s Associaton; 2012. [Google Scholar]
- 63.Crowe A, Ballatore C, Hyde E, Trojanowski JQ, Lee VM. High throughput screening for small molecule inhibitors of heparin-induced tau fibril formation. Biochem Biophys Res Commun. 2007;358:1–6. doi: 10.1016/j.bbrc.2007.03.056. [DOI] [PMC free article] [PubMed] [Google Scholar]
- 64.Jarrett JT, Lansbury PT., Jr Seeding “one-dimensional crystallization” of amyloid: a pathogenic mechanism in Alzheimer’s disease and scrapie? Cell. 1993;73:1055–1058. doi: 10.1016/0092-8674(93)90635-4. [DOI] [PubMed] [Google Scholar]
- 65.Sonnen JA, Santa Cruz K, Hemmy LS, et al. Ecology of the aging human brain. Arch Neurol. 2011;68:1049–1056. doi: 10.1001/archneurol.2011.157. [DOI] [PMC free article] [PubMed] [Google Scholar]
- 66.Troncoso JC, Zonderman AB, Resnick SM, Crain B, Pletnikova O, O’Brien RJ. Effect of infarcts on dementia in the Baltimore longitudinal study of aging. Ann Neurol. 2008;64:168–176. doi: 10.1002/ana.21413. [DOI] [PMC free article] [PubMed] [Google Scholar]
- 67.Schneider JA, Arvanitakis Z, Leurgans SE, Bennett DA. The neuropathology of probable Alzheimer disease and mild cognitive impairment. Ann Neurol. 2009;66:200–208. doi: 10.1002/ana.21706. [DOI] [PMC free article] [PubMed] [Google Scholar]
- 68.Markesbery WR, Schmitt FA, Kryscio RJ, Davis DG, Smith CD, Wekstein DR. Neuropathologic substrate of mild cognitive impairment. Arch Neurol. 2006;63:38–46. doi: 10.1001/archneur.63.1.38. [DOI] [PubMed] [Google Scholar]
- 69.White L. Brain lesions at autopsy in older Japanese-American men as related to cognitive impairment and dementia in the final years of life: a summary report from the Honolulu-Asia aging study. J Alzheimers Dis. 2009;18:713–725. doi: 10.3233/JAD-2009-1178. [DOI] [PubMed] [Google Scholar]
- 70.Toledo JB, Brettschneider J, Grossman M, et al. CSF biomarkers cutoffs: the importance of coincident neuropathological diseases. Acta neuropathologica. 2012;124:23–35. doi: 10.1007/s00401-012-0983-7. [DOI] [PMC free article] [PubMed] [Google Scholar]
- 71.Jack CR, Jr, Wiste HJ, Vemuri P, et al. Brain beta-amyloid measure and magnetic resonance imaging atophy both predict time-to-progression from mild cognitive impairment to Alzheimer’s disease. Brain. 2010;133:3336–3348. doi: 10.1093/brain/awq277. [DOI] [PMC free article] [PubMed] [Google Scholar]
- 72.Klunk WE, Cohen A, Bi W, et al. Why we need two cutoffs for amyloid-imaging: Early versus Alzheimer’s-like amyloid-positivity. Alzheimer’s Association International Conference; 2012; Vancouver, British Columbia, Canada: Alzheimer’s Associaton; 2012. [Google Scholar]
- 73.Rentz DM, Locascio JJ, Becker JA, et al. Cognition, reserve, and amyloid deposition in normal aging. Ann Neurol. 2010;67:353–364. doi: 10.1002/ana.21904. [DOI] [PMC free article] [PubMed] [Google Scholar]
- 74.Stern Y. Cognitive reserve. Neuropsychologia. 2009;47:2015–2028. doi: 10.1016/j.neuropsychologia.2009.03.004. [DOI] [PMC free article] [PubMed] [Google Scholar]
- 75.Vemuri P, Weigand SD, Przybelski SA, et al. Cognitive reserve and Alzheimer’s disease biomarkers are independent determinants of cognition. Brain. 2011;134:1479–1492. doi: 10.1093/brain/awr049. [DOI] [PMC free article] [PubMed] [Google Scholar]
- 76.Reed BR, Mungas D, Farias ST, et al. Measuring cognitive reserve based on the decomposition of episodic memory variance. Brain. 2010;133:2196–2209. doi: 10.1093/brain/awq154. [DOI] [PMC free article] [PubMed] [Google Scholar]
- 77.Roe CM, Mintun MA, D’Angelo G, Xiong C, Grant EA, Morris JC. Alzheimer disease and cognitive reserve: variation of education effect with carbon 11-labeled Pittsburgh Compound B uptake. Arch Neurol. 2008;65:1467–1471. doi: 10.1001/archneur.65.11.1467. [DOI] [PMC free article] [PubMed] [Google Scholar]
- 78.Vemuri P, Lesnick T, przybelski S, et al. Effect of lifestyle activities on AD biomarkers and cognition. Accepted for publication in Annals of Neurology. doi: 10.1002/ana.23665. In Press. [DOI] [PMC free article] [PubMed] [Google Scholar]
- 79.Knopman DS, Jack CR, Jr, Wiste HJ, et al. Short-term clinical outcomes for stages of NIA-AA preclinical Alzheimer disease. Neurology. 2012;78:1576–1582. doi: 10.1212/WNL.0b013e3182563bbe. [DOI] [PMC free article] [PubMed] [Google Scholar]
- 80.Bateman R. Dominantly inherited Alzheimer network clinical trials: A model for prevention trials. AAIC; 2011 July 16–21; Paris, France: Alzheimer’s & Dementia; 2011. p. S680. [Google Scholar]
- 81.Donohue M, Aisen PS, Dartigues J, Jacqmin-Gadda H, Gamst A, Le Gogg M. Validating Alzheimer’s pathological cascade by merging ADNI with PAQUID. Alzheimer’s Assoication International Conference; 2012; Vancouver, British Columbia, Canada: Alzheimer’s Association; 2012. [Google Scholar]
- 82.Jedynak BM, Liu B, Lang A, et al. Sample size comparisons in ADNI: A case for the Alzheimer’s disease progression scale. Alzheimer’s Association International Conference; 2012; Vancouver, British Columbia, Canada: Alzheimer’s Association; 2012. [Google Scholar]
- 83.Mungas D, Jones R, Tommet D. Sequencing of CSF abeta and tau, Brain Structure and Function, and Cognition in Alzheimer’s Disease. American Academy of Neurology Annual Meeting; 2012; New Orleans. Louisiana: Neurology; 2012. p. PD1.0003. [Google Scholar]
- 84.Braak H, Braak E. Frequency of stages of Alzheimer-related lesions in different age categories. Neurobiol Aging. 1997;18:351–357. doi: 10.1016/s0197-4580(97)00056-0. [DOI] [PubMed] [Google Scholar]
- 85.Braak H, Del Tredici K. The pathological process underlying Alzheimer’s disease in individuals under thirty. Acta Neuropathol. 2011;121:171–181. doi: 10.1007/s00401-010-0789-4. [DOI] [PubMed] [Google Scholar]
- 86.Liu L, Drouet V, Wu JW, et al. Trans-synaptic spread of tau pathology in vivo. PLoS One. 2012;7:e31302. doi: 10.1371/journal.pone.0031302. [DOI] [PMC free article] [PubMed] [Google Scholar]
- 87.de Calignon A, Polydoro M, Suarez-Calvet M, et al. Propagation of tau pathology in a model of early Alzheimer’s disease. Neuron. 2012;73:685–697. doi: 10.1016/j.neuron.2011.11.033. [DOI] [PMC free article] [PubMed] [Google Scholar]
- 88.Hardy J, Selkoe DJ. The amyloid hypothesis of Alzheimer’s disease: progress and problems on the road to therapeutics. Science. 2002;297:353–356. doi: 10.1126/science.1072994. [DOI] [PubMed] [Google Scholar]
- 89.Small SA, Duff K. Linking Abeta and tau in late-onset Alzheimer’s disease: a dual pathway hypothesis. Neuron. 2008;60:534–542. doi: 10.1016/j.neuron.2008.11.007. [DOI] [PMC free article] [PubMed] [Google Scholar]
- 90.Mesulam MM. Neuroplasticity failure in Alzheimer’s disease: bridging the gap between plaques and tangles. Neuron. 1999;24:521–529. doi: 10.1016/s0896-6273(00)81109-5. [DOI] [PubMed] [Google Scholar]
- 91.Duyckaerts C. Tau pathology in children and young adults: can you still be unconditionally baptist? Acta Neuropathol. 2011;121:145–147. doi: 10.1007/s00401-010-0794-7. [DOI] [PubMed] [Google Scholar]
- 92.Goate A, Chartier-Harlin MC, Mullan M, et al. Segregation of a missense mutation in the amyloid precursor protein gene with familial Alzheimer’s disease. Nature. 1991;349:704–706. doi: 10.1038/349704a0. [DOI] [PubMed] [Google Scholar]
- 93.Hutton M, Lendon CL, Rizzu P, et al. Association of missense and 5′-splice-site mutations in tau with the inherited dementia FTDP-17. Nature. 1998;393:702–705. doi: 10.1038/31508. [DOI] [PubMed] [Google Scholar]
- 94.Jonsson T, Atwal JK, Steinberg S, et al. A mutation in APP protects against Alzheimer’s disease and age-related cognitive decline. Nature. 2012;488:96–99. doi: 10.1038/nature11283. [DOI] [PubMed] [Google Scholar]
- 95.Reiman EM, Chen K, Alexander GE, et al. Functional brain abnormalities in young adults at genetic risk for late-onset Alzheimer’s dementia. Proc Natl Acad Sci U S A. 2004;101:284–289. doi: 10.1073/pnas.2635903100. [DOI] [PMC free article] [PubMed] [Google Scholar]
- 96.Scarmeas N, Habeck CG, Stern Y, Anderson KE. APOE genotype and cerebral blood flow in healthy young individuals. JAMA. 2003;290:1581–1582. doi: 10.1001/jama.290.12.1581. [DOI] [PMC free article] [PubMed] [Google Scholar]
- 97.Morris JC, Roe CM, Xiong C, et al. APOE predicts amyloid-beta but not tau Alzheimer pathology in cognitively normal aging. Ann Neurol. 2010;67:122–131. doi: 10.1002/ana.21843. [DOI] [PMC free article] [PubMed] [Google Scholar]
- 98.Vemuri P, Wiste HJ, Weigand SD, et al. Effect of apolipoprotein E on biomarkers of amyloid load and neuronal pathology in Alzheimer disease. Ann Neurol. 2010;67:308–316. doi: 10.1002/ana.21953. [DOI] [PMC free article] [PubMed] [Google Scholar]
- 99.Bu G. Apolipoprotein E and its receptors in Alzheimer’s disease: pathways, pathogenesis and therapy. Nat Rev Neurosci. 2009;10:333–344. doi: 10.1038/nrn2620. [DOI] [PMC free article] [PubMed] [Google Scholar]
- 100.Dumanis SB, Tesoriero JA, Babus LW, et al. ApoE4 decreases spine density and dendritic complexity in cortical neurons in vivo. J Neurosci. 2009;29:15317–15322. doi: 10.1523/JNEUROSCI.4026-09.2009. [DOI] [PMC free article] [PubMed] [Google Scholar]
- 101.Buckner RL, Snyder AZ, Shannon BJ, et al. Molecular, structural, and functional characterization of Alzheimer’s disease: evidence for a relationship between default activity, amyloid, and memory. J Neurosci. 2005;25:7709–7717. doi: 10.1523/JNEUROSCI.2177-05.2005. [DOI] [PMC free article] [PubMed] [Google Scholar]
- 102.Greicius MD, Srivastava G, Reiss AL, Menon V. Default-mode network activity distinguishes Alzheimer’s disease from healthy aging: evidence from functional MRI. Proc Natl Acad Sci U S A. 2004;101:4637–4642. doi: 10.1073/pnas.0308627101. [DOI] [PMC free article] [PubMed] [Google Scholar]
- 103.Buckner RL, Sepulcre J, Talukdar T, et al. Cortical hubs revealed by intrinsic functional connectivity: mapping, assessment of stability, and relation to Alzheimer’s disease. J Neurosci. 2009;29:1860–1873. doi: 10.1523/JNEUROSCI.5062-08.2009. [DOI] [PMC free article] [PubMed] [Google Scholar]
- 104.Jones DT, Machulda MM, vemuri P, et al. Age-related changes in the default mode network are more advanced in Alzheimer disease. Neurology. 2011;77:1524–1531. doi: 10.1212/WNL.0b013e318233b33d. [DOI] [PMC free article] [PubMed] [Google Scholar]
- 105.Seeley WW, Crawford RK, Zhou J, Miller BL, Greicius MD. Neurodegenerative diseases target large-scale human brain networks. Neuron. 2009;62:42–52. doi: 10.1016/j.neuron.2009.03.024. [DOI] [PMC free article] [PubMed] [Google Scholar]
- 106.Mormino EC, Smiljic A, Hayenga AO, et al. Relationships between Beta-Amyloid and Functional Connectivity in Different Components of the Default Mode Network in Aging. Cereb Cortex. 2011;21:2399–2407. doi: 10.1093/cercor/bhr025. [DOI] [PMC free article] [PubMed] [Google Scholar]
- 107.Machulda MM, Jones DT, Vemuri P, et al. Effect of APOE e4 Status on Intrinsic Network Connectivity in Cognitively Normal Elderly Subjects. Arch Neurol. 2011;68:1131–1136. doi: 10.1001/archneurol.2011.108. [DOI] [PMC free article] [PubMed] [Google Scholar]
- 108.Sperling RA, Laviolette PS, O’Keefe K, et al. Amyloid deposition is associated with impaired default network function in older persons without dementia. Neuron. 2009;63:178–188. doi: 10.1016/j.neuron.2009.07.003. [DOI] [PMC free article] [PubMed] [Google Scholar]
- 109.Sheline YI, Morris JC, Snyder AZ, et al. APOE4 allele disrupts resting state fMRI connectivity in the absence of amyloid plaques or decreased CSF Abeta42. J Neurosci. 2010;30:17035–17040. doi: 10.1523/JNEUROSCI.3987-10.2010. [DOI] [PMC free article] [PubMed] [Google Scholar]
- 110.Filippini N, MacIntosh BJ, Hough MG, et al. Distinct patterns of brain activity in young carriers of the APOE-epsilon4 allele. Proc Natl Acad Sci U S A. 2009;106:7209–7214. doi: 10.1073/pnas.0811879106. [DOI] [PMC free article] [PubMed] [Google Scholar]
- 111.Chhatwal J, Schultz A, Johnson K, et al. Disrupted functional connectivity in autosomal dominant Alzheimer’s Disease: Preliminary findings from the DIAN study. Alzheimer’s Assoication International Conference; 2012; Vancouver, British Columbia, Canada: Alzheimer’s Association; 2012. [Google Scholar]
- 112.Bero AW, Yan P, Roh JH, et al. Neuronal activity regulates the regional vulnerability to amyloid-beta deposition. Nat Neurosci. 2011;14:750–756. doi: 10.1038/nn.2801. [DOI] [PMC free article] [PubMed] [Google Scholar]
- 113.Jagust WJ, Mormino EC. Lifespan brain activity, beta-amyloid, and Alzheimer’s disease. Trends Cogn Sci. 2011;15:520–526. doi: 10.1016/j.tics.2011.09.004. [DOI] [PMC free article] [PubMed] [Google Scholar]
- 114.Fodero-Tavoletti MT, Okamura N, Furumoto S, et al. 18F-THK523: a novel in vivo tau imaging ligand for Alzheimer’s disease. Brain. 2011;134:1089–1100. doi: 10.1093/brain/awr038. [DOI] [PubMed] [Google Scholar]
- 115.Hu WT, Holtzman DM, Fagan AM, et al. Plasma multianalyte profiling in mild cognitive impairment and Alzheimer disease. Neurology. 2012;79:897–905. doi: 10.1212/WNL.0b013e318266fa70. [DOI] [PMC free article] [PubMed] [Google Scholar]
- 116.Whitwell JL, Przybelski SA, Weigand SD, et al. 3D maps from multiple MRI illustrate changing atrophy patterns as subjects progress from mild cognitive impairment to Alzheimer’s disease. Brain. 2007;130:1777–1786. doi: 10.1093/brain/awm112. [DOI] [PMC free article] [PubMed] [Google Scholar]
- 117.Vemuri P, Gunter JL, Senjem ML, et al. Alzheimer’s disease diagnosis in individual subjects using structural MR images: validation studies. Neuroimage. 2008;39:1186–1197. doi: 10.1016/j.neuroimage.2007.09.073. [DOI] [PMC free article] [PubMed] [Google Scholar]
- 118.Landau SM, Harvey D, Madison CM, et al. Comparing predictors of conversion and decline in mild cognitive impairment. Neurology. 2010;75:230–238. doi: 10.1212/WNL.0b013e3181e8e8b8. [DOI] [PMC free article] [PubMed] [Google Scholar]
- 119.Villain N, Fouquet M, Baron JC, et al. Sequential relationships between grey matter and white matter atrophy and brain metabolic abnormalities in early Alzheimer’s disease. Brain. 2010;133:3301–3314. doi: 10.1093/brain/awq203. [DOI] [PMC free article] [PubMed] [Google Scholar]
- 120.Chetelat G, Villemagne VL, Pike KE, et al. Relationship between memory performance and beta-amyloid deposition at different stages of Alzheimer’s disease. Neurodegener Dis. 2012;10:141–144. doi: 10.1159/000334295. [DOI] [PubMed] [Google Scholar]