Abstract
The flow-induced vibration of synthetic vocal fold models has been previously observed to be acoustically-coupled with upstream flow supply tubes. This phenomenon was investigated using a finite element model that included flow–structure–acoustic interactions. The length of the upstream duct was varied to explore the coupling between model vibration and subglottal acoustics. Incompressible and slightly compressible flow models were tested. The slightly compressible model exhibited acoustic coupling between fluid and solid domains in a manner consistent with experimental observations, whereas the incompressible model did not, showing the slightly compressible approach to be suitable for simulating acoustically-coupled vocal fold model flow-induced vibration.
Keywords: Fluid–structure–acoustic interaction, Flow-induced vibration, Slightly compressible flow models, Acoustic coupling, Vocal fold vibration
1. Introduction
Numerous research studies have been performed to improve our understanding of the physics of human voice production. Many of these studies have focused on the flow-induced vibration of the vocal folds, a central component of sound production during voiced speech.
The vocal folds are a pair of opposing multi-layer tissue bodies located within the larynx. Deep within the fold is a muscle layer, which is lined with lamina propria tissue. The lamina propria includes deep, intermediate, and superficial tissue layers that generally progressively become less stiff towards the vocal fold surface. The epithelium is the most superficial layer and consists of a thin (about 50 μm thick) layer of cells. These tissue layers are often grouped into three different structures: body (muscle), ligament (deep and intermediate lamina propria layers), and cover (superficial lamina propria and epithelium) [1].
The space between opposing vocal folds is called the glottis. The regions below and above the glottis are the subglottis and supraglottis, respectively. During voiced speech, forced air from the lungs interacts with adducted vocal folds to initiate flow-induced vocal fold vibration. This creates a fluctuating pressure field in the supraglottis that is the source of sound during voicing.
With the primary aim of improving voice disorder prevention, diagnosis, and treatment, computational and experimental models have been used to study the coupled fluid dynamics, tissue dynamics, and acoustics of voice production. One of the first computer simulations of vocal fold vibration was the two-mass model [2], in which the vocal folds were each represented by two masses interconnected by springs and dampers. This model and subsequent variations [3,4] were simple and generated output variables that were similar to those that had been measured in human voice production, and were thus helpful in gaining initial insight into the mechanics of voice production.
More recently, two- and three-dimensional finite element and finite volume models have been used to simulate vocal fold vibration [5]. For example, Berry and Titze [6] approximated the vocal folds as two-dimensional parallelepipeds with mechanical properties based on human vocal fold tissue data. The in vacuo responses of these models were then analyzed to determine their eigenvalues and eigenfrequencies. A three-dimensional model with realistic vocal fold geometry, multiple layers of material with different properties, and a flow-induced vibratory response was described by Alipour et al. [7]. A three-dimensional model by Oliveira Rosa et al. [8] simulated vocal fold flow-induced vibration and included the ventricular folds. This model also included three different material properties to simulate the muscle, ligament, and cover layers.
Experimental vocal fold models have also been used to study coupled flow-solid-acoustic interactions that are important in voice production. Included in this category are life-size, self-oscillating synthetic models [9,10] fabricated from silicone rubber materials. These models have been used to conduct parametric studies involving factors such as geometry and material properties. With particular relevance to the present work, Zhang et al. [11] showed that the flow-induced vibration of one synthetic model was acoustically coupled with the subglottal (upstream) flow supply tube. The experimental setup consisted of a flow source connected to an expansion chamber, followed by a subglottal tube of adjustable length. At the downstream end of the subglottal tube was a synthetic silicone model simulating the human vocal folds. The model vibration frequency was recorded for different subglottal tube lengths ranging from 25 cm to 400 cm. The frequency of vibration decreased from 220 Hz to 150 Hz as the subglottal tube was lengthened from 25 cm to 80 cm. At approximately 140 cm, the vibration frequency suddenly increased to 225 Hz and then gradually decreased to 160 Hz at a subglottal tube length of 170 cm. This pattern of generally decreasing frequency with increasing length, but with abrupt increases in frequency at certain lengths, repeated up to 350 Hz. This pattern was attributed to acoustic coupling of the model vibration with the subglottal tube acoustic resonances. This has also been termed “acoustically-driven” vibration [12,13].
Because acoustic coupling has been shown to play a central role in governing this vocal fold model’s response, the purpose of the research described in this paper was to develop a complementary computational model that could be used to further characterize and explore the flow-induced vibratory responses of this and future models. An important part of the development of the computational model was to demonstrate that the model adequately captured the acoustic coupling seen in experiments [11,13]. This was accomplished by creating a two-dimensional finite element model that featured fully-coupled fluid and solid domains. Results from simulations with incompressible and slightly compressible flow models were compared. In the following sections, the numerical methods and results are presented, and it is shown that the slightly compressible model yielded results comparable with the experimental results of Zhang et al. [11]. Subglottal acoustic wave patterns are presented and the influence of subglottal acoustics on model vibration frequency is discussed. Recommendations regarding the use of slightly compressible flow models in vocal fold modeling are then given.
2. Methods
2.1. Computational model
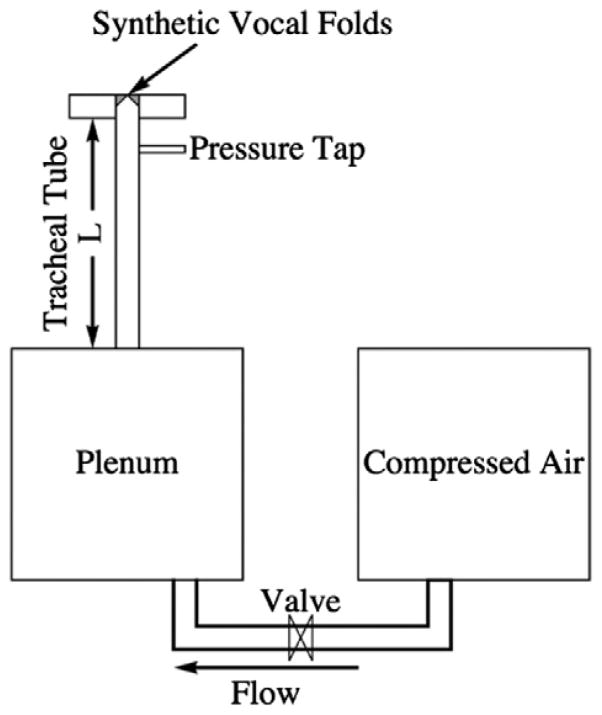
The computational model setup was patterned after the experimental setups of Thomson et al. [9] and Zhang et al. [11]. The Thomson et al. [9] setup (see Fig. 1) consisted of a compressed air supply that fed into a plenum, followed by a tube simulating the subglottal tracheal section, and a synthetic vocal fold model mounted at the end of the tube. The Zhang et al. [11] setup was similar, but with a subglottal tube of adjustable length, L. In this study the commercial finite element software code ADINA was used to simulate the flow-induced vibration of a vocal fold model for different subglottal tube lengths. The model included distinct but fully-coupled two-dimensional solid and fluid domains, details of which are given below.
Fig. 1.
Experimental setup of the airway used by Thomson et al. [9], including a compressed air source, a plenum, and a “tracheal” tube which led to a synthetic, self-oscillating silicone vocal fold model.
2.1.1. Solid domain
The solid domain (see Fig. 2) included two layers of different material properties to simulate the “body-cover” tissue layers of the human vocal folds [14]. The cover was 2 mm thick. Note that the synthetic, self-oscillating vocal fold models of Thomson et al. [9] and Zhang et al. [11] were one-layer (i.e., homogeneous) models; however, it has been shown that two-layer models exhibit similar acoustic coupling as one-layer models [10]. For computational efficiency, only one vocal fold was modeled using prescribed symmetry.
Fig. 2.
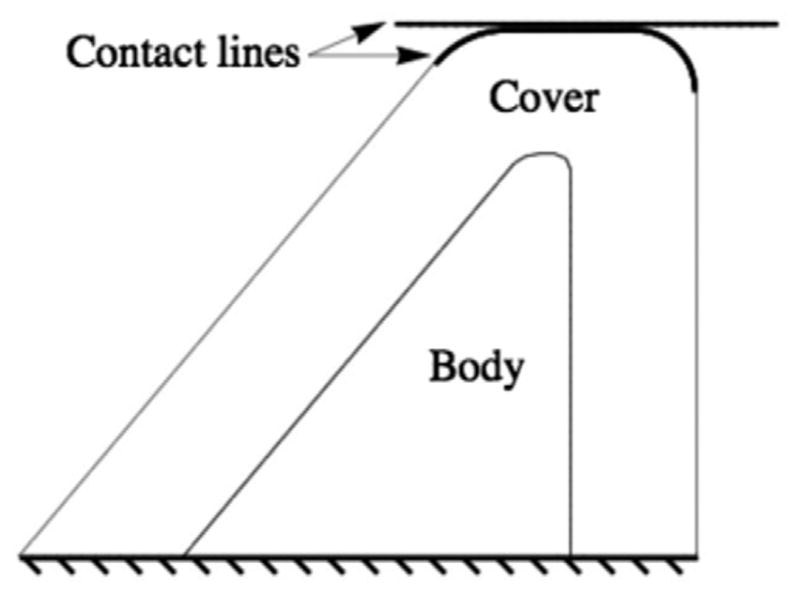
Outline of the two-dimensional computational vocal fold solid domain, including body and cover layers. A contact plane was used to prevent the fluid domain from completely collapsing during vibration.
A hyperelastic Ogden material model [15] was used to allow for large strain. Linear stress–strain curves were used to define the equivalent Young’s modulus values of 15 kPa and 5 kPa for the body and cover layers, respectively. These are similar to the corresponding values of other previously-studied two-layer synthetic (silicone) vocal fold models [10,16]. The density, Poisson’s ratio, and bulk modulus values of both layers were 1070 kg/m3, 0.49, and 1 × 10⁵ Pa, respectively. Damping was simulated using a Rayleigh damping scheme with coefficients α = 24.1915 and β = 1.27 × 10⁻⁴, corresponding to damping ratios of about 6% at the solid model’s first two in vacuo modal frequencies of 46.5 and 103.5 Hz.
The solid domain was meshed with 4710 three-node triangular elements (see Fig. 3). All solid domain elements were mixed interpolated elements. Boundary conditions for the solid domain were as follows. The wetted perimeter was treated as a fluid–structure interaction (FSI) boundary, which enforced consistent fluid and solid displacements and stresses along the fluid–solid interface. A zero-displacement boundary condition was applied to the non-wetted lateral edge of the model to simulate fixed mounting of the synthetic model.
Fig. 3.
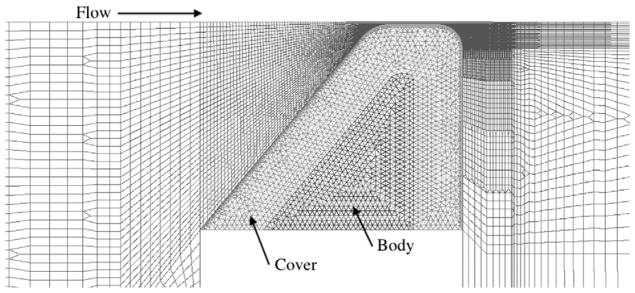
Mesh of the computational domain.
As shown in Fig. 2, a contact line was defined in the solid domain to limit the model medial motion and prevent complete collapse of the fluid domain mesh. This contact line was placed 75 μm from the fluid domain symmetry line (described below). In another study using a somewhat similar model [17,18], the influence of contact line location on model response was considered, with the results summarized as follows. Contact line locations between 0.5 μm and 25 μm were considered. Predicted output values of frequency, maximum glottal opening, and maximum flow rate each varied by less than 1%. Average glottal opening and average flow rate values varied by 7.3% and 5.3%, respectively, with the larger variations caused by larger glottal opening (and hence larger flow rate) during the closed phase of the cycle. Glottal width and flow rate waveforms exhibited negligible variation during the open phases of the cycle. In the model discussed in this paper, the larger 75 μm gap was chosen as it was found to assist model stability during the large displacements caused by upstream duct resonances (see Section 3.3). While not explicitly studied using this model, based on the results of the above-mentioned contact line study, it is not anticipated that reducing the glottal gap would result in significant differences in the model frequency response.
2.1.2. Fluid domain
The fluid domain (Fig. 4) was governed by the two-dimensional, unsteady, viscous Navier–Stokes equations. The working fluid was defined to be air with a density of 1.21 kg/m3, a viscosity of 1.79 × 10⁻⁵ N s/m2, and a bulk modulus of 1.41 × 10⁵ Pa. The initial distance between the symmetry line and the nearest point on the vocal fold was 0.1 mm, for an effective initial pre-vibratory glottal gap of 0.2 mm. All elements in the fluid domain were mixed elements [19–22]. A constant, uniform pressure of 900 Pa was applied at the inlet. This pressure is in the range of pressures that have been used in other studies of experimental and computational vocal fold models [7,9,13].
Fig. 4.
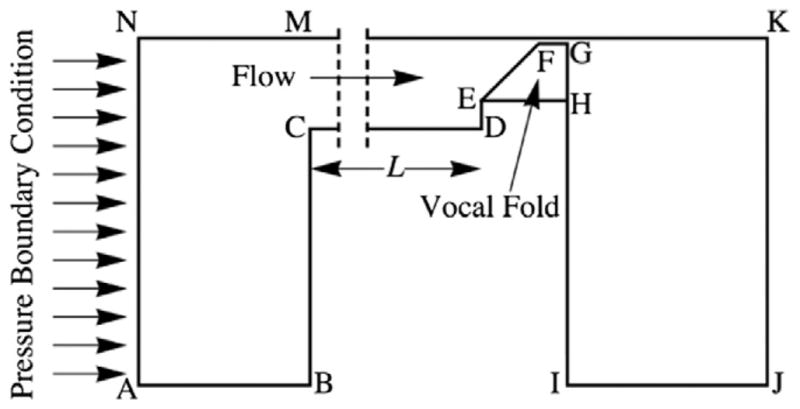
Outline of the two-dimensional computational fluid domain (not to scale). Assuming symmetry, only half of the airway was modeled, as shown.
The fluid domain dimensions are given in Table 1. In the Zhang et al. [11] experiments, the flow supply tube (one wall of which is represented by line CD in Fig. 4) had a cross sectional area of 5.06 cm2, while the expansion chamber cross section measured 23.5 cm × 25.4 cm, for a cross-sectional area of 596.9 cm2. The area ratio between the cross section of the flow supply tube and that of the expansion chamber is important because large area ratios cause strong acoustic reflections. The ratio of the areas of the expansion chamber to the flow supply tube in the Zhang et al. [11] experiments was 117.96. Because the computational model in this study was two-dimensional, line BC was lengthened to create the same area change as found in the experiments. To explore the influence of changing subglottal duct length on model vibration frequency, the length of line CD, here denoted L, was varied from 40 to 150 cm in 10 cm increments and from 160 cm to 300 cm in 20 cm increments.
Table 1.
Computational domain dimensions and boundary conditions.
| Line segment | Length (m) | Boundary type |
|---|---|---|
| AB | 0.308 | Wall |
| BC | 0.14944 | Wall |
| CD | L = 0.1 to 3.0 | Wall |
| DE | 0.0042 | Wall |
| EF | 0.011 | FSI |
| FG | 0.0021 | FSI |
| GH | 0.0085 | FSI |
| HI | 0.1536 | Wall |
| IJ | 0.1 | Zero pressure |
| JK | 0.1507 | Zero pressure |
| KM | L + 0.1107 | Slip wall |
| MN | 0.308 | Slip wall |
| AN | 0.1507 | 900 Pa Pressure |
| EH | 0.0107 | Fixed (solid domain) |
The Mach number of the glottal jet in these simulations was on the order of 0.1. However, an incompressible flow model was not thought to be appropriate because of the previous experimentally- observed significance of acoustic effects, i.e., fluid compressibility associated with acoustic wave propagation but not high velocities. To model acoustic compressibility effects, a slightly compressible solver [23,24] was used. While it may have been desirable to also compare the results with those obtained using a fully-compressible flow solver, convergence difficulties at this low Mach number were encountered when using a compressible flow solver.
The continuity and Navier–Stokes equations that govern unsteady, viscous, incompressible flow in the absence of body forces are, respectively:
| (1) |
| (2) |
where ρ is the constant (incompressible) fluid density, ν⃑ is the velocity vector, t is time, p is pressure, and μ is viscosity. In the slightly compressible flow solver formulation, a compressible density, ρm, is defined as [24]
| (3) |
where κ is the fluid bulk modulus. The compressible continuity equation is
| (4) |
Inserting Eq. (3) into Eq. (4) yields
| (5) |
Eq. (5) can be written as
| (6) |
Use of this form of the continuity equation allows for density variation but without the need to solve the energy equation, often leading to more readily attainable convergence. The compressible density term is used in the continuity equation but not the momentum equations, which is a reasonable approximation as long as p/κ ≪ 1. For air with κ = 1.41 × 10⁵ Pa, this corresponds to a maximum allowable pressure of less than about 14 kPa. In these simulations the maximum pressure was approximately 4 kPa, satisfying this p/κ ≪ 1 requirement. Note that while the slightly compressible model was expected (and found) to yield the desired model response that compared well with experimental observations, simulations with an incompressible flow solver were also performed for comparison and are discussed in Section 3.2.
2.2. Verification
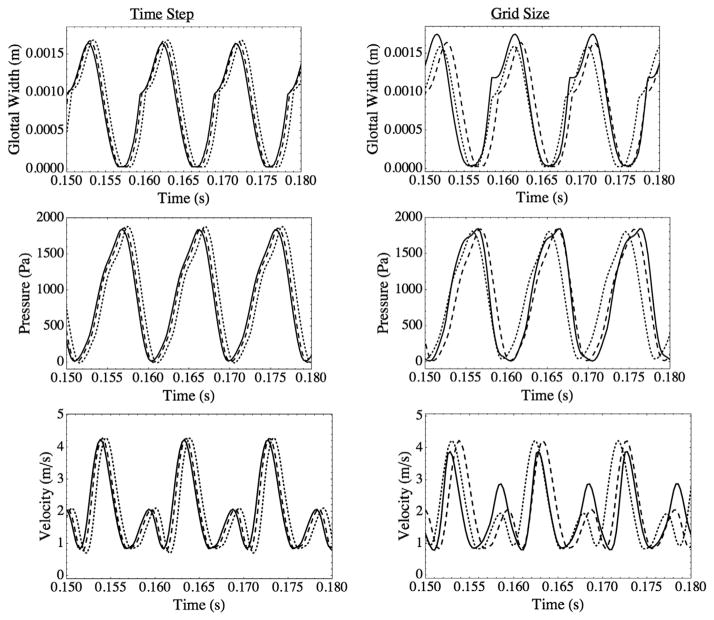
Model verification was performed by refining grid and time step sizes. All verification studies were conducted with a subglottal duct length of L = 60 cm. Waveforms of glottal width (defined as twice the distance between the symmetry line and the closest point on the vocal fold model), pressure, and velocity were used to determine time step and grid size independence. The pressure and velocity data were obtained at a point on the symmetry line (line N–M–K, Fig. 4) at the same streamwise location as point E in Fig. 4. The results are shown in Fig. 5 and summarized in Table 2. Time step sizes of 2.5 × 10⁻⁵ s, 1.25 × 10⁻⁵ s, and 6.25 × 10⁻⁶ s were tested; 1.25 × 10⁻⁵ s was determined to be suitable. Grids with 9696, 37,043, and 145,629 linear elements in the fluid domain were tested. The grid with 37,043 elements (37,740 nodes) was selected.
Fig. 5.
Left column: glottal width, pressure, and velocity waveforms for three different time step sizes; (···) 2.5 × 10⁻⁵ s; (- - -) 1.25 × 10⁻⁵ s; (—) 6.25 × 10⁻⁶ s. Right column: glottal width, pressure, and velocity waveforms for three different fluid domain grid densities; (—) 9696 elements; (- - -) 37,034 elements; (···) 145,629 elements.
Table 2.
Frequency and glottal width amplitude of vocal fold vibration for different time step sizes (top three rows) and number of elements (bottom three rows).
| Case | Frequency (Hz) | Amplitude (mm) |
|---|---|---|
| 2.5 × 10⁻⁵ s, 37,034 elements | 105.3 | 1.76 |
| 1.25 × 10⁻⁵ s, 37,034 elements | 105.3 | 1.80 |
| 6.125 × 10⁻⁶ s, 37034 elements | 105.3 | 1.82 |
| 1.25 × 10⁻⁵ s, 9969 elements | 100.0 | 1.79 |
| 1.25 × 10⁻⁵ s, 37,034 elements | 105.3 | 1.80 |
| 1.25 × 10⁻⁵ s, 145,629 elements | 107.5 | 1.81 |
3. Results and discussion
3.1. Slightly compressible model response
Fig. 6 shows the solid domain outline at six instances of a typical vibration cycle with a slightly compressible flow model and L = 60 cm. The model motion is qualitatively similar to that which has been reported in other experiments using one-layer [9] and two-layer [10,16] models. Reasonable quantitative agreement was also observed. During vibration, the model attained a maximum glottal width of around 1.5–3 mm, depending on subglottal duct length, which compares favorably with the maximum glottal width produced by the model of Thomson et al. [9] of about 2 mm. As discussed below, the model frequency, which was a function of subglottal duct length, was also in the range of theoretical and experimental predictions.
Fig. 6.
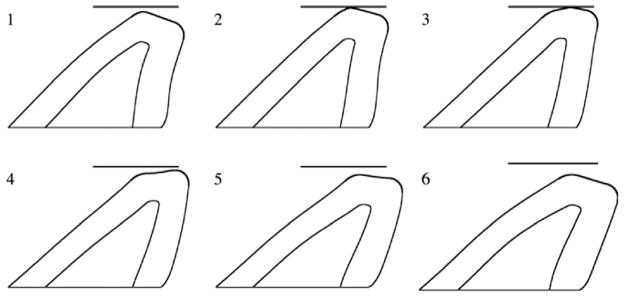
Vocal fold model positions at several phases of one cycle of vibration for a 60 cm subglottal duct. Simulation time between consecutive images is 1.25 ms.
3.2. Slightly compressible vs. incompressible flow models
Predicted model vibrations were compared for incompressible and slightly compressible flow models using L = 50cm. The glottal width waveforms yielded by the two models are shown in Fig. 7. For the slightly compressible case, the model exhibited an initial “dwell time” during which the pressure wave traveled down-stream along the subglottal duct before interacting with the vocal fold model. This was followed by a transient vibratory phase, followed by steady-state, self-sustained vibration. In contrast, for this duct length, the incompressible model only yielded transient vibration before decaying, and immediately after time t = 0 the pressure field caused deformation of the vocal fold model.
Fig. 7.
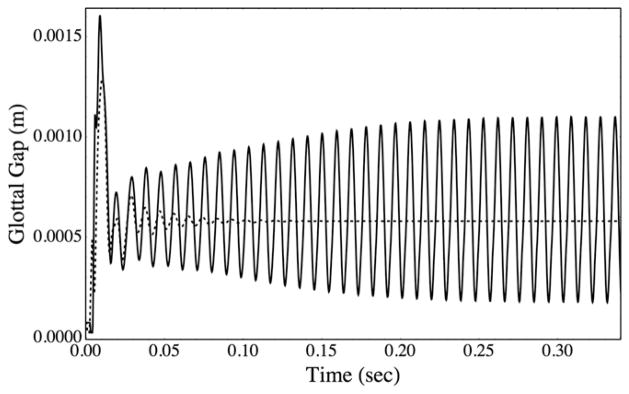
Glottal width vs. time for slightly compressible (—) and incompressible (···) flow models, each with L = 50 cm.
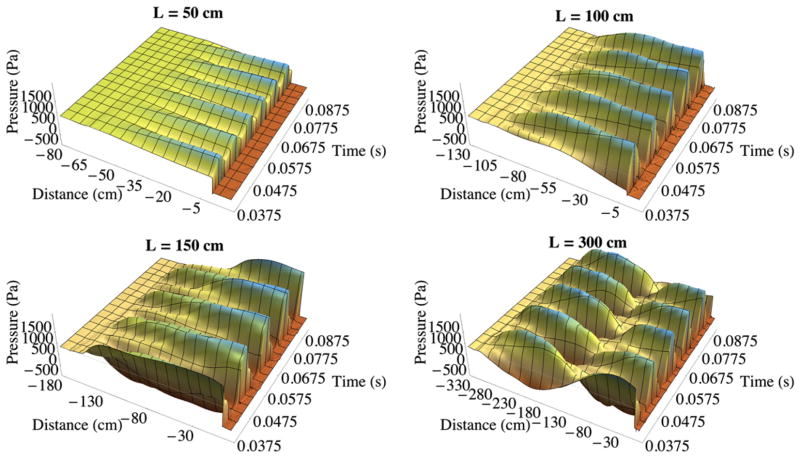
Fig. 8 shows the pressure along the subglottal duct symmetry line (line NMK, Fig. 4), from the pressure inlet to 10 cm downstream of the vocal fold model, as a function of time predicted by the incompressible flow solver. Note that the location of 0 cm in the distance axis corresponds to the streamwise location of point E in Fig. 4. With L = 50 cm the model did not self-oscillate and no standing waves were formed in the subglottal duct. With L = 100 cm the model self-oscillated and periodic sharp rises in pressure are seen to have formed in the subglottal duct. The pressure spatially increased linearly from the inlet pressure (900 Pa) at the subglottal duct entrance, and the peak pressure was always located at the end of the duct near the vocal fold model and occurred near times of glottal width closing. Similar behavior was observed for the L = 150 and L = 300 cm cases. The model frequencies for the three vibrating cases were 108, 111, and 108 Hz for duct lengths of 100, 150, and 300 cm, respectively, indicating near-independence of model vibration frequency with subglottal duct length. Thus while this model did vibrate for some values of L, the results are not consistent with expected frequency vs. L variations based on the previous experimental results of Thomson et al. [9] and Zhang et al. [11]. Further, the subglottal pressure fields are not consistent with expectations based on acoustic wave propagation theory (discussed below).
Fig. 8.
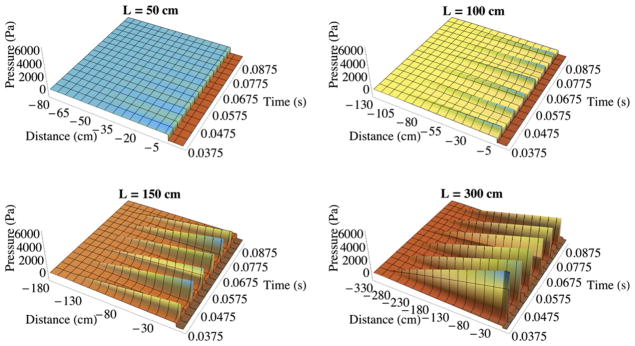
Pressure along the symmetry line over time for L = 50 cm, 100 cm, 150 cm, and 300 cm subglottal duct lengths from the incompressible flow model simulations.
3.3. Subglottal acoustic coupling in slightly compressible flow model
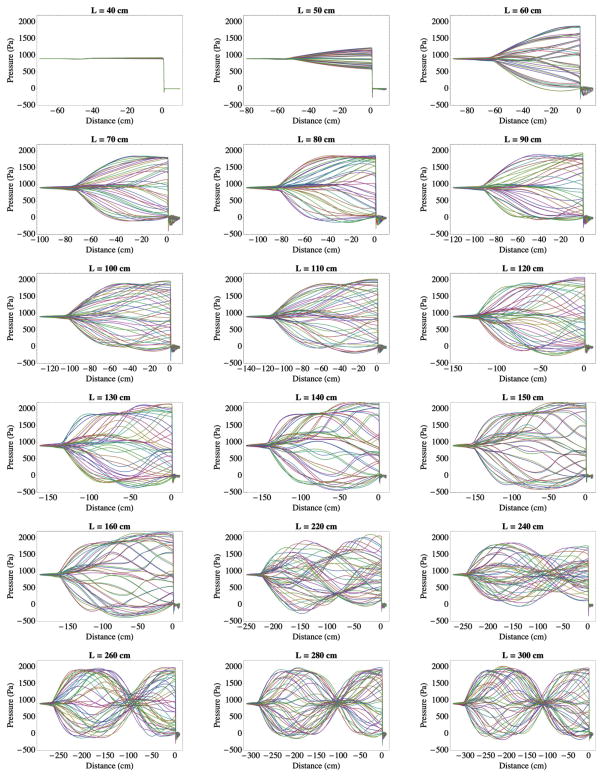
By contrast, the slightly compressible flow model yielded solid model responses and subglottal pressure fields that are consistent with experimental results and analytical predictions. As with the incompressible model results, the pressure was monitored along the fluid domain symmetry line at several phases over several steady-state vibration cycles. Fig. 9 shows the pressure along the subglottal duct symmetry line as a function of time predicted by the slightly compressible flow solver. Pressure results at different phases superimposed on each other are shown in Fig. 10 for duct lengths ranging from L = 40 to L = 300 cm. For the models that vibrated, the pressure at the duct inlet was 900 Pa, and along the duct length, the pressure oscillated about a mean value of approximately 900 Pa.
Fig. 9.
Pressure along the symmetry line over time for L = 50 cm, 100 cm, 150 cm, and 300 cm subglottal duct lengths from the slightly compressible flow model simulations.
Fig. 10.
Pressure along the symmetry line over a single steady-state vibration cycle from the slightly compressible flow model simulations for several duct lengths.
The model failed to self-oscillate with L ≤ 40 cm. This is consistent with the report of Zhang et al. [11] that their model did not vibrate with L ≤ 40 cm. With L = 50 cm a standing wave formed within the subglottal duct during self-sustained model oscillation. The shape of the standing wave suggests that the subglottal duct somewhat resembled that of a resonating duct with a rigid termination. It is noted, however, that during vibration, the vocal fold model was opening and closing, such that the effective acoustic termination boundary was changing over time. With subglottal duct lengths around 80 cm, the standing wave resembled that of the first mode of a ¼-wavelength resonator. As L increased from 100 to 160 cm, the standing wave shape was similar to that at L = 80 cm, but with increasingly different fluctuations. With L = 220 cm a ¾-wavelength mode was beginning to form, and around L = 260 cm this mode is clearly visible and evidenced by presence of a pressure node. This pattern persisted through the L = 300 cm case.
Fig. 11 shows the model vibration frequency vs. subglottal duct length. Also shown are measured data from Zhang et al. [11]. The solid and dashed lines in the main figure are the analytical solutions for ¼- and ¾-wavelength resonators, respectively, found using the relationship f = c/λ where f is the frequency, c is the speed of sound (343 m/s), and λ is the wavelength. For a ¼-wavelength resonator, λ = 4L and for a ¾-wavelength resonator, λ = 4L/3. The smaller graphs inlaid into Fig. 11 show the approximate maximum (solid lines) and minimum (dotted lines) pressure waveforms along the subglottal duct (similar to the waveforms in Fig. 10).
Fig. 11.
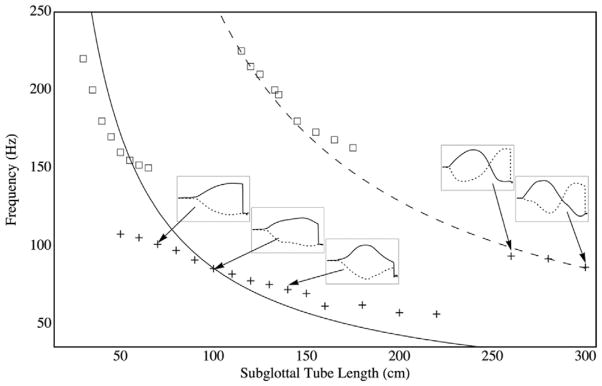
Frequency of vibration vs. subglottal duct length, L. (+) computational results; (□) experimental results from Zhang et al. [11]; (—) analytical result for a ¼- wavelength resonator; (- - -) analytical result for a ¾-wavelength resonator. Inlaid graphs show pressures predicted from the computational model along the symmetry line at selected subglottal duct lengths.
The computational model frequencies generally (but not precisely) follow the resonator frequency curves. The difference between computational and analytical predictions is likely attributable to the resonator curves being based on the assumption of a rigid termination. Importantly, the slightly compressible model vibration frequency jump decreases with increasing duct length, with a jump from about 56 Hz to 94 Hz when the length changes from L = 220 cm to 260 cm. (It is noted that the 240 cm case experienced erratic vibration that caused the model to fail due to excessive mesh deformation before it reached steady-state vibration; hence no data point is shown for the 240 cm case.) As can be seen in Fig. 10 and in the inlaid graphs in Fig. 11, this jump occurs as the second acoustic mode forms.
Similar to the computational model, the vocal fold models in the experiments from Zhang et al. [11] also generally followed the predicted resonator frequencies, although at a higher overall frequency. A jump in frequency is also seen, although it occurred at a different subglottal tube length. The higher frequency of the experimental model is likely a result of different material properties and the increased effective stiffness of the experimental models. Regarding the latter, the computational models were two-dimensional, whereas the experimental models possessed a finite length of approximately 1.7 cm and were rigidly fixed at their ends. Consequently, the effective stiffness of the two-dimensional model was lower than that of the synthetic model. Notwithstanding these differences in frequency magnitudes, these results show the ability of the slightly compressible flow model to capture (1) the subglottal acoustics and (2) the acoustic coupling between subglottal acoustics and model vibration in a manner consistent with experimental observations and expectations based on acoustic resonance theory. For this vocal fold model, this acoustic coupling is a critical governing factor of model self-oscillation.
4. Conclusions
The slightly compressible model demonstrated the ability to predict the effects of subglottal acoustics that have been previously seen in experimental studies. As the computational model vibrated, standing pressure waves were seen in the subglottal duct for certain lengths. As the subglottal duct length increased, the flow-induced vibration frequency changed, and the standing pressure waves changed from approximately following a ¼-wavelength resonator pattern to that of a ¾-wavelength resonator. The results also show how this coupling is related to the subglottal acoustic modes. The incompressible flow model did not produce results that were consistent with experiment or theory.
A few suggestions for further development and testing of this model are recommended. First, the model was only two-dimensional, such that anterior–posterior and lateral rigid boundaries could not be modeled. Including these boundaries in a three-dimensional model would increase the model effective stiffness. Second, the model did not include supraglottal structures, such as the vocal tract or the false vocal folds. This was done to match the published experimental setup [9,11]; however, including these structures in future work would allow for exploration of possible acoustic coupling with the supraglottal duct.
Acknowledgments
This work was supported by Grant Nos. R03DC008200 and R01DC009616 from the National Institute on Deafness and Other Communication Disorders (NIDCD). Its content is solely the responsibility of the authors and does not necessarily represent the official views of the NIDCD or the National Institutes of Health (NIH).
Contributor Information
David Jesse Daily, Email: dai01001@gmail.com.
Scott L. Thomson, Email: thomson@byu.edu.
References
- 1.Hirano M, Kakita Y, Ohmaru K, Kurita S. Structure and mechanical properties of the vocal fold. In: Lass NJ, editor. Speech and language: advances in basic research and practice. Vol. 7. New York: Academic Press; 1982. pp. 271–97. [Google Scholar]
- 2.Ishizaka K, Flanagan JL. Synthesis of voiced sounds from a two-mass model of the vocal cords. Bell Syst Tech J. 1972;51:1233–68. [Google Scholar]
- 3.Story BH, Titze IR. Voice simulation with a body-cover model of the vocal folds. J Acoust Soc Am. 1995;97:1249–60. doi: 10.1121/1.412234. [DOI] [PubMed] [Google Scholar]
- 4.Lucero JC, Koenig LL. Simulations of temporal patterns of oral airflow in men and women using a two-mass model of the vocal folds under dynamic control. J Acoust Soc Am. 2005;117:1362–72. doi: 10.1121/1.1853235. [DOI] [PubMed] [Google Scholar]
- 5.Alipour F, Scherer RC. Flow separation in a computational oscillating vocal fold model. J Acoust Soc Am. 2004;116:1710–9. doi: 10.1121/1.1779274. [DOI] [PubMed] [Google Scholar]
- 6.Berry DA, Titze IR. Normal modes in a continuum model of vocal fold tissues. J Acoust Soc Am. 1996;100:3345–54. doi: 10.1121/1.416975. [DOI] [PubMed] [Google Scholar]
- 7.Alipour F, Berry DA, Titze IR. A finite-element model of vocal-fold vibration. J Acoust Soc Am. 2000;108:3003–12. doi: 10.1121/1.1324678. [DOI] [PubMed] [Google Scholar]
- 8.Oliveira Rosa M, Pereira JC, Grellet M, Alwan A. A contribution to simulating a three-dimensional larynx model using the finite element method. J Acoust Soc Am. 2003;114:2893–905. doi: 10.1121/1.1619981. [DOI] [PubMed] [Google Scholar]
- 9.Thomson SL, Mongeau L, Frankel SH. Aerodynamic transfer of energy to the vocal folds. J Acoust Soc Am. 2005;118:1689–700. doi: 10.1121/1.2000787. [DOI] [PubMed] [Google Scholar]
- 10.Drechsel JS, Thomson SL. Influence of supraglottal structures on the glottal jet exiting a two-layer synthetic, self-oscillating vocal fold model. J Acoust Soc Am. 2008;123:4434–45. doi: 10.1121/1.2897040. [DOI] [PMC free article] [PubMed] [Google Scholar]
- 11.Zhang Z, Neubauer J, Berry DA. The influence of subglottal acoustics on laboratory models of phonation. J Acoust Soc Am. 2006;120:1558–69. doi: 10.1121/1.2225682. [DOI] [PubMed] [Google Scholar]
- 12.Zhang Z, Neubauer J, Berry DA. Aerodynamically and acoustically driven modes of vibration in a physical model of the vocal folds. J Acoust Soc Am. 2006;120:2841–9. doi: 10.1121/1.2354025. [DOI] [PubMed] [Google Scholar]
- 13.Zhang Z, Neubauer J, Berry DA. Influence of vocal fold stiffness and acoustic loading on flow-induced vibration of a single-layer vocal fold model. J Sound Vib. 2009;322:299–313. doi: 10.1016/j.jsv.2008.11.009. [DOI] [PMC free article] [PubMed] [Google Scholar]
- 14.Hirano M, Kakita Y. Cover-body theory of vocal fold vibration. In: Daniloff RG, editor. Speech science – recent advances. San Diego: College-Hill Press; 1985. pp. 1–46. [Google Scholar]
- 15.Ogden RW. Large deformation isotropic elasticity – on the correlation of theory and experiment for incompressible rubberlike solids. Proc R Soc Lond A. 1972;326:565–84. [Google Scholar]
- 16.Pickup BA, Thomson SL. Influence of asymmetric stiffness on the structural and aerodynamic response of synthetic vocal fold models. J Biomech. 2009;42:2219–25. doi: 10.1016/j.jbiomech.2009.06.039. [DOI] [PMC free article] [PubMed] [Google Scholar]
- 17.Shurtz TE. Influence of supraglottal geometry and modeling choices on the flow-induced vibration of a computational vocal fold model. Brigham Young University; 2011. [Google Scholar]
- 18.Shurtz TE, Thomson SL. Influence of numerical model selections on the flow-induced vibration of a computational vocal fold model. Comput Struct. doi: 10.1016/j.compstruc.2012.10.015. in press. [DOI] [PMC free article] [PubMed] [Google Scholar]
- 19.Zhang H, Bathe KJ. Direct and iterative computing of fluid flows fully coupled with structures. In: Bathe KJ, editor. Computational fluid and solid mechanics. Elsevier; 2001. pp. 1440–3. [Google Scholar]
- 20.Bathe KJ, Zhang H. A flow-condition-based interpolation finite element procedure for incompressible fluid flows. Comput Struct. 2002;80:1267–77. [Google Scholar]
- 21.Bathe KJ, Hiller JF, Zhang H. On the finite element analysis of shells and their full interaction with Navier–Stokes fluid flows. In: Topping BHV, Bittnar Z, editors. Computational structures technology. Civil-Comp Press; 2002. pp. 1–31. [Google Scholar]
- 22.Bathe KJ. Finite element procedures. New Jersey: Prentice-Hall; 1996. [Google Scholar]
- 23.Zhang H, Zhang X, Ji S, Guo Y, Ledezma G, Elebbasi N, et al. Recent development of fluid–structure interaction capabilities in the ADINA system. Comput Struct. 2003;81:1071–85. [Google Scholar]
- 24.ADINA theory and modeling guide volume III: ADINA CFD & FSI. ADINA R&D Inc; 2010. pp. 44–5. [Google Scholar]


