Abstract
In this paper we describe enzyme-responsive fluorogenic micellar nanoparticles with detectable spectrophotometric properties unique to the particles and their aggregated state. These micelles are assembled from peptide-polymer amphiphiles (PPAs) labeled with either fluorescein or rhodamine. This is achieved by labelling otherwise similar block copolymer amphiphiles with each of the dyes. When mixed together, signals from the FRET-pairs can be utilized to detect particle assembly and hence enzymatic activity. Furthermore, we show FRET signals within the shell of the assembled micelles can be used to estimate particle stability (critical aggregation concentration) and enable a determination of intraparticle distances between amphiphiles in the micellar aggregates leading to elucidation of the packing arrangement of amphiphilic copolymers within the micelles.
Introduction
Enzymes are unique as biomarkers because they amplify detection events by catalytic turnover with selectivity that can be specific to given disease states.1-4 The specificity and diversity of reactions catalyzed by enzymes and their importance as signal-amplifying biomarkers make them exceptionally attractive as tools in the assembly and manipulation of nanoscale materials.5 In particular, nanoparticles capable of undergoing enzyme-programmed assembly, or morphology switches are of interest because unlike substrates such as fluorogenic oligopeptides, they can theoretically act as carriers of payloads that include specific molecular diagnostics and drugs. Although underutilized, enzymes have been harnessed as selective tools for the manipulation of nanoscale structures, a process that in itself constitutes a unique signaling event indicating enzyme activity.5-9 Such responses have proven detectable based on routine morphology analyses via methods including electron microscopy and light scattering. However, changes in nanoscale architecture will only be detectable in more challenging settings (e.g. in vivo) if the action of the enzyme results in an output signal unique to the assembly, such as a spectrophotometric response. To enable this, we have developed peptide-polymer amphiphiles (PPAs)10, 11 linked to dyes12 capable of undergoing efficient Förster Resonance Energy Transfer (FRET) for detecting structural properties and aggregation states of self-assembled enzyme-responsive nanoparticles. Herein, this concept is demonstrated for elucidation of particle stability, particle structure, and for monitoring enzyme-induced morphological transformations (Fig. 1).
Fig. 1.
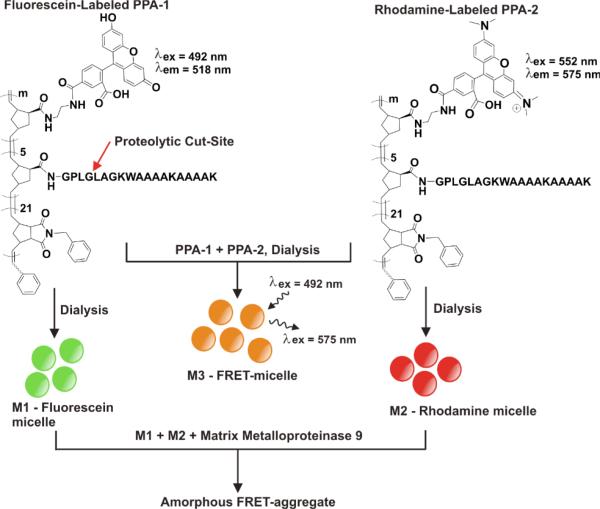
Assembly of peptide-polymer amphiphiles (PPAs) to generate fluorogenic micellar nanoparticles. Polymers were labeled with peptides4 and dyes, post-polymerization with block sizes determined by SECMALS analysis and spectroscopy. Degree of dye incorporation (m), was between 1 and 2 for both PPA-1 and PPA-2. See Supporting Information for complete synthetic details.
Results and Discussion
The PPAs utilized in these studies were designed as substrates for the cancer-associated enzyme, matrix-metalloproteinase 9 (MMP-9).13-15 By utilizing this substrate as the polar head group of the copolymer, the micelle morphology and aggregation behaviour of the materials could be modified via peptide cleavage by MMP at the Gly-Leu peptide bond (Fig. 1). We reasoned that enzymatic reactions occurring within the shell of the particles would facilitate a dramatic reduction in the hydrophilicity of the peptide-block, and would subsequently result in changes to the overall architecture via the establishment of new equilibria for surfactant aggregation. The polymers were synthesized using ring-opening metathesis polymerization16, 17 to generate block copolymers of a phenyl-modified norbornene as the hydrophobic block, a conjugatable NHS-ester for linkage through the amine terminus of the peptide, and a short block of primary amino-modified norbornene, for conjugation to dyes. As shown in Figure 1, micelles of fluorescein labelled PPA-1 (M1) and rhodamine labelled PPA-2 (M2) were prepared by dialysis of solutions of the polymers in DMSO/DMF (1:1) against buffered water over 24 h (see Supporting Information). In addition, micelles were prepared from mixtures of the two PPAs to generate the FRET-micelle, M3.
We aimed to develop a method that allows an accurate determination of the arrangement of polymeric amphiphiles packed within micelles and to monitor structural changes induced by responses to enzymes. Moreover, this method should be amenable to use in complex environments where other particulates may be present. Such solutions containing mixtures of particles are not easily amenable to analysis by light scattering or TEM image analysis. We determined that the distance dependence of FRET efficiency of appropriately paired dyes would provide such a route and indeed, has been extensively utilized in biochemical systems.18-21 However, the use of FRET efficiency for elucidating structural parameters in supramolecular self-assembled systems has been surprisingly limited, despite its great potential in determining solution phase structures of multicomponent assemblies.21 Relevant and notable exceptions involve the use of fluorescence energy transfer for studying interfacial regions in the assembly of nanoparticles and micelles.22-24 Here, we demonstrate that in addition to enabling a direct measurement of exceptionally low CAC for micelles, and a geometrical determination of aggregation number,23, 25 FRET-labeled PPAs can be utilized to sensitively monitor micellar nanoparticle response to enzymes. These parameters were determined by analysis of the distance dependence of FRET efficiency within polymeric micelles in which each amphiphile in the assembly is covalently end-labeled with one of two dyes in a pair. The result is micellar aggregates with dyes displayed on their surfaces.
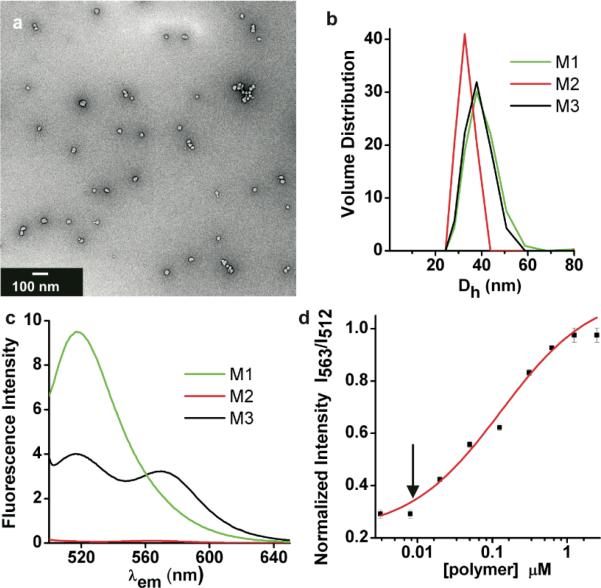
Initially, the fluorescence spectra and efficiency of FRET for a range of concentrations of PPA-1 and PPA-2 in the formation of micelles was studied (Fig. 2). M1, M2 and M3, are 35-40 nm in diameter as characterized by TEM (Fig. 2a for M3) and by DLS (Fig. 2b). The two single dye labeled micelles have the expected spectroscopic properties, with a peak due to fluorescein at 512 nm for M1 and no observable fluorescence upon excitation at 470 nm for M2 (Fig. 2c). However, blending PPA-1 and PPA-2 to form M3 provides a mixed dye micelle with fluorescent properties indicative of a FRET pair within the Förster radius as evidenced by rhodamine fluorescence observable at 563 nm. At PPA concentrations above 1 μM we found that the ratio of the intensities of each peak maximum (I563/I512) is constant. This indicates the maximum FRET efficiency possible for this system (Fig. 2d). However, upon dilution of M3 over the range from 2.5 μM to 2 nM, a greater decrease in intensity of the peak at 563 nm (rhodamine) compared to 512 nm (fluorescein) is observed. Therefore, a CAC of 8 nM is assigned for M3 as the concentration at which the onset of a detectable FRET signal is observed. This is a generalizable approach providing, in this case, an exceptionally sensitive and direct method for determining CAC. Such a labeling strategy for observing intact particles is especially useful in cases where they are particularly stable, limiting the utility of standard CAC determination assays using non-covalently associated solvochromatic dyes where limit of detection is significantly above CAC. Indeed, we have had no success implementing standard assays with regards to these systems and gathering accurate data at low concentrations. Direct labeling of the polymers also means they can be observed in complex milieu without the need for additional dye additives as will be highlighted in the context of enzymatic studies (vide infra).
Fig. 2.
TEM, DLS and fluorescence spectroscopy of fluorogenic micelles. a) TEM of 30 nm M3. b) DLS of M1, M2 and M3 showing hydrodynamic diameters (Dh) in the range of 30-40 nm. c) Fluorescence emission spectra of M1, M2 and FRET-micelle, M3 upon excitation at 470 nm. d) Ratio of normalized emission intensity for maxima at 563 nm (rhodamine) and 512 nm (fluorescein) over a range of concentrations of PPA-1 and PPA-2 upon excitation at 470 nm. Arrow indicates onset of detectable FRET.
In addition to determining particle stability, we sought to utilize the direct labeling strategy to elucidate structural features of the micelles. It has been shown that, if micelles are assumed to be assemblies of amphiphiles packed as cones with spherical bases, then the maximum integer number of amphiphiles in a micelle (Nsph) can be directly calculated if the angle at the vertex of each cone (α) is known (equation in Supporting Information).26 We hypothesized that the angle α could be directly determined knowing the distance (r) between fluorescein and rhodamine, that are assumed to be located at the centers of each cone (or copolymer amphiphile) in a spherical micelle (Fig. 3). The angle at the vertex (α) may be found via simple trigonometry because r is a chord between the centers of each spherical-based cone packed within micelles of radius, R. It follows that with experimentally measured values for R (TEM) and r (by FRET analysis), α can be calculated. Therefore, we assume that polymeric amphiphiles are close-packed cones that are not diffusing with respect to each other but are instead confined in restricted dimensions on the length scale relevant to FRET.22 Finally, each cone is end-labeled with donor or acceptor dyes that have fast rotational motion on the timescale of FRET.
Fig. 3.
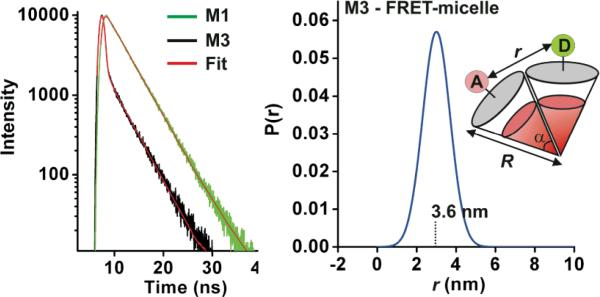
Time-domain fluorescence intensity decay analysis of M1 and M3 for determination of structural parameters. a) Fluorescence lifetime of M3 and M1 fit to a distance distribution function, and single exponential respectively (red lines) giving tD = 3.98 +/- 0.01 ns (from M1 data) for unquenched fluorescein. b) For M3, a range of distances between donor and acceptor (D and A) is considered, expressed as a probability function P(r). The mean distance, 3.6 nm, can in turn be used to determine tDA = 0.29 ns. Radius (R) of the micelles was determined by TEM (Figure 2).
The donor-acceptor (D-A) distance distribution was determined by analyzing the time-domain intensity decay of the donor (Fig. 3a).21 Therefore, we fit the data as a summation of donor decays for all accessible D-A distances (Fig. 3b, and Supporting Information). For M3, we have R = 15 nm, and r = 3.6 nm +/- 0.6, giving α = 14° +/- 2. Thus, we calculate Nsph = 241 +/- 60, taking account of the distribution about the mean distance between the donor and acceptor. This geometrically derived maximum aggregation number compares favorably with that determined from average particle molecular weight in solution by static light scattering (SLS) analysis of M3, which yields a weight average Nagg = 209 +/- 0.82. Furthermore, SLS was used to determine Nagg of 159 +/- 0.34 for M1, and 304 +/- 2.3 for M2. It is clear that these values are on the same order, as expected for similar surfactants generating similar sized micellar nanoparticles. Indeed, the order of this aggregation number for this class of surfactant could be corroborated by counting particles in TEM images whereby the number of micelles per L was determined by mixing them with a stock solution of 20 nm gold nanoparticles (see Supporting Information). This FRET approach therefore provides a viable method for monitoring particle assembly and detailed structural features in PPA assemblies without requiring TEM or SLS.
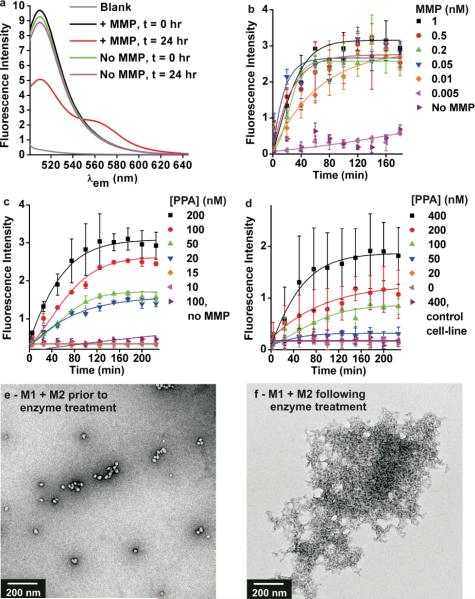
PPA-1 and PPA-2 were designed as substrates for MMPs. Therefore, we sought to study enzyme-induced rearrangement of the micelles, aiming to analyze the process via fluorescence spectroscopy in buffer solutions (Fig. 4). Furthermore, to demonstrate the utility of FRET in analyzing micelle behavior in biological milieu, we examined their response to MMP-9 in blood serum doped samples of cell-growth media. Initial experiments were conducted to study enzyme kinetics on the micelle-based substrates (see Supporting Information). These were conducted by preparing a micelle from a PPA, end-labeled with fluorescein and conjugated to a peptide labeled with Dabcyl as a quencher, that when cleaved resulted in an ON-switch of fluorescence. These studies confirm that kinetics were similar on both particle-linked substrates and simple oligopeptide substrates. Next, we mixed M1 and M2 together with purified, commercial MMP-9 and observed the emission spectra over time (Fig. 4a) showing the formation of a new FRET-active species in solution as PPAs are cleaved and rearrange into aggregates containing both dyes. We note that peptide cleavage rates and formation of the new FRET signal, indicating aggregate formation, are similar and therefore consistent with them being concomitant processes. The peptide fragments could be quantified by HPLC (41% cleavage efficiency after 24 hrs), and characterized by MALDI (see Supporting Information). This low efficiency may be due to steric hinderance within the particle shells, or within the aggregates as they form during the reaction. Despite this, the particles are sufficiently susceptible to allow a complete shift to the aggregated species as evidenced by DLS (see Supporting Information). Furthermore, the FRET efficiency calculated from donor lifetimes is comparable to, but is reduced for these aggregates (Efficiency = 85%) compared to M3 (Efficiency = 93%). In addition, the relative inhomegeneity of the aggregates compared to the control particles (M3) is observed by comparison of ratios of donor and acceptor intensities in Fig. 2c (1:0.8) vs Fig. 4a (1:0.43). This is consistent with a less homogeneous distribution of donors and acceptors. Despite this slight decrease in FRET efficiency, the response is clearly observable down to 10 pM of MMP-9 for solutions containing 0.5 μM of micelles (Fig. 4b – concentration of micelles is with respect to PPA in each case). Furthermore, MMP-9 at 10 nM is observable down to 20 nM of PPA (Fig. 4c), a result that is consistent with the exceptional stability of these aggregates with CACs in the range of 10 nM. In addition, M1 and M2 underwent enzyme-induced aggregation when treated with a mixture of expressed MMPs (Fig. 4d). We note that these particles were designed to be responsive to both cancer-associated enzymes MMP-2 and MMP-9 as expected for the substrate sequence chosen. These experiments were performed by treating M1 and M2 with cell growth media containing MMPs excreted over 24 hrs from WPE1-NA45 cells, and present at 0.048 nM and 0.005 nM (MMP-2 and -9 respectively) as determined by a quantitative ELISA assay (see Supporting Information). In this case, substrate concentrations of 100 nM (with respect to PPAs) resulted in observable responses within 4 hr reaction time. Finally, this enzyme-induced rearrangement of PPAs was characterized by TEM, confirming the formation of a new aggregated species upon cleavage of the peptide sequence in M1 and M2 (Fig. 4e-f, see Supporting Information for M3 + MMP-9). It is this aggregated species that carries both dyes, in close enough proximity to allow spectroscopic characterization by FRET. To demonstrate the utility of the labeling approach in the detection of enzymes in more complex media, we mixed M1 and M2 in blood serum doped cell media samples and treated them with MMP-9 (Table 1). This resulted in an easily detectable and significant shortening of the fluorescence lifetime.
Fig. 4.
Response of mixtures of M1 and M2 to MMPs. a) Fluorescence spectra of M1 and M2 (0.5 μM each with respect to PPA) with and without MMP-9 (10 nM) at times indicated following enzyme addition; λex = 470. b-d) Fluorescence intensity vs time plots via plate reader analysis, to monitor rearrangement of PPA-1 and PPA-2 into new FRET active aggregates; λex = 490 and λem = 590 nm. b) Detection of MMP-9 down to 10 pM of enzyme with M1 and M2 (at 0.5 μM, [PPA]). c) Detection of MMP-9 at 10 nM with varying concentrations of M1 and M2 shown with respect to [PPA], detectable down to 20 nM of polymer. d) Detection of cell-secreted (WPE1-NA45 cells) MMP-2 and -9 with varying concentrations of M1 and M2 shown with respect to [PPA]. Cells were seeded at 1.6 × 10⁴ cells/well in a clear bottom 96-well plate in DMEM. After 24 hrs, cell medium was added to solutions of M1 and M2. MMP-2 and -9 were at 0.048 nM and 0.005 nM respectively as quantified by an ELISA assay (see Supporting Information) Control was the non-MMP expressing MCF-7 cell-line cultured in the same manner. All reactions run in PBS, unless otherwise noted. e-f) TEM of M1 and M2 before, and after 24 hrs following MMP-9 treatment.
Table 1.
Detection of MMP-9 at 10 nM in blood serum doped DMEM, cell growth medium.
| Micelle[a] | MMP-9 | Solution conditions[b] | Fluorescence lifetime, t (ns) |
|---|---|---|---|
| M1 | - | 20% serum | 3.94 +/- 0.03 |
| M1 | + | 20% serum | 3.93 +/- 0.01 |
| M1 + M2 | - | 20% serum | 3.93 +/- 0.01 |
| M1 + M2 | + | 20% serum | 0.56 +/- 0.02 |
| M1 + M2 | + | no serum | 0.59 +/- 0.01 |
Micelle concentrations for M1 and M2 are 0.1 μM, and 1 μM respectively, with respect to PPA concentration.
Micelles were incubated under these conditions at 37 °C for 24 hrs prior to measuring lifetimes. DMEM = Dulbecco's Modified Eagle Media. Detection of MMP in blood serum doped DMEM media via significant shortening in fluorescence lifetime indicating particle fusion upon cleavage of PPAs within M1 and M2.
Conclusions
We have described nanoparticles that undergo enzyme-induced changes in structure detectable in complex environments. This is a necessary step in the future implementation of enzyme-programmed materials in in vivo applications. In particular, where enzymatic signals are specific to given disease states including inflammation and metastasis.14 This is enabled by a labeling approach that provides critical information regarding particle structure and stability. Together, these studies are consistent with exceptionally stable micelles that show no detectable scrambling of PPAs when mixed together in the absence of MMP. Moreover, the enzymatic response constitutes a novel approach to the detection of enzymes whereby the stimulus induces detectable changes in nanoparticle morphology. We note that this is not intended as a technology towards sensitive diagnostic detection of enzymes in vitro, but rather for analyzing and utilizing the response of nanomaterials to enzymes as they undergo complex changes in structure.27 Furthermore, by detecting changes in fluorescence lifetime induced by rearrangement of appropriately labeled polymers, these processes can be observed in complex milieu. We propose that this type of FRET-pair labeling strategy will be generally useful to those wanting to monitor particle aggregation state in complex environments, where light scattering and electron microscopy suffer deleterious interference from other particulates and detritus. We are currently examining this labeling approach for its utility in monitoring the response of nanoparticles to disease-associated enzyme activity in vivo.
Supplementary Material
Acknowledgements
The authors acknowledge support for this program from AFOSR through a PECASE (FA9550-11-1-0105). In addition, we acknowledge support from ARO (W911NF-11-1-0264). Furthermore, we thank NIH (NIBIB) for their generous support (1R01EB011633) and via a NIH Director's New Innovator Award (1DP2OD008724). N.C.G. acknowledges the Henry & Camille Dreyfus Foundation for a New Faculty Award. E.C.L. acknowledges support from NIBIB (P41EB002031). We thank Prof. Akif Tezcan for his insights and helpful suggestions.
Footnotes
Electronic Supplementary Information (ESI) available: See DOI: 10.1039/b000000x/
Notes and references
- 1.Saiki RK, Scharf S, Faloona F, Mullis KB, Horn GT, Erlich HA, Arnheim N. Science. 1985;230:1350–1354. doi: 10.1126/science.2999980. [DOI] [PubMed] [Google Scholar]
- 2.Engvall E, Perlmann P. Immunochemistry. 1971;8:871–874. doi: 10.1016/0019-2791(71)90454-x. [DOI] [PubMed] [Google Scholar]
- 3.Zhu L, Anslyn EV. Angew. Chem. Int. Ed. 2006;45:1190–1196. doi: 10.1002/anie.200501476. [DOI] [PubMed] [Google Scholar]
- 4.Jiang T, Olson ES, Nguyen QT, Roy M, Jennings PA, Tsien RY. Proc. Natl. Acad. Sci. 2004;101:17867–17872. doi: 10.1073/pnas.0408191101. [DOI] [PMC free article] [PubMed] [Google Scholar]
- 5.Hahn ME, Gianneschi NC. Chem. Commun. 2011 doi: 10.1039/c1cc15220c. [DOI] [PMC free article] [PubMed] [Google Scholar]
- 6.Von Maltzahn G, Harris TJ, Park J-H, Min D-H, Schmidt AJ, Sailor MJ, Bhatia SN. J. Am. Chem. Soc. 2007;129:6064–6065. doi: 10.1021/ja070461l. [DOI] [PMC free article] [PubMed] [Google Scholar]
- 7.Ku TH, Chien MP, Thompson MP, Sinkovits RS, Olson NH, Baker TS, Gianneschi NC. J. Am. Chem. Soc. 2011;133:8392–8395. doi: 10.1021/ja2004736. [DOI] [PMC free article] [PubMed] [Google Scholar]
- 8.Amir RJ, Zhong S, Pochan DJ, Hawker CJ. J. Am. Chem. Soc. 2009;131:13949–13951. doi: 10.1021/ja9060917. [DOI] [PubMed] [Google Scholar]
- 9.Ulijn RV. J. Mater. Chem. 2006;16:2217–2225. [Google Scholar]
- 10.Cui H, Webber MJ, Stupp SI. Peptide Science. 2009;94:1–18. doi: 10.1002/bip.21328. [DOI] [PMC free article] [PubMed] [Google Scholar]
- 11.Chen C-L, Zhang P, Rosi NL. J. Am. Chem. Soc. 2008;130:13555–13557. doi: 10.1021/ja805683r. [DOI] [PMC free article] [PubMed] [Google Scholar]
- 12.Behanna HA, Rajangam K, Stupp SI. J. Am. Chem. Soc. 2007;129:321–327. doi: 10.1021/ja062415b. [DOI] [PubMed] [Google Scholar]
- 13.Kessenbrock K, Plaks V, Werb Z. Cell. 2010;141:52–67. doi: 10.1016/j.cell.2010.03.015. [DOI] [PMC free article] [PubMed] [Google Scholar]
- 14.Scherer RL, McIntyre JO, Matrisian LM. Cancer Metastasis Rev. 2008;27:679–690. doi: 10.1007/s10555-008-9152-9. [DOI] [PubMed] [Google Scholar]
- 15.Vartak DG, Gemeinhart RA. Journal of Drug Targeting. 2007;15:1–20. doi: 10.1080/10611860600968967. [DOI] [PMC free article] [PubMed] [Google Scholar]
- 16.Trnka TM, Grubbs RH. Acc. Chem. Res. 2001;34:18–29. doi: 10.1021/ar000114f. [DOI] [PubMed] [Google Scholar]
- 17.Smith D, Pentzer EB, Nguyen ST. Polymer Reviews. 2007;47:419–459. [Google Scholar]
- 18.Stryer L. Annu. Rev. Biochem. 1978;47:819–846. doi: 10.1146/annurev.bi.47.070178.004131. [DOI] [PubMed] [Google Scholar]
- 19.Clegg RM. Methods Enzymol. 1992;211:353–388. doi: 10.1016/0076-6879(92)11020-j. [DOI] [PubMed] [Google Scholar]
- 20.Selvin PR. Nat Struct Biol. 2000;7:730–734. doi: 10.1038/78948. [DOI] [PubMed] [Google Scholar]
- 21.Lakowicz JR. Principles of Fluorescence Spectroscopy. 1983 [Google Scholar]
- 22.Farinha JPS, Martinho JMG. J. Phys. Chem. C. 2008;112:10591–10601. [Google Scholar]
- 23.Schillen K, Yekta A, Ni S, Farinha JPS, Winnik MA. J. Phys. Chem. B. 1999;103:9090–9103. [Google Scholar]
- 24.Farinha JPS, Schillen K, Winnik MA. J. Phys. Chem. B. 1999;103:2487–2495. [Google Scholar]
- 25.Prazeres TJV, Beija M, Charreyre M-T, Farinha JPS, Martinho JMG. Polymer. 51:355–367. [Google Scholar]
- 26.Tsonchev S, Schatz GC, Ratner MA. Nano Lett. 2003;3:623–626. [Google Scholar]
- 27.Samarajeewa S, Shrestha R, Li Y, Wooley KL. J. Am. Chem. Soc. 2012;134:1235–1242. doi: 10.1021/ja2095602. [DOI] [PMC free article] [PubMed] [Google Scholar]
Associated Data
This section collects any data citations, data availability statements, or supplementary materials included in this article.


