Abstract
We report an ab-initio simulation study of the ultrafast broad bandwidth ultraviolet (UV) stimulated resonance Raman spectra (SRRS) of L-tyrosine, L-tryptophan and trans-L-tryptophan-L-tyrosine (WY) dipeptide. Two-pulse one-dimensional (1D) SRRS and three-pulse 2D SRRS that reveal inter- and intra-residue vibrational coorelations are simulated using electronically resonant or preresonant pulse configurations that select the Raman signal and discriminate against excited state pathways. Multimode effects are incorporated via the cumulant expansion. The 2D SRRS technique is more sensitive to residue couplings than spontaneous Raman.
I. INTRODUCTION
Raman spectroscopy can provide detailed information on the structure and dynamics of molecules and molecular complexes, thanks to the sensitivity of vibrations to the local chemical environment.1,2 Resonance Raman spectroscopy selectively enhances those vibrational modes that are strongly coupled to the selected electronic transition. Ultraviolet resonance Raman (UVRR) has been a powerful tool in the study of protein secondary structure.3–11 Unlike infrared spectra, peptide resonance Raman bands of proteins do not overlap with vibrational modes of water, making them suitable for biological systems in aqueous environment. Deep UV (≤ 210 nm) photons excite the π–π* transitions of the protein backbone and show strong activity of the AmI, AmII, AmIII and Cα–H modes, which depend on the secondary structure. Asher et al. had developed empirical relationships between the AmIII frequencies and the Ramachandran Ψ angles of proteins. The secondary structure of complex proteins can be obtained by deconvoluting the AmIII peaks.7,8,10 With the help of hydrogen-deuterium exchange, hydrogen bonded N–H atoms can be distinguished in a protein.7,11–13 Lednev et al. used deep UVRR technique to distinguish the fibril core structure of parallel and antiparallel amyloid fibrils.7,11 The present study focuses on the near UV (280~210 nm) π–π* transitions of aromatic side chain residues, which are well separated from the deep UV peptide n–π* and π–π* excitations. Spontaneous Raman signals from tryptophan and tyrosine residues are often used as structural markers of proteins.14–16
Ultrafast broadband coherent Raman spectroscopy is widely employed to investigate the the dynamics of intra- and intermolecular vibrational modes.17–23 One dimensional stimulated resonance Raman (1DSRR) signals are obtained by varying the time delay t1 between two ultrafast pump and probe pulses, these can be displayed in the frequency domain by a Fourier transform with respect to t1. Tanimura and Mukamel have proposed an off resonant 2D stimulated fifth-order Raman scattering experiment with two pump pulses followed by a probe24. The two dimensional (2D) stimulated Raman signal is displayed by double Fourier transform with respect to the two controlled time delays t1 and t2, and carries rich information about vibrations. UV pulses are under current development,25–30 making multidimensional broadband UV resonant Raman experiments feasible.
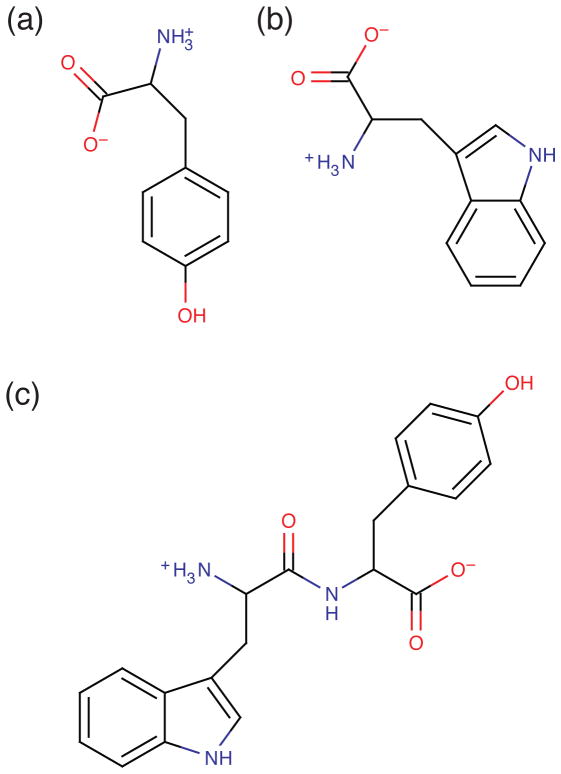
We compare the spontaneous and stimulated 1D and 2D resonance Raman signals of L-tyrosine (Y), L-tryptophan (W), and the trans-L-tryptophan-L-tyrosine (WY) dipeptide (see Fig. 1). The near UV spectra originate from the phenol (tyrosine) and indole (tryptophan) chromophores. There are two aromatic π–π* electronic transitions above 210 nm in tyrosine and four in tryptophan.31–33 Since vibrational modes are localized on specific chromophores, by using excitation pulses resonant with specific electronic transitions, the Raman peaks can often be assigned, even when their frequencies overlap. The correlation between vibrational modes localized at different groups in the WY dipeptide in 2DSRR spectra is examined by appropriate pulse configurations. The 2D technique is also superior to spontaneous Raman in distinguishing W/Y mixture and WY dipeptide.
FIG. 1.
Structure of (a) tyrosine, (b) tryptophan and (C) trans-Trp-Tyr (WY) dipeptide.
Spontaneous and stimulated time-domain multi-pulse resonance Raman signals are described in section II. Computational details are given in section III. Simulation results are presented in section IV–VII, and we conclude in section VIII.
II. THEORY
A. UV Absorption
We assume a linearly displaced two-state harmonic vibrational Hamiltonian,
| (1) |
with
| (2) |
Here qj and pj is the dimensionless coordinate and momentum of the j-th normal mode, εe is the excitation energy of electronic state |e〉 and is the dimensionless displacement. The displacements were evaluated by using the excited state gradient method.11,34,35 The UV absorption spectra were calculated using the cumulant expression,2
| (3) |
where the line broadening function and electronic excitation energy are given by
| (4) |
| (5) |
Here β = 1/kBT is the inverse temperature and kB is the Boltzmann constant. We used T = 300 K and electronic linewidth Γ = 100 cm−1.
B. Spontaneous resonance Raman
The spontaneous Raman signal is given by the Kramers-Heisenberg formula,
| (6) |
where ω1 and ω2 are the incident and signal frequencies, respectively. |c〉 and |a〉 are the final and initial vibrational states in the ground electronic state, and P(a) is the population of state |a〉. The transition polarizability α is given by summing over intermediate vibronic states |b〉,
| (7) |
The number of relevant vibronic states increases exponentially with the number of vibrational modes. We have avoided these summations by using a multimode expression for RR signals based on the cumulant expansion for linearly displaced harmonic vibrations given in appendix A. We have added a vibrational linewidth Γca = 10 cm−1 to the delta function δ(ω1 − ω2 − ωca).
C. Selection of the Stimulated Resonance Raman Signal
The impulsive pump probe signal which employs two pulses separated by a delay t1 contains both ground state and excited state contributions as shown in the loop diagrams in Fig. 2. These diagrams provide a compact representation of the time evolution of the wavefunction which contributes to the nonlinear signal, in much the same way that the ladder diagrams2 represent the density-matrix evolution. In the loop diagrams, time flows clockwise from the bottom left to the bottom right, with forward (ket) evolution on the left branch and backward (bra) evolution on the right branch. Arrows pointing to (away from) the loop represent absorption (emission). Diagram rules can be found in Ref. [36]. We are interested in Diagrams I and II which represent stimulated Raman scattering (SRS), where the pump interacts twice in an up-and-down fashion, creating a vibrational coherence. In the excited state contributions (diagrams III and IV), the pump pulse creates a vibrational wave packet in the excited electronic state in both the ket and bra. The coherence between these wave packets can then be probed via a down-and-up transition, in a process known as excited state stimulated emission (ESE, diagram III). The probe can further induce an up-and-down transition to a doubly excited state, giving rise to as excited-state absorption (ESA, diagram IV).
FIG. 2.
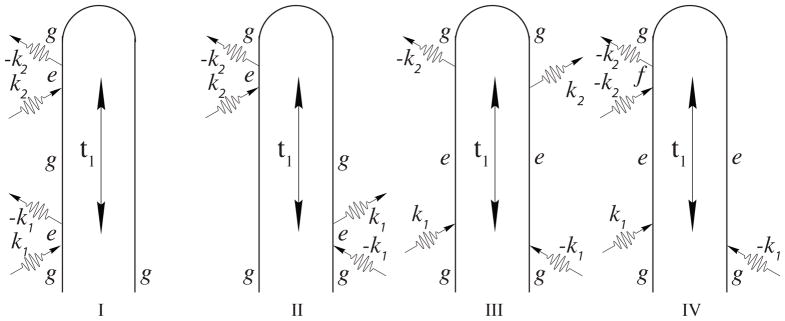
The four loop diagrams for the pump-probe experiment with well separated pulses. Diagrams I and II represent stimulated resonance Raman (SRR), III is excited state stimulated emission (ESE), and IV is excited-state absorption (ESA).
The Fourier transformed signal
| (8) |
will show peaks corresponding to the difference in energy between the ground state and vibrationally excited states, i.e. fundamental, overtone, and combination bands. The SRS signals are easy to interpret since they only depend on ground state frequencies and are not affected by the complex photochemical and photophysical nonadiabatic processes that occur in UV excited states. For applications as markers to protein structure, it is therefore desirable to eliminate the excited state contributions and isolate the SRS signal. This will be discussed in the following.
The excited state contributions can be eliminated by using electronically off resonant pump and probe pulses. However, in this case we lose the selectivity of the resonance Raman process. To a given chromophore, if the excited electronic state has a very short (radiative or non-radiative) lifetime, any electronically excited population created by the pump will have decayed, before the arrival of the probe and will therefore not contribute to the signal, we can then select the SRS diagrams. For example, the Soret excited states in heme-containing molecules have lifetimes of tens of femtoseconds, and any long-lived vibrational coherence detected at this excitation window can be attributed solely to the ground electronic state17. This is also the case in stimulated x-ray Raman spectroscopy (SXRS),37 which involve core transitions with very short (~10 fs) lifetimes38. This does not apply to tyrosine or tryptophan which have long electronic lifetimes (≤ 10 ns).39
We shall discriminate against the excited state contributions, by using the fact that the excited state population decays much more rapidly with detuning than the ground state contribution. We show in appendix B that for Gaussian pulses the excited state contribution will vary as exp(−d2), with the effective detuning d ≡ σ(Ω − ωeg), where Ω is the pulse center frequency and ωeg is the excitation energy, while the SRS contribution varies as 1/d. It is therefore possible to isolate the SRS signal by tuning the pump pulse to the preresonant region, while keeping the resonant enhancement by a resonant probe. This strategy is easily extended to 2D by making both pumps preresonant. It is also possible to enhance the ESE contribution over the SRS and ESA by using resonant pump and red-shifted probe.
D. One-dimensional stimulated Resonance Raman (1DSRR)
The stimulated Raman signal represented by diagrams I and II of Fig. 2 is given by, 37
| (9) |
where the effective polarizability due to the n-th pulse is
| (10) |
here |c〉 and |c′〉 are vibrational eigenstates in the ground electronic state. α̂(n) is a non-Hermitian operator in the vibrational subspace, it becomes real Hermitian far off resonance, where Eq. 9 reduces to a commutator. 40 The 1D signal is recorded versus the pump-probe delay, and displayed in the frequency domain by performing a Fourier transform (Eq. 8).
E. Two-dimensional stimulated resonance Raman (2DSRR)
The 2D stimulated Raman signal is obtained by adding a second pump resulting in the three-pulse pump-pump-probe configurations shown in Fig. 3. The first pulse creates a vibrational excitation in either the ket (Si and Siv) or the bra (Sii and Siii). The second pulse can either create another pure vibrational excitation on the opposite side of the density matrix (Si and Siii) or change the excitation created by the first (Sii and Siv).
FIG. 3.
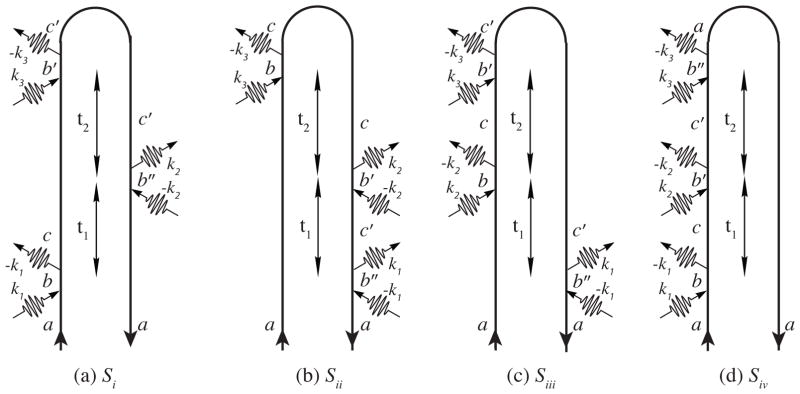
Loop diagrams for the 2D Raman signal
The 2D signal is given by,
| (11) |
It will be displayed as frequency-frequency correlation plots obtained by a double Fourier transform,
| (12) |
III. COMPUTATIONAL DETAILS
We used the Gaussian 0941 package with time-dependent density functional theory (TDDFT), the PBE0 functional42,43 and 6-311++G(d,p) basis set in the calculations. The geometry was optimized to minimize its ground state energy, excited state gradients and displacements were calculated at that geometry. The conductor-like polarizable continuum model (CPCM)44,45 was used to perform the self consistent reaction field calculations in the aqueous environment. To correct for the systematic error in the density functional frequency calculations, we scaled all vibrational frequencies by a factor of 0.97.46,47 Gaussian pulses envelopes with 1768 cm−1 (8.33 fs) FWHMs were used. This width covers a substantial region of the absorption spectrum as shown in Fig. 11(c) and (d).
FIG. 11.
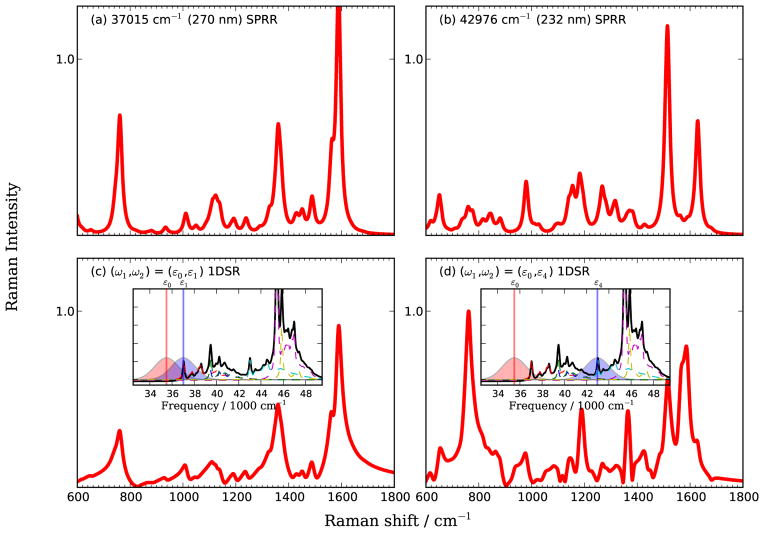
Top: SPRR spectra of WY dipeptide calculated at ω1 resonant with ε1:Trp-Lb (left) and ε4:Tyr-La (right). Bottom: 1DSRR spectra calculated for a pre-resonant pulse (ω1 = 35500 cm−1) as pump and probe pulse resonant with ε1 (left) and ε4 (right). Pulses are shown in the inserts.
IV. UV ABSORPTION SPECTRA
To avoid overlap with the peptide n-π* and π-π* transitions, we focus on the electronic aromatic π-π* transitions below 47620 cm−1 (≥210 nm). The calculated dipole-allowed electronic excitations are given in Table I. Using Platt’s notation48 for benzene electronic excitations, the two excited states of tyrosine at 251 and 222 nm are assigned as the Lb and La, respectively. These transition dipole moments are perpendicular. The 268 and 253 nm peaks of tryptophan are assigned as Lb and La transitions, and the Trp-Bb transition is split into two peaks since the D6h symmetry is broken. The Trp-Ba transition lies below 200 nm. The two Tyr transitions and the four Trp transitions are present in the dipeptide, with slight shifts due to the change of chemical environments of each aromatic group. The natural transition orbitals49 of the electronic transitions presented in Fig. S1–S3 [Supporting Information] show that the hole (left) and electron (right) states are localized on the aromatic groups.
TABLE I.
≥200 nm UV electronic transitions of tyrosine, tryptophan and trans-WY dipeptide.
| System | Excitation | λ/nm | ν̃/cm−1 | Dipole/Debye
|
Description | ||||
|---|---|---|---|---|---|---|---|---|---|
| x | y | z | |μ|2 | ||||||
| Tyr | 251 | 39840 | 0.2591 | 0.8256 | −0.0460 | 0.7509 | Lb | ||
| 222 | 45063 | −1.4171 | 0.1179 | 0.4182 | 2.1970 | La | |||
| Trp | 268 | 37228 | 0.5406 | 1.1506 | −0.2523 | 1.6856 | Lb | ||
| 253 | 39484 | −0.6788 | 0.6651 | −0.3767 | 1.0450 | La | |||
| 222 | 45023 | 1.9159 | −1.5794 | 0.8076 | 6.8160 | Bb | |||
| 215 | 46351 | 0.5879 | −0.7750 | 0.5128 | 1.2092 |
|
|||
| WYD | ε1 | 270 | 37015 | 0.2302 | −0.2888 | 1.2589 | 1.7212 | Trp–Lb (π → π*) | |
| ε2 | 254 | 39389 | 0.7973 | −0.2485 | 0.0880 | 0.7051 | Tyr–Lb (π → π*) | ||
| ε3 | 253 | 39461 | 0.7478 | −0.5153 | 0.0507 | 0.8272 | Trp–La (π → π*) | ||
| ε4 | 232 | 42976 | −0.4976 | −1.3340 | 0.5809 | 2.3646 | Tyr–La (π → π*) | ||
| ε5 | 220 | 45390 | 1.9180 | −1.3655 | 0.2285 | 5.5959 | Trp–Bb (π → π*) | ||
| ε6 | 218 | 45827 | −0.9231 | 0.4962 | −0.1731 | 1.1282 | (π → π*) | ||
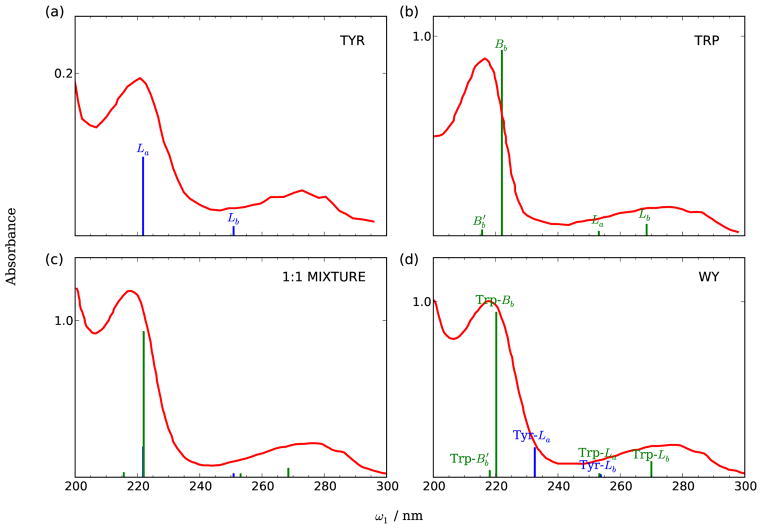
The calculated electronic excitations of tyrosine (Y), tryptophan (W), 1:1 W/Y mixture and WY dipeptide in aqueous solution are compared with experimental absorption spectra in Fig. 4. Spectra of the mixture are obtained by adding the tyrosine and tryptophan contributions. As shown in panels (a) and (b), both tyrosine and tryptophan have strong absorption at ~220 and ~270 nm. The ~270 nm bands for both tyrosine and tryptophan are assigned as the Lb transitions. The ~220 nm band is assigned as the La transition for tyrosine, but as the Bb transition for tryptophan. The experimental absorption spectra of 1:1 W/Y mixture and WY dipeptide are very similar [red lines in panels (c) and (d)], and are dominated by two bands at 270 and 218 nm. The broad peak at 260–280 nm consists of the Trp-Lb, Trp-La, and the Tyr-Lb transitions, and the peak centered at 220 nm consists of the Tyr-La and Trp-Bb transitions. The TDDFT/PBE0 excitation energies of Trp-Lab and Tyr-Lb bands are overestimated compared with experiment.50 The Tyr-La transition is redshifted from 222 nm to 232 nm upon binding with tryptophan, results in a smaller splitting between Tyr-Lb and Tyr-La transitions. The splitting between Trp-Bb and is also smaller in the dipeptide than in tryptophan monomer, which can be rationalized since the electronic states are more delocalized in the dipeptide.
FIG. 4.
Experimental absorption spectra and calculated electronic stick spectrum of (a) tyrosine (blue), (b) tryptophan (green), (c) 1:1 mixture and (d) WY dipeptide. The experimental spectra of tyrosine and tryptophan are taken from Ref51. The spectra of 1:1 mixture and dipeptide are taken from Ref31.
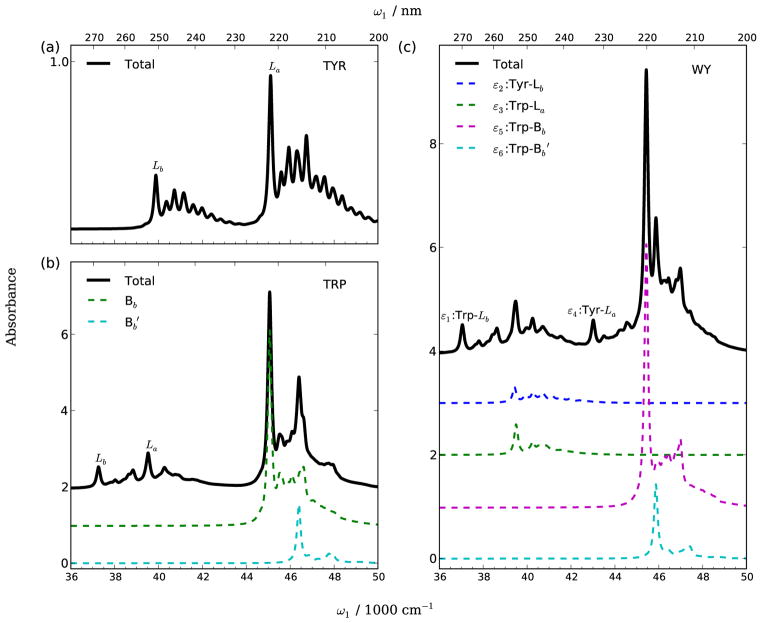
Fig. 5 shows the absorption spectra calculated using Eq. 3. For all the three systems, the main peak corresponding to each electronic excitation come from the |0e〉 ← |0g〉 transition. The tailing peaks in the high-frequency side of the main peaks correspond to |1e〉 ← |0g〉 transitions for different vibrational modes. There is substantial overlap between different electronic transition contributions in the tryptophan and WY dipeptide. For instance, the splitting between the Trp-Bb and transitions are 1328 and 427 cm−1 in tryptophan and WY, respectively, and are lower than the vibrational energy of the mode ν40 (W8b, 1588 cm−1).
FIG. 5.
Simulated absorption spectra of (a) tyrosine, (b) tryptophan, and (c) trans WY dipeptide in aqueous solution. Vibronic contributions are included by using the cumulant expansion. Over-lapping electronic transitions are shown by dashed lines. An electronic linewidth Γ =100 cm−1 is used.
V. SPONTANEOUS RESONANCE RAMAN SPECTRA (SPRR)
The 42 Raman active vibrational modes of WY are listed in Table II. Almost all modes are localized either on the tryptophan (cyan) or on the tyrosine (magenta). Delocalized or peptide vibrational modes (uncolored) are expected to be resonantly enhanced by both Trp and Tyr transitions.
TABLE II.
Active vibrational modes in the range 600–1800 cm−1.
| Modes | Freq (cal., cm−1) | Description |
|---|---|---|
| ν1 | 617.15 | W ring out of plane deformation, Y peptide N-H bending |
| ν2 | 650.95 | Y peptide N–H bending |
| ν3 | 735.86 | W ring stretching, C–H out-of-plane bending |
| ν4 | 743.18 | W ring out-of-plane deformation, N–H bending |
| ν5 | 753.08 | W ring out-of-plane deformation |
| ν6 | 758.52 | Y C–C=O bending, Cα–H/N–H bending |
| ν7 | 761.42 | W ring breath |
| ν8 | 776.40 | Y Bz ring in-plane deformation, Bz–OH stretching |
| ν9 | 814.05 | Y Bz out-of-plane C–H bending (11) |
| ν10 | 838.03 | Y Bz out-of-plane C–H bending (11), C–C=O stretching |
| ν11 | 846.84 | Y Bz ring symmetric breath (1) |
| ν12 | 865.98 | W ring in-plane deformation |
| ν13 | 881.02 | peptide bending |
| ν14 | 979.19 | Y Cα–C=O stretching |
| ν15 | 1010.75 | W Bz ring symmetric breath |
| ν16 | 1111.62 | W Bz C–H bending |
| ν17 | 1124.37 | W Bz H–C–C–H scissor bending |
| ν18 | 1138.82 | W Bz H–C–C–H scissor bending |
| ν19 | 1139.82 | Y peptide C–H/Cα–H bending |
| ν20 | 1154.96 | Y Bz H–C–C–H scissor bending |
| ν21 | 1181.47 | peptide N–H bending |
| ν22 | 1192.97 | peptide N–H/Cα–H bending |
| ν23 | 1229.56 | W pyrrole ring deformation, pyrrole N–H bending |
| ν24 | 1239.13 | W ring ring C–H/N–H in-plane bending |
| ν25 | 1253.95 | Y Bz–OH stetching (20a) |
| ν26 | 1266.77 | Y 8a |
| ν27 | 1281.21 | Y peptide C–H bending |
| ν28 | 1316.83 | Y 3 |
| ν29 | 1327.06 | W peptide C–H bending |
| ν30 | 1347.49 | W ring C–H/N–H bending |
| ν31 | 1359.86 | W 14 |
| ν32 | 1370.44 | W Cα–H bending |
| ν33 | 1382.96 | Y peptide C–H bending, C–C=O stretching |
| ν34 | 1425.18 | W 6π |
| ν35 | 1451.54 | W 19b |
| ν36 | 1488.75 | W 19a |
| ν37 | 1507.50 | Y 19a |
| ν38 | 1514.60 | Y 18a |
| ν39 | 1562.64 | W pyrrole ring stretching |
| ν40 | 1588.43 | W 8b |
| ν41 | 1590.35 | W NH3 bending, ring stretching |
| ν42 | 1628.72 | Y 20a |
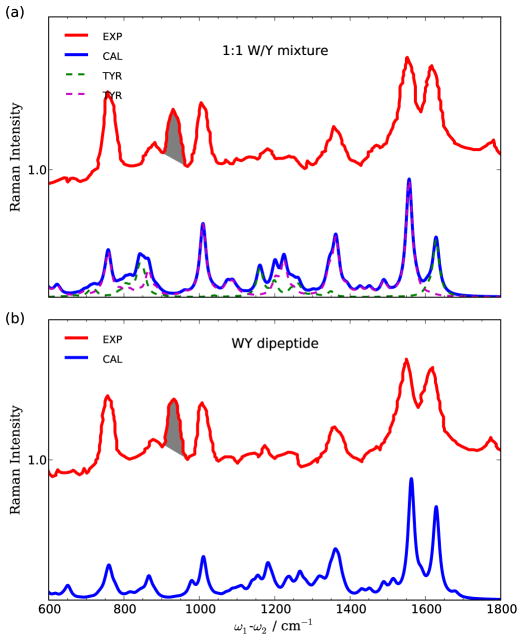
To benchmark our simulation protocol, we first compare our calculated spontaneous resonance Raman spectra (Eq. 6) with experiment. Fig. 6 shows the experimental UVRR spectra of 1:1 W/Y mixture and WY dipeptide excited at 255 nm, which is resonant with the Trp-Bb and Tyr-La transitions.31 The dominant peaks at 1555, 1350, 1015 and 760 cm−1 corresponds to the totally symmetric Trp modes, and the 1610 cm−1 peak represents Tyr ring mode (Y20a31,32). The spontaneous UVRR spectra of W/Y mixture and WY dipeptide are very similar; it is difficult to distinguish different bonding patterns of systems containing tyrosine and tryptophan residues by using 225 nm spontaneous Raman. These are reproduced by our simulations. The contributions from tyrosine and tryptophan monomers are shown as dashed lines in Fig. 6(a). The 1610 cm −1 Y20a mode is predicted as 1628 cm−1, as listed in Table II. The calculated frequencies of active tryptophan modes are 1562, 1347, 1011 and 761 cm−1, which can be assigned to ν39 pyrrole ring stretching, ν30 ring C–H/N–H bending, ν15 benzene ring symmetric breath, and ν7 aromatic ring breath modes.
FIG. 6.
Comparison between experimental (red) and calculated (blue) spontaneous resonance Raman spectra of (a) 1:1 tyrosine/tryptophan mixture and (b) WY dipeptide excited at 225 nm (44444 cm−1). Experimental data taken from Ref.[31]. Contributions from solvent modes are shaded in the experimental spectra. The calculated spectra of 1:1 mixture is obtained by summing the spectra of tyrosine (green dashed) and tryptophan (magenta dashed). The shaded peaks at 932 cm−1 come from internal standard.
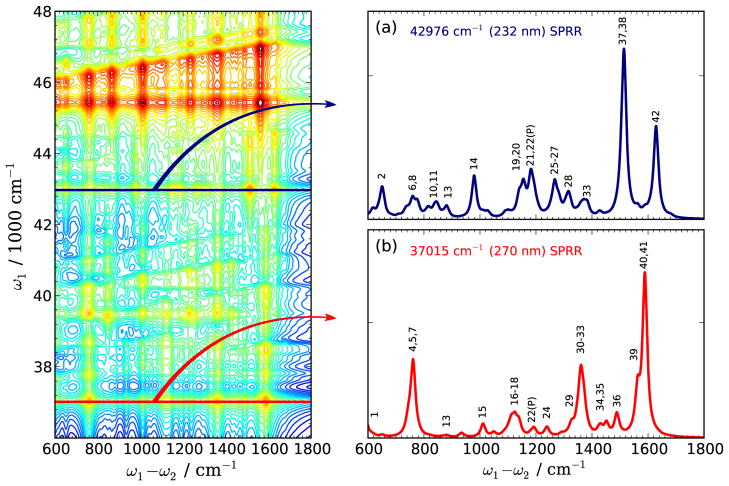
Two dimensional plots of spontaneous Raman spectra (2DSPR) with respect to the excitation frequency (ω1) and the Raman shift (ω1 − ω2) are shown in the left panel of Fig. 7. for excitation energies between 36000 and 48000 cm−1. All 2D spectra in this article are displayed using the inverse hyperbolic sine function, which better reveals both weak and strong features,
FIG. 7.
(Left) Two dimensional Spontaneous Raman (2DSPR) spectra of WY dipeptide with excitation energy scanned from 36000 to 48000 cm−1. (a) and (b) horizontal slices excited at ω1=232 and ω1=270 nm, respectively. Vibrational mode assignment as listed in Table II. A nonlinear scale function Eq. 13 is used for better visibility.
| (13) |
The normalization coefficient C is chosen to make S̄ close to 1. Two horizontal slices are shown in Fig. 7(a) and (b). The vertical lines are Raman excitation profiles. The peaks along the tilted directions [dashed lines in Fig. 8(c) and (d)] in the 2DSPR correspond to the Raman signals enhanced by 0–1 vibronic excitations for each active mode.
FIG. 8.
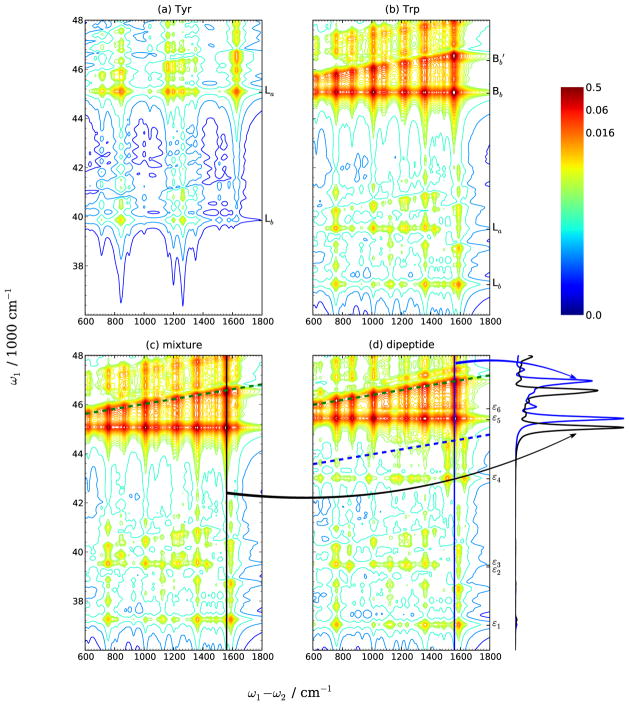
2DSPR spectra of (a) tyrosine, (b) tryptophan, (c) 1:1 mixture and (d) WY dipeptide. The spectra of mixture are obtained by summing the contributions from tyrosine and tryptophan. Vertical slices of the mixture and dipeptide spectra show a shift between Raman profile peaks of (c, black) and (d, blue). Dashed lines denote the tilted directions. A nonlinear scale function [Eq. 13] is used for better visibility.
Panels (a) and (b) display two horizontal slices of the 2DSPR spectra of trans-WY dipeptide corresponding to the 232 nm (ε4:Tyr-La) and 270 nm (ε1:Trp-Lb) resonances. The NTO plots of the dipole allowed electronic transitions of the WY dipeptide [Fig. S3 (Supporting Information)] show that all the excitations are localized either on the Trp or the Tyr aromatic group, hence the active vibrational modes enhanced by a resonant excitation should also be localized. This can be verified by examining the enhanced vibrational modes in a specific excitation. In Fig. 7(a) and (b), we assigned all the pronounced vibrational modes enhanced by the Tyr-La and Trp-Bb transitions, respectively. The assigned modes are listed in Table II. Only ν13, ν21, and ν22 are enhanced by both transitions, reecting their delocalized peptide bond nature. All other Raman signals are induced by vibrational modes localized on either the Tyr or the Trp aromatic group. The main features of tyrosine SPRR are the peaks at 1629 and 1510 cm−1, which were assigned as the Y20a, Y19a and Y18a phenol ring stretching modes.31,32 The 780 and 850 cm−1 phenol ring breathing modes are not intense enough to characterize tyrosine residues. The tryptophan SPRR show peaks at 1590, 1360, 1125 and 760 cm−1, which can be assigned as the W8b, W14, benzene ring H–C–C–H in-plane bending and aromatic ring breath modes, respectively.31,32 These resonance Raman signals are strong and do have high selectivity upon excitations, thus can be used to characterize tyrosine and tryptophan residues.
Fig. 8 compares the 2DSPR spectra of tyrosine, tryptophan, 1:1 W/Y mixture and WY dipeptide. The spectra of tyrosine are much simpler than tryptophan and WY: there are only two electronic transitions in the range below 48000 cm−1, and the gap between these two excitations is 5200 cm−1, which is much larger than any vibrational frequency. Thus there is no overlap between peaks in the tilted direction from a lower excitation and horizontal peaks from a higher one. As the result of the smaller transition dipoles (Table I), the Raman signals of tyrosine [Fig. 8(a)] are much weaker than those of tryptophan and WY dipeptide. The Lb and La transitions of tyrosine are close to the La and Bb transition of tryptophan, and the SPRR of tyrosine excited with these wavelengths is overwhelmed by the contribution from tryptophan, results in the fact that the spontaneous spectra of tryptophan [Fig. 8(b)] and 1:1 mixture [Fig. 8(c)] have similar patterns.
Despite the small differences between the spectra of the W/Y mixture and WY dipeptide at 225 nm (Fig. 6), it is possible to distinguish the two systems by the 2DSPR spectra. Below 41500 cm−1, the spectra of the two systems are similar except for a slight shift. However, a series of horizontal peaks appear at 42976 cm−1 in the dipeptide spectra [Fig. 8(d)], and its concomitant tilted peaks (blue dashed line) extend from 43600 to 44600 cm−1, overlapping with the lower tail of the 45390 cm−1 Trp-Bb horizontal peaks. This is a consequence of the red-shifted Tyr-La transition from 222 nm (45023 cm−1) in the tyrosine monomer to 232 nm (42976 cm−1) in the dipeptide. In addition, as the result of the shift of Trp-Bb and transitions upon binding with tyrosine, the Raman profiles have a obvious shift as shown in the horizontal slices in Fig. 8.
VI. ONE-DIMENSIONAL STIMULATED RESONANCE RAMAN SPECTRA
The modulus of the transition polarizability matrices (Eq. 7) for different pulse frequencies are shown in Fig. 9. We used Gaussian UV pulses, with FWHM 1768 cm−1 (8.33 fs), and with center frequencies at 35500, 37015, and 42976 cm−1. The first pulse is chosen to be preresonant to Trp-Lb (ε1) and the latter two frequencies are resonant with the Trp-Lb and Tyr-La (ε4) transitions in WY dipeptide, respectively. The axes are labeled by the active vibrational modes listed in Table II. The matrix elements of the polarizability due to the n-th pulse can be written as
FIG. 9.
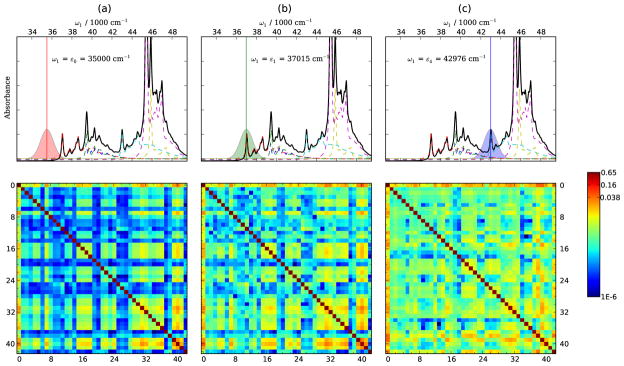
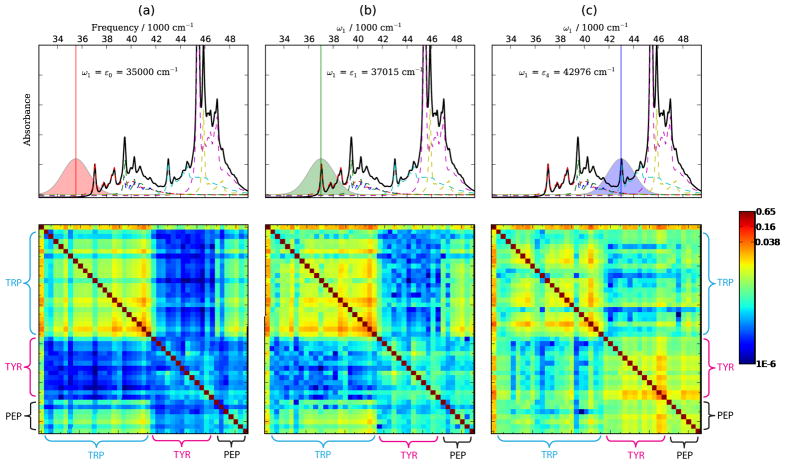
Modulus of transition polarizability matrices (Eq. 14) for (a) ε0 35500 cm−1, (b) ε1:Trp-Lb 37015 cm−1, and (c) ε4:Tyr-La 42976 cm−1. Pulses and the absorption spectra are shown on top. Axes of the matrices are labeled by the vibrational modes as listed in Table II, ν0 is the ground vibrational state. Log scale function ᾱ = log(α) is used for better visibility.
| (14) |
which can be viewed as the transition amplitude between two vibrational modes, hence the α matrix is symmetric.
The top row of the α matrix is the only contribution to the spontaneous and 1DSRR signals, as each transition must between the ground state and a vibrationally excited state. The largest values of α are found along the diagonal, where the initial and final states are the same (elastic scattering). For 1DSRR, the diagonal element α00 contributes to the elastic scattering background term that we do not include in our simulations. The α(0) and α(1) matrices in Fig. 9(a) and (b) exhibit block-wise behaviors, where the elements between tryptophan modes, such as ν7, ν16–18, ν29–36, and ν39–41 (see Table. II ) have larger values than the others, as a consequence of the excitation beam is near-resonance or on-resonance with the Trp-Lb transition. The transition polarizability matrices can be better visualized by regrouping the vibrational modes into tryptophan, tyrosine and peptide modes, as shown Fig. 10. In panels (a) and (b), it is obvious that off-diagonal terms correspond to vibrational modes from tryptophan [Trp-Trp, upper left bright block] have larger values than those involve modes from both tryptophan and tyrosine [Trp-Tyr and Tyr-Trp dark blocks]. The bright rectangular Pep-Trp (lower left) and Trp-Pep (upper right) blocks in panels (a) and (b) show the transition polarizabilities between peptide and tryptophan modes. Since the peptide bond modes are delocalized, these off-diagonal terms have larger values that indicate strong correlation. The correlation between tyrosine modes with others are weak due to no tyrosine electronic transitions can be excited by using pulses centered at ω1 = ε0 = 35500 cm−1 (panel a, preresonant) or ω1 = ε1 = 37015 cm−1 (panel b, resonant with Trp-Lb). On the other hand, in Fig. 10(c), as shown in the top panel, although the excitation beam is resonant with the Tyr-La transition, there is considerable overlaps between the excitation pulse with the upper tail of the Trp-La and the lower tail of the Trp-Bb transitions, thus both tyrosine and tryptophan modes can be enhanced by the broadband pulse centered at ε4 [see Fig. 9(c)]. The simultaneous excitation of tryptophan and tyrosine transitions results in strong correlations between tyrosine modes with the others, which can be visualized by the off-diagonal Trp-Tyr and Tyr-Trp blocks in panel (c).
FIG. 10.
Same as Fig. 9 except vibrational modes are regrouped: Mode 0 denotes ground state, the first 22, the 23th to 35th, and the 36th to 42nd modes are Trp (tryptophan), Tyr (tyrosine) and Pep (peptide) modes, respectively.
The SPRR and time-domain 1DSRR spectra are compared in Fig. 11. In the 1DSRR experiment, the system is first pumped with a pre-resonant pulse centered at ε0:35500 cm−1, and then detected by a probe pulse with center frequency resonant with the ε1:Trp-Lb [Fig. 11(c)] or the ε4:Tyr-La [Fig. 11(d)] transition. The absorption spectra and pulse spectral density are given in the insets in Fig. 11(c) and (d). The 1DSRR spectrum with ω1 = ε0, , ω2 = ε1 reproduces all the characteristic features of the tryptophan aromatic modes at 1590, 1360, 1125 and 760 cm−1. However, in the case of ω1 = ε0, ω2 = ε4, in addition to the characteristic features of the tyrosine aromatic modes at 1629 and 1510 cm−1, tryptophan modes at 1590, 1360 and 760 cm−1 are also enhanced. The contribution from tryptophan is a result of the excitation of Trp-Lb by ε0 and Trp-La/Trp-Bb by ε4, as shown in the insert of Fig. 11(d).
VII. TWO-DIMENSIONAL STIMULATED RESONANCE RAMAN SPECTRA
By taking two dimensional Fourier transform respect to the two time delays, the 2DSRR signal is given by,
| (15) |
where
| (16a) |
| (16b) |
Eqs. (16a) and (16b) correspond to the Ω1 > 0 and Ω1 < 0 signals, respectively. The 2DSRR signals are written as the product of of two top row elements αac′ and αca with an intermediate term αc′c. Peaks along Ω1 occur at the same frequencies as in the spontaneous and 1DSRR signals, while Ω2 peaks can eigher occur at these frequencies (Sii and Siv) or at the difference between vibrational frequencies (Si and Siii). The intermediate term αcc′ probes the polarizability matrix matrix element between different vibrational modes, it thus carries additional information about the intermediate Raman process between these modes, which is not available in the 1D signals.
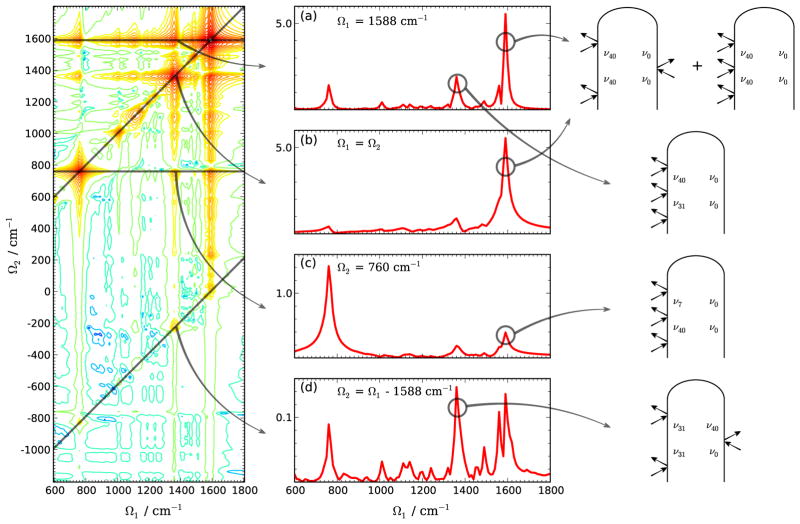
The 2DSRR spectra reveal the correlation between different vibrational modes. In Fig. 12 we show the 2D spectrum for ω1 = ω2 = ε0, ω3 = ε1. Since the 2D signals have inversion symmetry,52 only the Ω1 > 0 region is displayed. The time-independent contribution that all three Raman processes are 0–0 elastic scattering is filtered out. Various slices along the diagonal and horizontal directions are shown in the middle column. The diagonal trace is similar to the 1DSRR spectrum [see Fig. 11(c)] with narrower lineshapes. A horizontal trace, with a constant Ω2 = 1588 cm−1 corresponding to the ν40 W8b mode listed in Table II is also shown in Fig. 12(a). The same diagonal peak with coordinate (Ω1, Ω2) = (1588, 1588) cm−1 appears in both Fig. 12(a) and (b). It consists of contributions from pathways Si and Siv, as shown in the right column, with values proportional to and , respectively. Diagonal peaks are the strongest features in the 2D spectra due to it contains a diagonal element of α. For pathways Si and Siii, a diagonal peak arises from a = c′ or a = c. Likewise in Sii and Siv, diagonal peaks are the results of elastic process with c = c′.
FIG. 12.
(a) Simulated 2DSRR spectra of the WY dipeptide with ω1=ω2=ε0, ω3=ε1. [(a) and (d)] Diagonal and [(b) and (c)] horizontal slices of the 2D spectrum on the left. (Right) Loop diagrams corresponding to selected peaks.
When two different vibrational modes are involved, off-diagonal peaks of two different diversities appear. Sii and Siv contain peaks at (Ω1, Ω2) = (±ωca, ±ωc′a), i.e. both Ω1 and Ω2 correspond to a |(1)g〉0 ← |(0)g〉0 transition with different modes. In the other pathways, Ω2 = ±ωcc′ is the difference between two vibrational excitations. For instance, the 1360 cm−1 peak in Fig. 12(a) has intensity proportional to , different from the diagonal peaks, where one top row, one diagonal and the 0–0 transition polarizability matrix elements accounts. For the off diagonal peaks, two different top-row and one off-diagonal elements affects the intensity. The fact that the off-diagonal peak intensities are one order of magnitude weaker than elastic scattering 1–1 transition [Fig. 12(b) and (c)]. The 1360 cm−1 peak in Fig. 12(d) has a coordinate (ν31,ν31-ν40) in the 2DSRR spectrum, is proportional to the amplitude . It also reects the inter-mode correlation. The inter-mode correlation arises from the process that one vibrational quanta transfers from one modes to another via an electronic excitation. A strong correlation implies the electronic transition is strongly coupled to the two different modes. In the current study, since all the electronic transitions are localized on aromatic groups, only vibrational modes from the same group are strongly correlated.
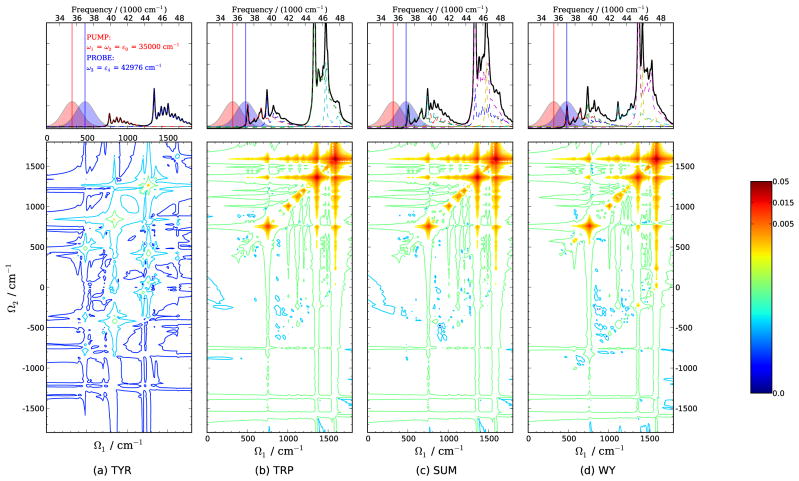
The modulus of 2DSRR signals of tyrosine, tryptophan, 1:1 W/Y mixture and WY dipeptide are shown in Figs. 13 for ω1 = ω2 = ε0, ω3 = ε1. When the probe pulse is resonant with ε1:Trp-Lb, there is little differences between the 2DSRR spectra of the W/Y mixture and WY dipeptide, and the contribution from the tyrosine to the mixture spectra is negligible. This can be attributed to the fact that there is no electronic excitation in those of the diagonal ones, indicates that the inter-mode correlation between different vibrational modes is one order of magnitude weaker than the the tyrosine monomer resonant with any incident pulses, thus no Raman process would be enhanced during the measurement. The situation is almost the same for the tyrosine residue in WY dipeptide, the tyrosine related excitations lie far away from the pulse frequencies, and only tryptophan modes can be signiffcantly enhanced.
FIG. 13.
2DSRR spectra of (a) tyrosine, (b) tryptophan, (c) 1:1 mixture [sum of (a) and (b)] and (d) WY dipeptide for ω1=ω2=ε0, ω3=ε1. Pulse envelopes and the absorption spectra are shown on top.
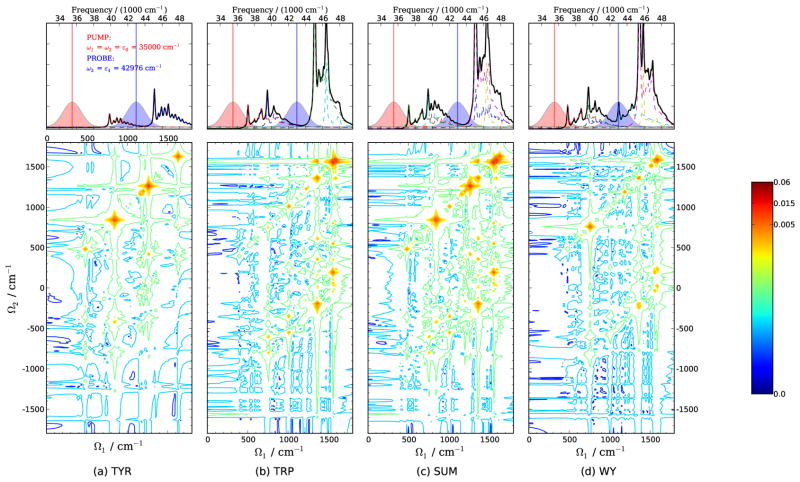
The situation is different when the probe is resonant with ε4:Tyr-La as shown in Fig. 14 for ω1 = ω2 = ε0, ω3 = ε4. Both tyrosine and tryptophan monomers have strong Raman signals and exhibit their characteristic vibrational modes on the diagonal lines. This is the result of the fact that ε4 lies near the La transition in tyrosine and the Bb transition in tryptophan, respectively. We can also see the stronger inter-mode correlation of tryptophan indicated by the cross peaks in Fig. 14(b) compared with those in Fig. 14(a). For the WY spectrum shown in Fig. 14(d), only the tyrosine mode ν6 and tryptophan mode ν40, which are the strongest features in the monomer spectra, are prominent in the dipeptide spectra. All other features in the range 1100~1400 cm−1 have much weaker intensities than ν6 and ν40. The weaker signals in the WY spectrum is a consequence of the relatively delocalization of electrons in the dimer compared with in the monomers. The delocalized electronic states results in smaller dimensionless displacements between the excited and ground state minimums. The values of the dimensionless displacements of the monomers and dimer can be found in Tables. S1, S2, and S3 [Supporting Information]. For instance, the displacements for the tryptophan W14 mode (ν31) corresponding the Trp-Lb transition are 0.713 and 0.576 in tryptophan monomer and dimer, respectively. The evident differences between the 2D spectra of monomer mixture and dimer indicates that by choosing appropriate pulse configurations, 2DSRR technique can facilitate the distinction of systems with similar chemical compositions but with different bonding interactions.
FIG. 14.
Same as Fig. 13, except ω1=ω2=ε0, ω3=ε4
VIII. CONCLUSIONS
We have simulated the 1D and 2D broadband stimulated UV resonance Raman spectra. The correlations between vibrational modes enhanced by UV pulses are illustrated for L-tyrosine, L-tryptophan, 1:1 W/Y mixture and trans-WY dipeptide. The relative intensity of inter-mode correlation can be directly viewed by cross peaks in the 2DSRR spectra. Correlations between specific vibrational modes can be examined by proper pulse-configurations. The W/Y mixture and WY dipeptide can be better distinguished by time-domain multidimensional Raman spectroscopy than in spontaneous Raman techniques. Multidimensional UVSRR technique could be a useful tool for protein secondary structure determination.
Supplementary Material
Acknowledgments
We gratefully acknowledge the support of the National Institutes of Health (grant GM059230), the National Science Foundation (grant CHE-1058791), and the Department of Energy (grants DE-FG02-04ER15571). We acknowledge the computational resource support from the GreenPlanet cluster at UCI (NSF Grant CHE-0840513).
Appendix A: The cumulant expansion for transition polarizabilities
The matrix element for the effective polarizability defined in Eq. 10, is the transition amplitude to go from state |a〉 to state |c〉, obtained by summing over all intermediate vibronic states |b〉 lying within the bandwidth of the m-th pulse. The number of excited states |b〉 scales exponentially with the number of vibrational modes, and a full summation becomes impractical. By treating the Raman inactive modes via the cumulant expansion,2 we greatly reduce computational cost.
We define the ground state
| (A1) |
i.e. is a single-mode wave function with n quanta of vibrational excitation, in the ground electronic state. The state with a single quantum of excitation in the j-th mode
| (A2) |
where the 0 subscript is used to distinguish the many-body wavefunction from the single-mode wavefunction and is the creation operator corresponds to the single quantum vibrational excitation in the j-th mode. Similarly we define overtones (doubly excited state)
| (A3) |
and the combination states
| (A4) |
In the calculations presented here, the contributions of overtone and combination bands are weak and were neglected, however we provide the formulas here for the sake of completeness.
The Raman process involves up and down transitions induced by fields Ej and . The transition polarizability amplitude is given by
| (A5) |
Here V (t) is the dipole operator in the interaction picture
| (A6) |
The dipole correlation function may be expanded as,
| (A7) |
where the prime in the subscript j′ denotes that the contribution of jth mode is excluded in that correlation function. The single mode correlation function can be handled by inserting resolution of the identity
| (A8) |
The Franck-Condon factors were calculated in the standard way.53
The second correlation function represents the spectator Raman inactive vibrational modes, and is evaluated by the cumulant expansion2,
| (A9) |
where the electronic excitation frequency and line shape function are defined as
| (A10) |
and
| (A11) |
Here β = (kT)−1 is the inverse temperature. The effective transition polarizability now reads
| (A12) |
We take E(t) to be Gaussian,
| (A13) |
Substituting Eq. A13 into Eq. A12 gives,
| (A14) |
Eq. A14 was evaluated by a fast Fourier transform. Matrix elements such as may be obtained in the same manner, and are provided here for completeness:
| (A15) |
| (A16) |
A 2D stimulated Raman signal requires matrix elements between vibrationally excited states, these are given below,
| (A17) |
| (A18) |
| (A19) |
| (A20) |
| (A21) |
| (A22) |
We set Em(t) = exp(−iω1t) and in Eq. A12. Performing one integration gives δ(ω1 − ω2 − ωj), and adding a phenomenological electronic lifetime we arrive at
| (A23) |
Eq. A23 can be calculated by a fast Fourier transform. Other matrix elements of α can be readily obtained.
Appendix B: Relative strength of ground-state and excited-state contributions as a function of detuning
It can easily be shown that the excited state contribution to a pump-probe signal decays much more quickly with pulse detuning than the ground state contribution using a simple three-state model. This model includes the ground state, |a〉, an electronically excited state, |b〉, and a vibrationally excited state, |c〉, with energies such that ωba ≫ ωca > 0. Interaction with the pump pulse will place amplitude in the electronically and vibrationally excited states, |ψe〉 and |ψg〉, respectively. The excited state contribution to a pump-probe signal is proportional to the population in state |b〉 after interaction with the pump pulse (see Eq. A13), and is given by
| (B1) |
where d ≡ σ(Ω − ωba) is the effective detuning. The SRS contribution to the pump-probe signal is proportional to the amplitude in state |c〉 after interaction with the pump pulse, given by
| (B2) |
Here is Dawson’s integral,54 which has the following asymptotic series (truncated at some finite order, valid for large x)
| (B3) |
As the detuning becomes large, the Gaussian term inside the brackets of Eq. B2 becomes small and can be neglected. Keeping the leading term of Eq. B3, the |c〉 amplitude can be written in the limit of large detuning as
| (B4) |
The necessary resonance offset for the stimulated Raman signals calculated and presented in Secs. VI and VII was determined by finding that center frequency such that
| (B5) |
The numerator and denominator in Eq. B5 were both calculated using the displaced harmonic oscillator Hamiltonian and cumulant expansion method presented in Appendix A.
References
- 1.Ziegler LD, Champion PM. XXII International Conference on Raman Spectroscopy; AIP Conference Proceedings; Springer-Verlag GmbH; 2010. [Google Scholar]
- 2.Mukamel S. Principles of Nonlinear Optical Spectroscopy. 1. Oxford University Press; New York Oxford: 1995. [Google Scholar]
- 3.Huang C, Balakrishnan G, Spiro TG. J Raman Spectrosc. 2006;37:277. [Google Scholar]
- 4.Soldatova A, Ibrahim M, Olson J, Czernuszewicz R, Spiro T. J Am Chem Soc. 2010;132:4614. doi: 10.1021/ja906233m. [DOI] [PMC free article] [PubMed] [Google Scholar]
- 5.Ozdemir A, Lednev IK, Asher SA. Spectrochim Acta Part A. 2005;61:19. doi: 10.1016/j.saa.2004.03.006. [DOI] [PubMed] [Google Scholar]
- 6.Mikhonin A, Ahmed Z, Ianoul A, Asher S. J Phys Chem B. 2004;108:19020. [Google Scholar]
- 7.Popova LA, Kodali R, Wetzel R, Lednev IK. J Am Chem Soc. 2010;132:6324. doi: 10.1021/ja909074j. [DOI] [PubMed] [Google Scholar]
- 8.Mikhonin AV, Bykov SV, Myshakina NS, Asher SA. J Phys Chem B. 2006;110:1928. doi: 10.1021/jp054593h. [DOI] [PubMed] [Google Scholar]
- 9.Mikhonin AV, Asher SA. J Phys Chem B. 2005:3047. doi: 10.1021/jp0460442. [DOI] [PubMed] [Google Scholar]
- 10.Asher SA, Ianoul A, Mix G, Boyden MN, Karnoup A, Diem M, Schweitzer-Stenner R. J Am Chem Soc. 2001;123:11775. doi: 10.1021/ja0039738. [DOI] [PubMed] [Google Scholar]
- 11.Ren H, Jiang J, Mukamel S. J Phys Chem B. 2011;115:13955. doi: 10.1021/jp207849u. [DOI] [PMC free article] [PubMed] [Google Scholar]
- 12.Kurouski D, Lauro W, Lednev IK. Chem Commun. 2010;46:4205. doi: 10.1039/b926758a. [DOI] [PubMed] [Google Scholar]
- 13.Oladepo S, Xiong K, Hong Z, Asher S. J Phys Chem Lett. 2011;2:334. doi: 10.1021/jz101619f. [DOI] [PMC free article] [PubMed] [Google Scholar]
- 14.Sato A, Gao Y, Kitagawa T, Mizutani Y. Proc Natl Acad Sci USA. 2007;104:9627. doi: 10.1073/pnas.0611560104. [DOI] [PMC free article] [PubMed] [Google Scholar]
- 15.Quan B, Ianoul A. J Raman Spectrosc. 2009;40:260. [Google Scholar]
- 16.Shafaat H, Leigh B, Tauber M, Kim J. J Phys Chem B. 2008;113:382. doi: 10.1021/jp809329a. [DOI] [PubMed] [Google Scholar]
- 17.Kubo M, Gruia F, Benabbas A, Barabanschikov A, Montfort W, Maes E, Champion P. J Am Chem Soc. 2008;130:9800. doi: 10.1021/ja800916d. [DOI] [PMC free article] [PubMed] [Google Scholar]
- 18.Pohling C, Buckup T, Motzkus M. J Biomed Opt. 2011;16:021105. doi: 10.1117/1.3533309. [DOI] [PubMed] [Google Scholar]
- 19.Kukura P, McCamant DW, Mathies RA. Annu Rev Phys Chem. 2007;58:461. doi: 10.1146/annurev.physchem.58.032806.104456. [DOI] [PubMed] [Google Scholar]
- 20.Kuramochi H, Takeuchi S, Tahara T. J Phys Chem Lett. 2012;3:2025. doi: 10.1021/acs.jpclett.9b02283. [DOI] [PubMed] [Google Scholar]
- 21.Shim S, Dasgupta J, Mathies R. J Am Chem Soc. 2009;131:7592. doi: 10.1021/ja809137x. [DOI] [PubMed] [Google Scholar]
- 22.Mallick B, Lakhsmanna A, Umapathy S. J Raman Spectrosc. 2011;42:1883. [Google Scholar]
- 23.Ploetz E, Marx B, Gilch P. J Raman Spectrosc. 2010;41:609. [Google Scholar]
- 24.Tanimura Y, Mukamel S. J Chem Phys. 1993;99:9496. [Google Scholar]
- 25.Selig U, Schleussner CF, Foerster M, Langhojer F, Nuernberger P, Brixner T. Opt Lett. 2010;35:4178. doi: 10.1364/OL.35.004178. [DOI] [PubMed] [Google Scholar]
- 26.hung Tseng C, Matsika S, Weinacht TC. Opt Express. 2009;17:18788. doi: 10.1364/OE.17.018788. [DOI] [PubMed] [Google Scholar]
- 27.Ruetzel S, Kullmann M, Buback J, Nuernberger P, Brixner T. In: XVIIIth International Conference on Ultrafast Phenomena. Chergui M, editor. 2012. [Google Scholar]
- 28.Auboeck G, Consani C, van Mourik F, Chergui M. Opt Lett. 2012;37:2337. doi: 10.1364/OL.37.002337. [DOI] [PubMed] [Google Scholar]
- 29.West BA, Moran AM. J Phys Chem Lett. 2012;3:2575. doi: 10.1021/jz301048n. [DOI] [PubMed] [Google Scholar]
- 30.Homann C, Lang P, Riedle E. J Opt Soc Am B. 2012;29:2765. [Google Scholar]
- 31.Harmon P, Teraoka J, Asher S. J Am Chem Soc. 1990;112:8789. [Google Scholar]
- 32.Rava R, Spiro T. J Phys Chem. 1985;89:1856. [Google Scholar]
- 33.Jiang J, Mukamel S. Phys Chem Chem Phys. 2011;13:2394. doi: 10.1039/c0cp02047h. [DOI] [PMC free article] [PubMed] [Google Scholar]
- 34.Tsiper EV, Chernyak V, Tretiak S, Mukamel S. Chem Phys Lett. 1999;302:77. [Google Scholar]
- 35.Myers AB, Mathies RA, Tannor DJ, Heller EJ. J Chem Phys. 1982;77:3857. [Google Scholar]
- 36.Biggs JD, Voll JA, Mukamel S. Phil Trans R Soc. 2012;A370:3709. doi: 10.1098/rsta.2011.0219. [DOI] [PMC free article] [PubMed] [Google Scholar]
- 37.Biggs JD, Zhang Y, Healion D, Mukamel S. J Chem Phys. 2012;136:174117. doi: 10.1063/1.4706899. [DOI] [PMC free article] [PubMed] [Google Scholar]
- 38.Zschornack GH. Handbook of X-ray data. 1. Springer; 2007. [Google Scholar]
- 39.Pokalsky C, Wick P, Harms E, Lytle F, Etten RV. J Bio Chem. 1995;270:3809. doi: 10.1074/jbc.270.8.3809. [DOI] [PubMed] [Google Scholar]
- 40.Yan YJ, Mukamel S. J Chem Phys. 1991;94:997. [Google Scholar]
- 41.Frisch MJ, Trucks GW, Schlegel HB, Scuseria GE, Robb MA, Cheeseman JR, Scalmani G, Barone V, Mennucci B, Petersson GA, et al. Gaussian 09 Revision C.1. Gaussian Inc; Wallingford CT: 2009. [Google Scholar]
- 42.Perdew JP, Burke K, Ernzerhof M. Phys Rev Lett. 1996;77:3865. doi: 10.1103/PhysRevLett.77.3865. [DOI] [PubMed] [Google Scholar]
- 43.Amos RD. Chem Phys Lett. 1982;87:23. [Google Scholar]
- 44.Barone V, Cossi M. J Phys Chem A. 1998;102:1995. [Google Scholar]
- 45.Cossi M, Rega N, Scalmani G, Barone V. J Comput Chem. 2003;24:669. doi: 10.1002/jcc.10189. [DOI] [PubMed] [Google Scholar]
- 46.Scott AP, Radom L. J Phys Chem. 1996;100:16502. [Google Scholar]
- 47.Merrick JP, Moran D, Radom L. J Phys Chem A. 2007;111:11683. doi: 10.1021/jp073974n. [DOI] [PubMed] [Google Scholar]
- 48.Platt JR. J Chem Phys. 1949;17:484. [Google Scholar]
- 49.Martin R. J Chem Phys. 2003;118:4775. [Google Scholar]
- 50.Adamo C, Barone V. Chem Phys Lett. 1999;314:152. [Google Scholar]
- 51.Rava R, Spiro T. J Phys Chem. 1985;89:1856. [Google Scholar]
- 52.Mukamel S, Piryatinski A, Chernyak V. Acc Chem Res. 1999;32:145. [Google Scholar]
- 53.Manneback C. Physica. 1951;17:1001. [Google Scholar]
- 54.Abramowitz M, Stegun I. Handbook of Mathematical Functions. Dover Publications Inc; New York: 1972. [Google Scholar]
- 55.Wilson E. Phys Rev. 1934;45:706. [Google Scholar]
- 56.Rava RP, Spiro TG. J Am Chem Soc. 1984;106:4062. [Google Scholar]
Associated Data
This section collects any data citations, data availability statements, or supplementary materials included in this article.


