

Abstract
Various regulatory elements in messenger RNAs (mRNAs) carrying the secondary structure play important roles in a wide range of expression processes. Numerous recent works have focused on the discovery of these functional elements that contain the conserved mRNA structures. However, to date, regions with high structural stability have been largely overlooked. In this study, we defined high stability regions (HSRs) in the coding sequences (CDSs) in bacteria based on the normalized folding free energy. We found that CDSs had high number of HSRs, and these HSRs showed high structural context robustness compared with random sequences, indicating a direct selective constraint imposed on HSRs. A reduced ribosome speed was detected near the start position of HSR, implying a possibility that HSR acted as obstacle to drive translational pausing that coordinated protein synthesis. Interestingly, we found that genes with high HSR density were enriched in the processes of translation, protein folding, and cell division. In addition, essential genes exhibited higher HSR density than nonessential genes. Overall, our study presented the previously unappreciated correlation between the number variation of HSRs and cellular processes.
Keywords: mRNA stability, cellular processes, gene essentiality
Introduction
Messenger RNAs (mRNAs) with reverse complements have the potential to fold into local secondary structures that often act as regulatory elements in a series of cellular processes (Wan et al. 2011; Dethoff et al. 2012), including translation initiation (Kudla et al. 2009; Gu et al. 2010; Scharff et al. 2011; Keller et al. 2012) and localization of mRNA or protein (Power et al. 2004; Clarke and Clark 2010). The mRNA secondary structure participates in cellular processes in several ways. One possibility is that the secondary structure interacts with RNA-binding factors, with the structural specificity to regulate the downstream processes (Dethoff et al. 2012). In this scenario, the specific structure is assumed to be conserved during evolution because the sequences serving the same function are generally accepted to share the same structure. In accordance with this hypothesis, numerous studies have performed the methods combined with phylogenetic analyses to identify the functional elements that contain the conserved mRNA structures. For example, a conserved stem-loop structure within the 5′-untranslated region of RNase E mRNA has been reported to regulate the degradation of RNAase E gene transcript (Diwa et al. 2000). By targeting the transcript that contains this element, bacterial cells can maintain RNase E near its optimal concentration (Diwa et al. 2000). Other examples have also been found in the studies of long-range interactions (Li et al. 2010), internal entry site structures (Lukavsky 2009), and steroid receptor RNA activators (Novikova et al. 2012).
Another way of regulation involving the local structural stability of mRNA is elucidated in a few initial reports (Giedroc and Cornish 2009; Watts et al. 2009; Gu et al. 2010; Tuller et al. 2010; Yu et al. 2011; Tholstrup et al. 2012). mRNA regions with high structural stability provide barriers for ribosome movement, causing ribosome pausing (Wen et al. 2008), which affects a large number of cotranslational processes (Thanaraj and Argos 1996; Cabrita et al. 2010; Siller et al. 2010). A stable structure downstream a slippery sequence, for instance, stimulates ribosomal frameshift (Giedroc and Cornish 2009). A recent study has shown that both RNA pseudoknot and stem-loop structure lead to the frameshift effectively (Yu et al. 2011), indicating that high structural stability instead of the specific structure is required for the frameshift. Recently, Watts et al. (2009) have found that mRNA regions encoding interdomain loops of HIV proteins exhibit higher structural stability than other regions. Moreover, correlation between mRNA structural stability and protein secondary structure has been noted (Jia et al. 2004; Luo et al. 2004). These results suggest that the variation in structural stability is connected with protein folding. With this background, we inferred that there are some functional elements on mRNAs, which maintain high structural stability regardless of the structural specificity. Unfortunately, most initial reports have focused on functional regions containing conserved secondary structures (Fogel et al. 2002; Pedersen et al. 2004; Washietl and Hofacker 2004; Meyer and Miklós 2005; Pedersen et al. 2006; Petrillo et al. 2006; Moss et al. 2011; Goodarzi et al. 2012); high stability regions (HSRs) and their functions have been studied only in a few processes (e.g., protein folding). Therefore, in this study, we examined the HSRs of mRNA from the genome-wide perspective and investigated the correlation between the number of HSRs (HSR density) and biological processes.
Materials and Methods
Data Collection
Coding Sequences and Orthologs
Four enterobacteria (Escherichia coli K12 MG1655, Salmonella enterica subsp. enterica serovar Typhi CT18, Shigella flexneri 301, and Yersinia pestis CO92) and two nonenteric Gammaproteobacteria (Vibrio cholerae O1 biovar El Tor N16961 and Aeromonas hydrophila ATCC 7966) were used in this study. Protein-coding sequences (CDS) were downloaded from the National Center for Biotechnology Information FTP server (ftp://ftp.ncbi.nih.gov/genomes/). Sequences with length <200 nucleotides (nt) were excluded. The orthologous relationships were obtained from the KEGG database (Kanehisa et al. 2008). Only one-to-one orthologs were used. The numbers of CDSs and orthologs are summarized in supplementary table S1, Supplementary Material online.
Ribosome Density
Ribosome occupancy data sets in E. coli were obtained from the work of Li et al. (2012). We averaged the normalized ribosome occupancy (normalized by the mean occupancy of the corresponding transcript) at the same site of all available transcripts to obtain the mean ribosome density.
Protein Abundance and mRNA Half-life
Three data sets of protein abundance of E. coli were obtained from Lu et al. (2006), Lewis et al. (2010), and Taniguchi et al. (2010). For each data set, the values of protein abundance were normalized by the mean of data set. We averaged the three normalized data sets to obtain an integrated data set. mRNA half-life data were derived from the work of Selinger et al. (2003).
Gene Essentiality and Protein–Protein Interaction
Essential and nonessential genes of E. coli were defined as described in Kato and Hashimoto (2007) (302 essential genes and 4,139 nonessential genes). The protein–protein interaction (PPI) data of E. coli were taken from Arifuzzaman et al. (2006) (2,667 proteins and 16,050 interacting patterns).
Local Structure Prediction and Structural Stability Calculation
We used RNAfold in the Vienna RNA Secondary Structure Package (Gruber et al. 2008) to predict the local structure and calculate the minimum folding free energy (MFE) along the CDS using a sliding window with 50 nt in length and a step of 10 nt. A small window size (50 nt) was used because it approximated the length of regions (40 nt) covered by ribosome during elongation. To rule out the effect of base composition, which strongly affects MFE (Dawson and Yamaoto 1999; Mathews et al. 1999), MFE was normalized by the base composition of the corresponding sequence. For each sequence, we shuffled all nucleotides, while controlling for base composition. We repeated this process 100 times to obtain 100 random sequences. The MFE of random sequences was calculated using RNAfold. The normalized MFE, z-score, was calculated by equation (1).
| (1) |
where mfenative is the free energy of native sequence, and mferandom and σ are the mean and standard deviation of the MFE of 100 random sequences, respectively.
Structure Density
We used a threshold of −0.65 to define the HSR. A z-score of −0.65 means that approximately 60% nucleotides in a window are base paired, which was approximately equal to the mean percentage of paired sites (62.26%; supplementary fig. S1, Supplementary Material online) in E. coli tRNA. To reduce false positives, we only considered regions with more than two continuous sliding windows in which the z-scores were all below the threshold. If the percentage of overlapping sites of two adjacent HSRs was higher than 50%, the two HSRs were combined. To exclude the effect of sequence length on the number of HSRs, we defined the HSR density of transcript as the number of HSRs per kilobases (kb).
Conserved HSRs
We defined conserved HSRs between E. coli and S. enterica. Considering that insertions and deletions in sequences strongly affect the position of HSR, we first aligned the orthologs using MUSCLE (Edgar 2004), and then excluded the alignments with insertions and deletions >10 nt. For each HSR in E. coli (HSR-eco), we searched for the homologous HSR in the orthologous region in S. enterica (HSR-sty). If HSR-sty was found and the percentage of overlapping positions between HSR-eco and HSR-sty was higher than 50%, the two HSRs were defined as conserved HSRs.
Random Sequence and Control
Mononucleotide shuffling cannot preserve codon usage and amino acid sequence of native sequence. Thus, the HSRs we defined might result from codon usage or amino acid bias. To resolve this issue, we generated 20 random sequences for each CDS by shuffling synonymous codons among sites with identical amino acids, while maintaining the codon usage, amino acid sequence, and GC content. The HSR density in the random sequence (rHSR density) was defined as described earlier. In such permutation, the signals of codon usage and amino acid sequence were preserved. Consequently, the HSRs caused by these signals were preserved, whereas the other HSRs were perturbed. We compared rHSR densities among different gene categories to test whether our results were affected by codon usage or amino acid bias. Additionally, 20 nonfunctional sequences were generated for each CDS by shuffling mononucleotides, which were used as control.
Structural Context Robustness of HSR
The structural context robustness (SCR) indicates an intrinsic tendency of subsequence to be structurally indifferent to its surrounding sequences and to be resistant to the interruptions of context (Lee and Kim 2008). For most structural elements, the structural specificity or structural stability directly affects their functions. Thus, such elements might have high SCR, as described by Lee and Kim (2008) and Sewer et al. (2005).
To determine whether natural selection operates on HSRs directly, we estimated the SCR of HSR based on the method proposed by Lee and Kim (2008). We defined the SCR of HSR as the relative change in MFE when HSR was embedded in random surrounding sequences. For each HSR, we extracted the forward and backward adjacent regions (FAR and BAR, whose lengths are equal to the corresponding HSR). The random adjacent regions, rFAR and rBAR, were then generated by shuffling synonymous codons among sites with identical amino acids, while maintaining genomic frequency of codons and amino acid sequence. A concatenated sequence, rFAR–HSR–rBAR, was created and whose secondary structure was predicted by RNAfold. The portion of such structure corresponding to the HSR index was extracted and modified to create a legal structure, struc(HSR′). The relative change of MFE was calculated by equation (2).
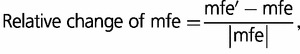 |
(2) |
where mfe′ is the MFE of struc(HSR′) and mfe is the MFE of HSR. For each HSR, we generated 50 sets of rFAR–HSR–rBAR, and then averaged 50 relative changes of MFE to obtain the SCR of HSR.
Gene Classification
The classifications of gene products in E. coli were downloaded from the GenProtEC database (Serres et al. 2004). We compared HSR densities among the first five classifications: metabolism, information transfer, regulation and transport, and cell processes. For details, we used Gene Ontology (GO) (Ashburner et al. 2000) to show the correlation between biological process and HSR density. GO enrichment analysis was performed using DAVID Bioinformatics Resources (Da Wei Huang and Lempicki 2008).
Results
Nonconserved Local Structure with High Stability
Recently, a stable structure located in the approximately 30–80 nt interval downstream of the start codon (supplementary fig. S2, Supplementary Material online) has been reported and assumed to be correlated with translational control (Tuller et al. 2011). Here, we analyzed the conservation of this functional structure between E. coli and S. enterica. We found that very similar sequences showed vastly different local structures in the 30–80 nt interval (fig. 1A), suggesting that local structure in this region was nonconserved. To verify this finding, we calculated the correlation between structure distance (calculated by RNAdistance; Gruber et al. 2008) and sequence identity. As shown in figure 1B, a negative correlation was found (R = −0.429, P < 2.2 × 10⁻¹⁶, fig. 1B). The structure distance linearly decreased as sequence identity increased from 80% to 100%. Additionally, we checked this relationship using random sequences generated by shuffling synonymous codons, while maintaining codon usage, amino acid sequence, and sequence distance of orthologs. A similar pattern was found (supplementary fig. S3, Supplementary Material online). The slope in the random sequence was similar to that in the native sequence (−3.49 for random sequence and −3.56 for native sequence). Overall, these results indicated that no appreciable evolutionary constraints existed for maintaining the conservation of the local structure in the 30–80 nt interval. The results supported the claim that structural stability (measured by MFE) in this region is under selection and correlated with the speed of translation elongation (Tuller et al. 2011). These findings also led us to survey other potential functional elements with high structural stability on mRNAs.
Fig. 1.—

Conservation analysis of a representative local structure. (A) z-scores along two very similar sequences are shown. z-scores near the 30–100 nt interval are significantly lower than 0, suggesting an evolutionary pressure to maintain the high structural stability. However, the structures of two sequences in this region vary vastly. (B) Correlation between structure distance and sequence identity. A significant linear correlation is shown when sequence identity >0.85.
HSRs Are Common in CDSs
We surveyed HSRs in six bacteria (Materials and Methods). Figures 2 and 3 showed the representative patterns inferred from E. coli. Similar patterns in other species were shown in supplementary figures S4 and S5, Supplementary Material online. As seen in figure 2, 92.8% sequences contained at least one HSR and 78.3% sequences contained three or more HSRs, whereas the corresponding percentages in the control were 55.4% and 9.7%, respectively (fig. 2). The significantly higher HSR density in the native sequence than that in the control (Wilcoxon test, all P values in six species were <2.2 × 10⁻¹⁵) suggested a selective constraint on CDSs to maintain the high number of HSRs. Additionally, we predicted the conserved secondary structures using RNAz (Gruber et al. 2007) with the same widow size and step used for HSR prediction. The result showed that the percentage of HSRs containing the conserved structures was low (12.9% and 31.7% on average, when the fractions of overlapping sites were 1.0 and 0.5, respectively, fig. 4), suggesting that a considerable fraction of functional elements would be ignored when we only considered ones with conserved secondary structure.
Fig. 2.—

The distribution of HSR density in Escherichia coli. Native: HSR densities in native sequences. Control: HSR densities in nonfunctional sequences, which were generated by shuffling mononucleotides of corresponding native sequence. rHSR: HSR densities in random sequences, generated by shuffling synonymous codons among sites with identical amino acids, while maintaining codon usage, GC content, and amino acid sequence.
Fig. 3.—

The locations of HSRs along transcripts in Escherichia coli. (A, B) Along the CDSs, the values of every five sliding windows were combined. For example, 6.4% at position 90 indicates that there are 6.4% sliding windows containing HSRs in the region from the start codon to the downstream 90 nt. (C, D) The relative frequencies of HSRs in the first five windows are shown.
Fig. 4.—

The relationship between HSRs and conserved secondary structures. For each HSR, the overlapping sites refer to the sites that are covered by both HSR and region with conserved secondary structure. Fraction of overlapping sites is the number of overlapping sites divided by the length of corresponding HSR. We used a series of thresholds to calculate such fraction to determine whether HSR contains a conserved secondary structure.
The locations of HSRs along CDSs were investigated as well. The result showed that a higher number of HSRs were located in the 5′ or 3′ coding region compared with other regions (fig. 3). More than 12% sequences exhibited HSRs in the first or last 90 nt, whereas the mean frequency decreased to approximately 3.7% in other regions. 5′-HSRs might exert an effect on translation initiation and early stage of translation elongation, and 3′-HSRs might be associated with translation termination or RNA decay.
To ascertain the robustness of our results, we first investigate the effect of codon usage and amino acid bias using random sequences (Materials and Methods). Because of the extensive amount of computations needed for predicting so many secondary structures, we only calculated the rHSR density in E. coli. As expected, we found that HSR density was significantly higher than rHSR density (Wilcoxon test, P < 2.2 × 10⁻¹⁵, fig. 2), suggesting a selection for HSR density even when controlling for codon usage and amino acid bias. We then tested the effects of thresholds. Other thresholds (e.g., −0.45, which was the lowest mean value of the z-score of transcripts) were applied to define the HSRs. Unsurprisingly, HSR density was strongly dependent on the threshold. However, similar results were obtained when examining different thresholds (supplementary figs. S4 and S5, Supplementary Material online).
Structural Robustness of HSR
In previous section, we defined HSRs using a low z-score value, which, however, did not guarantee that there is a direct selective constraint imposed on HSR to maintain high structural stability. To resolve this issue, we compared the SCR of native HSR with that of rHSR that had the same codon usage, amino acid sequence, and similar MFE to HSR (located in the range MFEHSR ± 10% MFEHSR). We proposed the null hypothesis: if the SCR of HSRs is equal to that of rHSR, HSRs are a by-product of selection for other factors that affect structural stability. We found that the SCR values of HSRs approximated a normal distribution with a mean of 0.34 (fig. 5 and supplementary fig. S6, Supplementary Material online). By contrast, the mean SCR value of rHSR was approximately 0.42. The result that HSRs exhibited a significantly higher degree of SCR than the random (paired t-test, P < 2.2 × 10⁻¹⁶) rejected the null hypothesis and suggested a direct selective constraint on HSRs for high structural stability.
Fig. 5.—
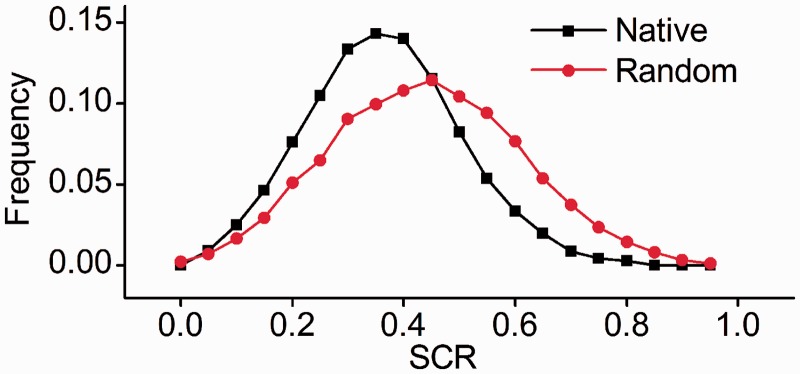
The distribution of SCR values of HSRs in Escherichia coli. Native: native HSRs; Random: random HSRs (rHSRs) generated by shuffling native HSRs, while maintaining codon usage and amino acid sequence. In addition, the MFE of rHSR is similar to that of native HSR.
Functions of HSRs
HSRs Block Translation
Variation in the local translation rate partly regulated by the mRNA secondary structure affects the protein folding (Komar 2009; Zhang et al. 2009) and the localization of protein (Mariappan et al. 2010) or mRNA (Yanagitani et al. 2011). It is of interest to study the correlation between the local translation rate and mRNA structure. The recent findings of Li et al. (2012) reporting genome-wide measurements of ribosome occupancy at a resolution of single nucleotides for E. coli may enable us to compare the mean ribosome speed in HSRs with that in other regions. Surprisingly, we found that the ribosome density in HSRs was significantly lower than that in FARs (1.007 in FARs, 0.956 in HSRs, paired t-test, P < 10−5, fig. 6). By checking the ribosome density in HSRs, we found a notable reduction near the 40 nt downstream of the start position of HSRs (fig. 6). No obvious ribosome accumulation was observed in either FARs or HSRs. The results seemed to contradict the fact that the secondary structure slows down translation elongation (Wen et al. 2008; Tholstrup et al. 2012), and that higher ribosome density would be observed in the HSRs. A possible explanation for the results is that the ribosome density on mRNA is typically too low, and ribosomes are blocked at the start position of HSRs. To validate this explanation, we repeated the earlier mentioned processes using genes with expression levels at the top 30%. As expected, we found two regions with obvious ribosome accumulation near the start of HSRs (all P values < 10−5, fig. 6). Taken together, we concluded that HSRs blocked translation elongation and that local translation efficiency was regulated by HSRs, at least partly.
Fig. 6.—
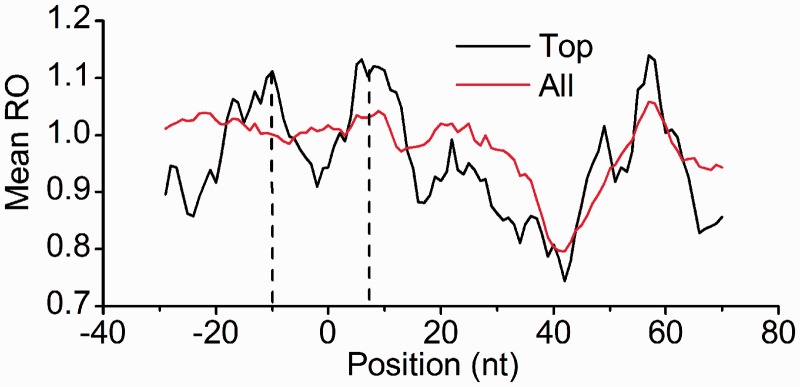
Mean ribosome density around the start of HSRs. 0 in horizontal axis: the start position of HSRs. Top: genes with expression levels at the top 30%. All: all available CDSs. Two center positions of ribosome accumulation are indicated by dashes.
Significant Difference in HSR Density among Different Gene Categories
mRNA secondary structures influence a number of cotranslational processes by modulating the local translation rate. The proper functions of gene are partly dependent on these regulation processes. Therefore, it is possible that HSRs have effect on gene functions. To test this hypothesis, genes were classified into five categories based on the GenProtEC database (Serres et al. 2004), and Kruskal–Wallis analysis of variance was performed among these categories. A weak but significant difference (P = 0.029, table 1 and supplementary table S2, Supplementary Material online) in HSR density among the five categories was found. Genes involved in cell processes and transport exhibited a higher HSR density, whereas regulation genes showed a lower value. By contrast, no remarkable difference was observed in the control (P > 0.1, table 1). Additionally, we also compared rHSR densities among gene categories and found a different pattern. Metabolism and transport genes showed higher rHSR density than other genes (table 1). Although regulation genes also had the lowest rHSR density, the mean ratio (rHSR density in cell processes/rHSR density in regulation) is significantly lower than that based on HSR density (1.037 on the average vs. 1.071, Wilcoxon test, P = 0.00085). Overall, the results indicated that genes involved in different processes had different HSR densities.
Table 1.
HSR Densities in Different Gene Categories
| Category | Genes | Nativea | Control 1 | Control 2 |
|---|---|---|---|---|
| Cell processes | 432 | 3.802 ± 0.088 | 0.951 ± 0.052 | 2.742 ± 0.031 |
| Transport | 667 | 3.775 ± 0.070 | 0.999 ± 0.041 | 2.838 ± 0.051 |
| Information transfer | 773 | 3.746 ± 0.067 | 0.972 ± 0.040 | 2.715 ± 0.047 |
| Metabolism | 1,596 | 3.629 ± 0.046 | 1.018 ± 0.027 | 2.765 ± 0.043 |
| Regulation | 460 | 3.561 ± 0.085 | 1.012 ± 0.052 | 2.644 ± 0.048 |
aNative: mean HSR density in native sequences. Control 1: mean HSR density in random sequences generated by shuffle mononucleotides. Control 2: mean HSR density in random sequences generated by shuffle all synonymous codons among sites with identical amino acids, whereas maintaining codon usage, GC content, and amino acid sequence.
For details, GO analyses were performed using the web application DAVID (Da Wei Huang and Lempicki 2008). Genes with HSR density at the top and bottom 30% were extracted, and the most enriched processes of the two groups were compared. We found that genes in the top group were enriched in the processes of cell division, cell morphogenesis, protein folding, and translation (fig. 7A), whereas genes in the bottom group were involved in fermentation and several processes related to biosynthesis (fig. 7B). Similar results were observed when conserved HSRs were used (supplementary fig. S7, Supplementary Material online). Moreover, the results remained unchanged when examining different thresholds (supplementary figs. S8 and S9, Supplementary Material online). Overall, these results suggested that the HSR density was associated with gene functions, and that genes involved in different biological processes had different number of HSRs.
Fig. 7.—

The most enriched terms between the top (A) and bottom (B) groups of HSR density. Some identical terms in two groups are not shown.
Significant Association between HSR Density and Gene Essentiality
Essential genes are those indispensable for the survival of an organism and are thus considered as foundations of life. Previous studies have proposed a series of features to distinguish essential and nonessential genes, such as protein connectivity (Arifuzzaman et al. 2006) and gene expression (Jeonga et al. 2003). Here, we found that essential genes have significantly higher HSR density than nonessential genes (4.05 in essential vs. 3.60 in nonessential, Wilcoxon test, P = 0.00017), whereas the difference was not obvious in the control (0.947 in essential vs. 0.959 in nonessential, Wilcoxon test, P = 0.86). Note that a difference in protein connectivity between essential and nonessential genes has been reported (Arifuzzaman et al. 2006), we investigated the correlation between HSR density and connectivity. Although no significant correlation was observed, we found a weak but significant difference in HSR density between the genes with connectivity at the top 30% and bottom 30% (3.49 in bottom vs. 3.75 in top, Wilcoxon test, P = 0.0067), whereas no significant difference was found in the control (0.94 at the bottom vs. 0.95 at the top, Wilcoxon test, P = 0.81). Again, to exclude the effect of codon usage and amino acid bias, we calculated the ratio Ddensity (Ddensity = HSR density in essential genes/HSR density in nonessential genes) and compared Ddensity with that in random sequence (rDdensity). We found that Ddentisy is significantly higher than rDdensity (1.12 in Ddensity vs. 1.02 on the average of rDdensity, Wilcoxon test, P = 9.5 × 10⁻⁷). Overall, all these findings revealed that there was an association between HSR density and gene essentiality, and that genes with high HSR density tended to have high connections with other genes.
Neither Protein Abundance nor mRNA Decay Attributes to the Variation in HSR Density
Gene functions are generally accepted to be associated with mRNA decay (Bernstein et al. 2002) and expression level (Barry et al. 2005; Lukk et al. 2010), which are partly regulated by the structural stability of mRNA (Kudla et al. 2009; Novikova et al. 2012; Tani et al. 2012; Zur and Tuller 2012). Thus, the difference in HSR density among gene categories might be an artifact arising from the difference in mRNA decay or expression level. To rule out this possibility, we calculated the correlations between HSR density, protein abundance, and mRNA half-life. The results showed that there was no significant correlation between HSR density and protein abundance (Spearman correlation, R = 0.016, N = 1,543, P = 0.52), as well as between HSR density and mRNA half-life (Spearman correlation, R = 0.03, N = 2,552, P = 0.11). Moreover, we extracted genes with expression levels at top 30% and bottom 30%. HSR densities of the two groups were compared, and again no significant difference was found (3.74 at top, 3.67 at bottom, N = 462, P = 0.56). These results indicated that the difference in HSR density among gene categories was not connected with the variation in protein abundance and mRNA decay.
Discussion
By surveying secondary structures in various genomes, previous studies have revealed that a large number of genomes are being transcribed to produce mRNAs that generally contain local secondary structures (Katz and Burge 2003; Meyer and Miklós 2005; Kertesz et al. 2010). Most studies focused on the structural conservation of functional elements. In this study, however, we showed that not all functional elements within mRNAs were structurally conserved. The elements might maintain high structural stability rather than structural specificity during evolution. This finding led us to survey other regions with high structural stability. As expected, we found that CDSs exhibited substantially high HSR levels compared with the control. In particular, we found that HSRs tended to be located in the 5′ or 3′ coding region, which was consistent with the findings of Tuller et al. (2011). In addition, previous studies have shown that there is a universally reduced structural stability near the start codon (Gu et al. 2010). However, our results suggested that a few genes (∼6%, fig. 4) still maintained higher structural stability in this region during evolution, and that these genes might be under selection for low initiation efficiency.
Although we defined HSRs using low z-score value, it did not ensure that there is a direct selective constraint imposed on HSRs to retain high structural stability. Thus, we calculated the SCR of HSRs. Our results indicated that HSRs were not the by-product of selection for other factors and HSRs might be functional. This result led us to investigate the correlation between the number of HSRs and gene functions. GO analysis showed that genes with similar HSR density tended to be enriched in the same biological processes. We also found that essential genes showed higher HSR density than nonessential genes. Furthermore, we have ascertained that these results remained unchanged under various controls, in various organisms (supplementary figs. S4–S9, Supplementary Material online). Additionally, the results still held even after excluding the HSRs that contained the conserved secondary structures (supplementary fig. S10, Supplementary Material online).
We further showed that the number variation of HSRs was not connected with protein abundance and mRNA decay. Our result seemly contradicted the findings in previous study that reported a positive correlation between the structural stability of mRNA and protein abundance (Zur and Tuller 2012). To explain this difference, we calculated the correlation between the mean structural stability of CDSs and protein abundance. Indeed, we found a weak but significant correlation (R = −0.08, N = 1,543, P < 0.001), which was consistent with the claim that genes with high structural stability had high protein abundance (Zur and Tuller 2012). However, HSRs were small regions on mRNA (that is, the regions covered by all HSRs of a CDS were ∼30%, on average), and more than 94% HSRs were located in the regions downstream of the 90 nt (fig. 4). Thus, the number variation of HSRs might affect local elongation efficiency but had weak effect on whole translation efficiency. Moreover, we focused on prokaryotes and investigated the correlation between the number of HSRs and protein abundance, which is different from the Zur’s work.
How does the number of HSRs contribute to gene functions or gene essentiality? One possibility is that it affects posttranslational modification of the nascent polypeptide by changing the translation speed as summarized by Shabalina et al. (2013). An example of posttranslational modification involving mRNA secondary structure has been shown for actins (Zhang et al. 2010). mRNA encoding gamma-actin forms a stable structure near the translation initiation site, resulting in a significant reduction in the translation speed. Although this reduction does not significantly affect the overall protein abundance, it leads to a slower folding of gamma-actin due to ribosome pausing and thus makes it vulnerable to ubiquitin conjugation machinery attracted by cotranslational arginylation. Another possibility is that HSRs are connected with the regulation of protein folding. It has been revealed that HSRs lead to ribosome pausing, which may have drastic effects on the folding efficiency of newly synthesized proteins (Jia et al. 2004; Watts et al. 2009). Overall, HSRs might influence gene functions by changing the local translation rate.
This analysis has several limitations. First, we used a sliding window to define the HSRs, and the boundary of HSR was difficult to determine. Second, we focused on the correlation between the number of HSRs and biological processes and did not determine whether all HSRs are functional. Third, although we showed that HSRs blocked the ribosome speed, we failed to show the evidence that HSRs influence gene functions by changing the ribosome speed. The mechanisms underlying the association between HSRs and gene function are worth pursuing at a deeper level.
Supplementary Material
Supplementary figures S1–S10 and tables S1 and S2 are available at Genome Biology and Evolution online (http://www.gbe.oxfordjournals.org/).
Acknowledgments
The authors are grateful to Liao Mingzhi for helping on the analyses of the PPI network. They thank Guo Qingli for the suggestions on the manuscript. They thank the two anonymous reviewers for their excellent suggestions. This work was supported by the PhD Programs Foundation of the Ministry of Education of China (20100204110026) in S.T.’s Lab. Y.H.M. designed, carried out the study, and drafted the manuscript. Q.L. carried out the study. W.T.W. participated in the sequence alignment and the estimation of sequence identity. P.Q.L. participated in the analyses of ribosome occupancy. Y.H.M. and S.H.T. designed the study.
Literature Cited
- Arifuzzaman M, et al. Large-scale identification of protein–protein interaction of Escherichia coli K-12. Genome Res. 2006;16:686–691. doi: 10.1101/gr.4527806. [DOI] [PMC free article] [PubMed] [Google Scholar]
- Ashburner M, et al. Gene ontology: tool for the unification of biology. Nat Genet. 2000;25:25. doi: 10.1038/75556. [DOI] [PMC free article] [PubMed] [Google Scholar]
- Barry WT, Nobel AB, Wright FA. Significance analysis of functional categories in gene expression studies: a structured permutation approach. Bioinformatics. 2005;21:1943–1949. doi: 10.1093/bioinformatics/bti260. [DOI] [PubMed] [Google Scholar]
- Bernstein JA, et al. Global analysis of mRNA decay and abundance in Escherichia coli at single-gene resolution using two-color fluorescent DNA microarrays. Proc Natl Acad Sci U S A. 2002;99:9697. doi: 10.1073/pnas.112318199. [DOI] [PMC free article] [PubMed] [Google Scholar]
- Cabrita LD, Dobson CM, Christodoulou J. Protein folding on the ribosome. Curr Opin Struct Biol. 2010;20:33–45. doi: 10.1016/j.sbi.2010.01.005. [DOI] [PubMed] [Google Scholar]
- Clarke T, Clark P. Increased incidence of rare codon clusters at 5' and 3' gene termini: implications for function. BMC Genomics. 2010;11:118. doi: 10.1186/1471-2164-11-118. [DOI] [PMC free article] [PubMed] [Google Scholar]
- Da Wei Huang BTS, Lempicki RA. Systematic and integrative analysis of large gene lists using DAVID bioinformatics resources. Nat Protoc. 2008;4:44–57. doi: 10.1038/nprot.2008.211. [DOI] [PubMed] [Google Scholar]
- Dawson WK, Yamaoto K. Mean free energy topology for nucleotide sequences of varying composition based on secondary structure calculations. J Theor Biol. 1999;201:113–140. doi: 10.1006/jtbi.1999.1018. [DOI] [PubMed] [Google Scholar]
- Dethoff EA, Chugh J, Mustoe AM, Al-Hashimi HM. Functional complexity and regulation through RNA dynamics. Nature. 2012;482:322–330. doi: 10.1038/nature10885. [DOI] [PMC free article] [PubMed] [Google Scholar]
- Diwa A, Bricker AL, Jain C, Belasco JG. An evolutionarily conserved RNA stem-loop functions as a sensor that directs feedback regulation of RNase E gene expression. Genes Dev. 2000;14:1249–1260. [PMC free article] [PubMed] [Google Scholar]
- Edgar RC. MUSCLE: multiple sequence alignment with high accuracy and high throughput. Nucleic Acids Res. 2004;32:1792–1797. doi: 10.1093/nar/gkh340. [DOI] [PMC free article] [PubMed] [Google Scholar]
- Fogel GB, et al. Discovery of RNA structural elements using evolutionary computation. Nucleic Acids Res. 2002;30:5310–5317. doi: 10.1093/nar/gkf653. [DOI] [PMC free article] [PubMed] [Google Scholar]
- Giedroc DP, Cornish PV. Frameshifting RNA pseudoknots: structure and mechanism. Virus Res. 2009;139:193–208. doi: 10.1016/j.virusres.2008.06.008. [DOI] [PMC free article] [PubMed] [Google Scholar]
- Goodarzi H, et al. Systematic discovery of structural elements governing stability of mammalian messenger RNAs. Nature. 2012;485:264–268. doi: 10.1038/nature11013. [DOI] [PMC free article] [PubMed] [Google Scholar]
- Gruber AR, et al. The Vienna RNA websuite. Nucleic Acids Res. 2008;36:W70–W74. doi: 10.1093/nar/gkn188. [DOI] [PMC free article] [PubMed] [Google Scholar]
- Gruber AR, Neuböck R, Hofacker IL, Washietl S. The RNAz web server: prediction of thermodynamically stable and evolutionarily conserved RNA structures. Nucleic Acids Res. 2007;35:W335–W338. doi: 10.1093/nar/gkm222. [DOI] [PMC free article] [PubMed] [Google Scholar]
- Gu W, Zhou T, Wilke CO. A universal trend of reduced mRNA stability near the translation-initiation site in prokaryotes and eukaryotes. PLoS Comput Biol. 2010;6:e1000664. doi: 10.1371/journal.pcbi.1000664. [DOI] [PMC free article] [PubMed] [Google Scholar]
- Jeonga H, Oltvai ZN, Barabsi A. Prediction of protein essentiality based on genomic data. ComPlexUs. 2003;1:19–28. [Google Scholar]
- Jia M, Luo L, Liu C. Statistical correlation between protein secondary structure and messenger RNA stem-loop structure. Biopolymers. 2004;73:16–26. doi: 10.1002/bip.10496. [DOI] [PubMed] [Google Scholar]
- Kanehisa M, et al. KEGG for linking genomes to life and the environment. Nucleic Acids Res. 2008;36:D480–D484. doi: 10.1093/nar/gkm882. [DOI] [PMC free article] [PubMed] [Google Scholar]
- Kato J, Hashimoto M. Construction of consecutive deletions of the Escherichia coli chromosome. Mol Syst Biol. 2007;3:132. doi: 10.1038/msb4100174. [DOI] [PMC free article] [PubMed] [Google Scholar]
- Katz L, Burge CB. Widespread selection for local RNA secondary structure in coding regions of bacterial genes. Genome Res. 2003;13:2042–2051. doi: 10.1101/gr.1257503. [DOI] [PMC free article] [PubMed] [Google Scholar]
- Keller TE, Mis SD, Jia KE, Wilke CO. Reduced mRNA secondary-structure stability near the start codon indicates functional genes in prokaryotes. Genome Biol Evol. 2012;4:80–88. doi: 10.1093/gbe/evr129. [DOI] [PMC free article] [PubMed] [Google Scholar]
- Kertesz M, et al. Genome-wide measurement of RNA secondary structure in yeast. Nature. 2010;467:103–107. doi: 10.1038/nature09322. [DOI] [PMC free article] [PubMed] [Google Scholar]
- Komar AA. A pause for thought along the co-translational folding pathway. Trends Biochem Sci. 2009;34:16–24. doi: 10.1016/j.tibs.2008.10.002. [DOI] [PubMed] [Google Scholar]
- Kudla G, Murray AW, Tollervey D, Plotkin JB. Coding-sequence determinants of gene expression in Escherichia coli. Science. 2009;324:255–258. doi: 10.1126/science.1170160. [DOI] [PMC free article] [PubMed] [Google Scholar]
- Lee MT, Kim J. Self containment, a property of modular RNA structures, distinguishes microRNAs. PLoS Comput Biol. 2008;4:e1000150. doi: 10.1371/journal.pcbi.1000150. [DOI] [PMC free article] [PubMed] [Google Scholar]
- Lewis NE, et al. Omic data from evolved E. coli are consistent with computed optimal growth from genome-scale models. Mol Syst Biol. 2010;6:390. doi: 10.1038/msb.2010.47. [DOI] [PMC free article] [PubMed] [Google Scholar]
- Li GW, Oh E, Weissman JS. The anti-Shine-Dalgarno sequence drives translational pausing and codon choice in bacteria. Nature. 2012;484:538–541. doi: 10.1038/nature10965. [DOI] [PMC free article] [PubMed] [Google Scholar]
- Li W, et al. Genomic analysis of codon, sequence and structural conservation with selective biochemical-structure mapping reveals highly conserved and dynamic structures in rotavirus RNAs with potential cis-acting functions. Nucleic Acids Res. 2010;38:7718–7735. doi: 10.1093/nar/gkq663. [DOI] [PMC free article] [PubMed] [Google Scholar]
- Lu P, et al. Absolute protein expression profiling estimates the relative contributions of transcriptional and translational regulation. Nat Biotechnol. 2006;25:117–124. doi: 10.1038/nbt1270. [DOI] [PubMed] [Google Scholar]
- Lukavsky PJ. Structure and function of HCV IRES domains. Virus Res. 2009;139:166–171. doi: 10.1016/j.virusres.2008.06.004. [DOI] [PMC free article] [PubMed] [Google Scholar]
- Lukk M, et al. A global map of human gene expression. Nat Biotech. 2010;28:322–324. doi: 10.1038/nbt0410-322. [DOI] [PMC free article] [PubMed] [Google Scholar]
- Luo L, Jia M, Li X. Protein structure preference, tRNA copy number, and mRNA stem/loop content. Biopolymers. 2004;74:432–447. doi: 10.1002/bip.20094. [DOI] [PubMed] [Google Scholar]
- Mariappan M, et al. A ribosome-associating factor chaperones tail-anchored membrane proteins. Nature. 2010;466:1120–1124. doi: 10.1038/nature09296. [DOI] [PMC free article] [PubMed] [Google Scholar]
- Mathews DH, Sabina J, Zuker M, Turner DH. Expanded sequence dependence of thermodynamic parameters improves prediction of RNA secondary structure. J Mol Biol. 1999;288:911–940. doi: 10.1006/jmbi.1999.2700. [DOI] [PubMed] [Google Scholar]
- Meyer IM, Miklós I. Statistical evidence for conserved, local secondary structure in the coding regions of eukaryotic mRNAs and pre-mRNAs. Nucleic Acids Res. 2005;33:6338–6348. doi: 10.1093/nar/gki923. [DOI] [PMC free article] [PubMed] [Google Scholar]
- Moss WN, Priore SF, Turner DH. Identification of potential conserved RNA secondary structure throughout influenza A coding regions. RNA. 2011;17:991–1011. doi: 10.1261/rna.2619511. [DOI] [PMC free article] [PubMed] [Google Scholar]
- Novikova IV, Hennelly SP, Sanbonmatsu KY. Structural architecture of the human long non-coding RNA, steroid receptor RNA activator. Nucleic Acids Res. 2012;40:5034–5051. doi: 10.1093/nar/gks071. [DOI] [PMC free article] [PubMed] [Google Scholar]
- Pedersen JS, et al. A comparative method for finding and folding RNA secondary structures within protein-coding regions. Nucleic Acids Res. 2004;32:4925–4936. doi: 10.1093/nar/gkh839. [DOI] [PMC free article] [PubMed] [Google Scholar]
- Pedersen JS, et al. Identification and classification of conserved RNA secondary structures in the human genome. PLoS Comput Biol. 2006;2:e33. doi: 10.1371/journal.pcbi.0020033. [DOI] [PMC free article] [PubMed] [Google Scholar]
- Petrillo M, et al. Stem-loop structures in prokaryotic genomes. BMC Genomics. 2006;7:170. doi: 10.1186/1471-2164-7-170. [DOI] [PMC free article] [PubMed] [Google Scholar]
- Power PM, et al. Whole genome analysis reveals a high incidence of non-optimal codons in secretory signal sequences of Escherichia coli. Biochem Biophys Res Commun. 2004;322:1038–1044. doi: 10.1016/j.bbrc.2004.08.022. [DOI] [PubMed] [Google Scholar]
- Scharff LB, Childs L, Walther D, Bock R. Local absence of secondary structure permits translation of mRNAs that lack ribosome-binding sites. PLoS Genet. 2011;7:e1002155. doi: 10.1371/journal.pgen.1002155. [DOI] [PMC free article] [PubMed] [Google Scholar]
- Selinger DW, et al. Global RNA half-life analysis in Escherichia coli reveals positional patterns of transcript degradation. Genome Res. 2003;13:216–223. doi: 10.1101/gr.912603. [DOI] [PMC free article] [PubMed] [Google Scholar]
- Serres MH, Goswami S, Riley M. GenProtEC: an updated and improved analysis of functions of Escherichia coli K-12 proteins. Nucleic Acids Res. 2004;32:D300–D302. doi: 10.1093/nar/gkh087. [DOI] [PMC free article] [PubMed] [Google Scholar]
- Sewer A, et al. Identification of clustered microRNAs using an ab initio prediction method. BMC Bioinformatics. 2005;6:267. doi: 10.1186/1471-2105-6-267. [DOI] [PMC free article] [PubMed] [Google Scholar]
- Shabalina SA, Spiridonov NA, Kashina A. Sounds of silence: synonymous nucleotides as a key to biological regulation and complexity. Nucleic Acids Res. 2013;41(4):2073–2094. doi: 10.1093/nar/gks1205. [DOI] [PMC free article] [PubMed] [Google Scholar]
- Siller E, et al. Slowing bacterial translation speed enhances eukaryotic protein folding efficiency. J Mol Biol. 2010;396:1310–1318. doi: 10.1016/j.jmb.2009.12.042. [DOI] [PubMed] [Google Scholar]
- Tani H, et al. Genome-wide determination of RNA stability reveals hundreds of short-lived noncoding transcripts in mammals. Genome Res. 2012;22:947–956. doi: 10.1101/gr.130559.111. [DOI] [PMC free article] [PubMed] [Google Scholar]
- Taniguchi Y, et al. Quantifying E. coli proteome and transcriptome with single-molecule sensitivity in single cells. Science. 2010;329:533–538. doi: 10.1126/science.1188308. [DOI] [PMC free article] [PubMed] [Google Scholar]
- Thanaraj TA, Argos P. Protein secondary structural types are differentially coded on messenger RNA. Protein Sci. 1996;5:1973–1983. doi: 10.1002/pro.5560051003. [DOI] [PMC free article] [PubMed] [Google Scholar]
- Tholstrup J, Oddershede LB, Sørensen MA. mRNA pseudoknot structures can act as ribosomal roadblocks. Nucleic Acids Res. 2012;40:303–313. doi: 10.1093/nar/gkr686. [DOI] [PMC free article] [PubMed] [Google Scholar]
- Tuller T, et al. Composite effects of gene determinants on the translation speed and density of ribosomes. Genome Biol. 2011;12:R110. doi: 10.1186/gb-2011-12-11-r110. [DOI] [PMC free article] [PubMed] [Google Scholar]
- Tuller T, Waldman YY, Kupiec M, Ruppin E. Translation efficiency is determined by both codon bias and folding energy. Proc Natl Acad Sci U S A. 2010;107:3645–3650. doi: 10.1073/pnas.0909910107. [DOI] [PMC free article] [PubMed] [Google Scholar]
- Wan Y, et al. Understanding the transcriptome through RNA structure. Nat Rev Genet. 2011;12:641–655. doi: 10.1038/nrg3049. [DOI] [PMC free article] [PubMed] [Google Scholar]
- Washietl S, Hofacker IL. Consensus folding of aligned sequences as a new measure for the detection of functional RNAs by comparative genomics. J Mol Biol. 2004;342:19–30. doi: 10.1016/j.jmb.2004.07.018. [DOI] [PubMed] [Google Scholar]
- Watts JM, et al. Architecture and secondary structure of an entire HIV-1 RNA genome. Nature. 2009;460:711–716. doi: 10.1038/nature08237. [DOI] [PMC free article] [PubMed] [Google Scholar]
- Wen J-D, et al. Following translation by single ribosomes one codon at a time. Nature. 2008;452:598–603. doi: 10.1038/nature06716. [DOI] [PMC free article] [PubMed] [Google Scholar]
- Yanagitani K, Kimata Y, Kadokura H, Kohno K. Translational pausing ensures membrane targeting and cytoplasmic splicing of XBP1u mRNA. Science. 2011;331:586. doi: 10.1126/science.1197142. [DOI] [PubMed] [Google Scholar]
- Yu CH, Noteborn MH, Pleij CWA, Olsthoorn RCL. Stem–loop structures can effectively substitute for an RNA pseudoknot in -1 ribosomal frameshifting. Nucleic Acids Res. 2011;39:8952–8959. doi: 10.1093/nar/gkr579. [DOI] [PMC free article] [PubMed] [Google Scholar]
- Zhang F, Saha S, Shabalina SA, Kashina A. Differential arginylation of actin isoforms is regulated by coding sequence-dependent degradation. Science. 2010;329:1534. doi: 10.1126/science.1191701. [DOI] [PMC free article] [PubMed] [Google Scholar]
- Zhang G, Hubalewska M, Ignatova Z. Transient ribosomal attenuation coordinates protein synthesis and co-translational folding. Nat Struct Mol Biol. 2009;16:274–280. doi: 10.1038/nsmb.1554. [DOI] [PubMed] [Google Scholar]
- Zur H, Tuller T. Strong association between mRNA folding strength and protein abundance in S. cerevisiae. EMBO Rep. 2012;13:272–277. doi: 10.1038/embor.2011.262. [DOI] [PMC free article] [PubMed] [Google Scholar]
Associated Data
This section collects any data citations, data availability statements, or supplementary materials included in this article.