Proteases are known as extremely important signaling molecules and the deregulation of specific protease activities can ultimately lead to severe pathologies, which include cardiovascular disease, osteoporosis, inflammatory disease, neurodegenerative disorders, and cancer.[1] Therefore, identifying the role of a specific protease in a given biological process is crucial to promote new approaches for the prevention of diseases.[2] A system that enables the direct and simultaneous monitoring of multiple proteolytic activities in living organisms has great potential for elucidating complex protease signaling pathways, as well as testing the efficacy of drugs that target proteases.
To date, a range of fluorescence resonance energy transfer (FRET) based fluorogenic peptides that are comprised of a substrate combined with a dye/quencher pair have been developed to monitor proteolytic activities.[3] However, the conventional fluorogenic peptides are of limited use for examining protease signaling in a proteolytic cascade that is induced by multiple proteases, for example, the blood coagulation cascade.,[4] Furthermore, using a fluorogenic peptide for producing multicolored images of proteases would require a multistep synthesis and distinctive dye/quencher pair selections. The use of broad-spectrum quenchers[5] may be appropriate, but such molecules do not completely quench all of the available dyes, and are also inconvenient to synthesize. Moreover, to target intracellular proteases, sensors need to be further modified with cell-penetrating peptides or transfecting agents to be taken up into cells.[6] Recent advances in the field of activable sensors have enabled real-time imaging of various protease activities in vitro and in vivo.[7] However, no single sensor has been used for multiplexed imaging of intracellular proteases in living cells. Engineered fluorescent protein FRET pairs and luminescent proteins that are accompanied by a protease substrate have also been developed for real-time cellular imaging, but these strategies require genetically modified cells.[8]
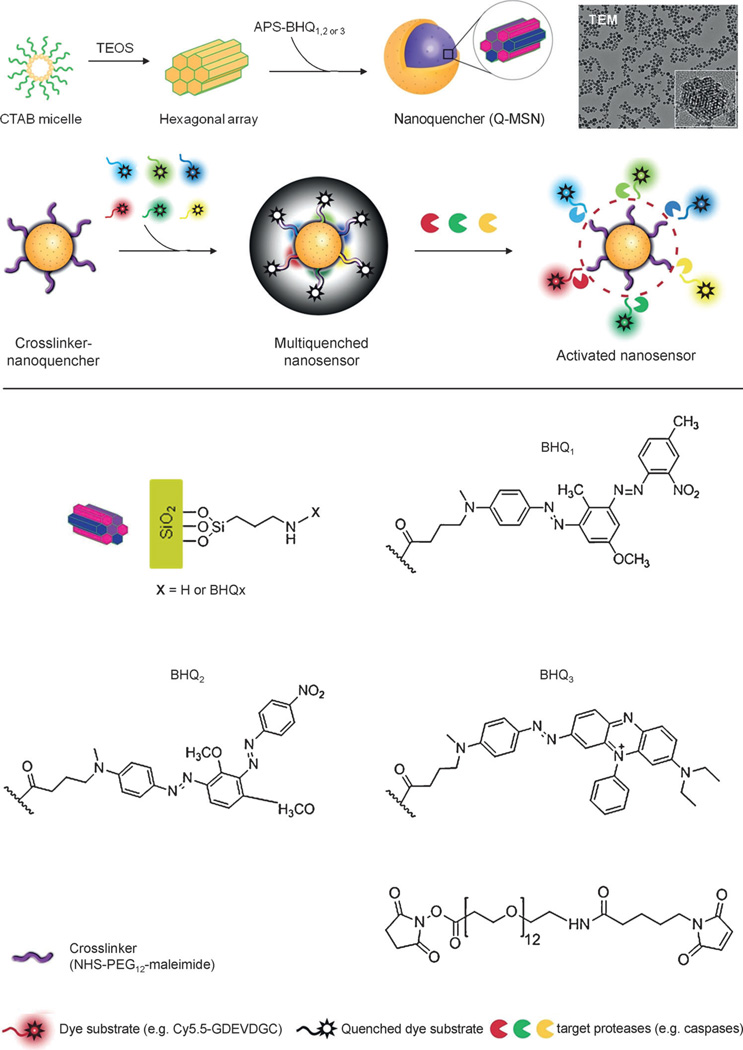
Herein, we present an alternative nanosensor that monitors a proteolytic cascade in living cells. The synthesis of the sensor is a simple, one-step technique that boosts multiple fluorescence signals upon simultaneous activation by different proteases. This nanosenor is based on a nonfluorescent, broad-spectrum, organic nanoquencher that is generated by incorporating a series of dark quenchers into mesoporous silica nanoparticles (MSNs, Figure 1). This nanoquencher is able to quench a variety of common dyes in the visible to near-infrared (NIR) range and maintain the advantages of MSNs, such as a high loading efficiency, facile chemistry for modification, cell penetration, and biocompatibility.[9] The nanosensor can be prepared by conjugating a set of protease-specific substrates of the dye onto the reactive surface of the nanoquencher. Taken together, this nanosensor platform delivers multivalent quenched substrates to different targeted proteases for multiplexed imaging of various protease activities in living cells.
Figure 1.
Design of nonfluorescent and broad-spectrum nanoquencher and nanosensor. Top: diagram showing the synthesis of Q-MSNs. Image: TEM image of Q-MSNs. Bottom: chemical structures of the components of Q-MSNs. CTAB, cetyltrimethylammonium bromide; TEOS, tetraethyl orthosilicate; APS, 3-aminopropyltriethoxysilane.
As a proof-of-concept, we developed a nanosensor platform to target the caspase cascade in apoptotic cells. Caspases are a family of cysteine proteases that play critical roles in apoptosis, which is a mode of programmed cell death.[10] Caspases control the apoptotic signal in a proteolytic cascade by cleaving and activating multiple caspases through different pathways, which ultimately contribute to the death of the cell. As the most effective anticancer therapeutics rely on apoptosis, multiplexed imaging of the caspase cascade in single cells will improve the understanding of the effects of apoptotic signals on drug-induced apoptosis and assist in the screening of apoptosis-related drugs.[11] Various optical sensors that target caspase activities are available,[6,8, 11] but no sensor that monitors multiple caspase activities in living cells by using a single probe and without genetically modifying cells has been reported to date. Herein, we describe a nanosensor that targets multiple caspases, and its application in cellular systems.
The nanosensor is comprised of dark quenchers along with porous nanomaterials as a broad-spectrum quencher. A specific dark quencher is able to absorb the fluorescence that is produced by the dye when the absorption spectrum of the quencher overlaps with the emission spectrum of the dye.[12] Various dark quenchers are commercially available and the most popular, a series of black hole quenchers (BHQ), were used in this study. MSNs have a large surface area (more than 1000 m2 g−1) onto which multiple dark quenchers can be doped. To determine if embedded quenchers can maintain their inherent absorption spectra, four different BHQ-doped MSNs were prepared by incorporating 3-aminopropyltriethoxysilane (APS) conjugated to the individual quenchers BHQ-1, BHQ-2, and BHQ-3 (APS–BHQx), as well as the mixture of all three BHQs into MSNs (Q1-MSN, Q2-MSN, Q3-MSN, and Q-MSN, respectively, Figure 1, see also Scheme S1 in the Supporting Information). Transmission electron microscopy was used to show that BHQ-doped MSNs are spherical, approximately 60 nm in diameter, and are well dispersed in a solution of aqueous buffer (Figure 1).
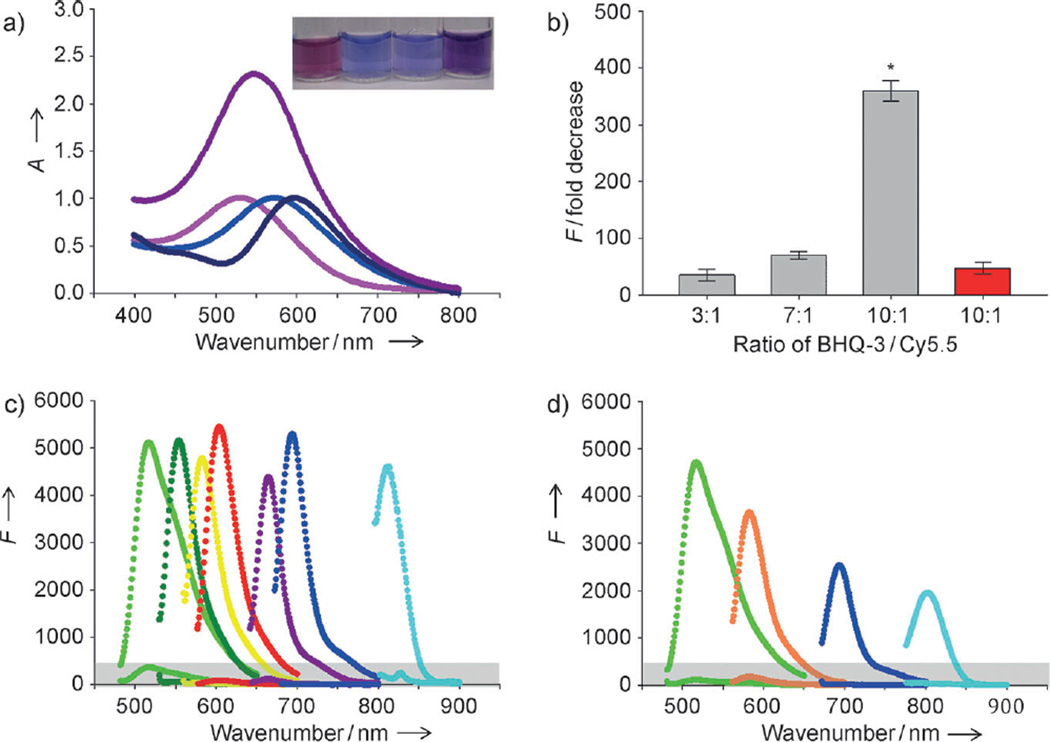
BHQ-doped MSNs maintained the absorption spectrum of the BHQ (480–580 nm, 550–650 nm, 620–730 nm, for Q1-MSNs, Q2-MSNs, and Q3-MSNs, respectively) and were translucent (Figure 2a). In particular, the absorption spectrum of Q-MSN had a broad peak over the 450–750 nm range, which suggests it is an effective broad-spectrum nanoquencher. To optimize quenching conditions, the quencher/dye ratio of BHQ-doped MSNs was investigated for fluorescence quenching efficiency. Q3-MSNs and the corresponding dye Cy5.5 (λmax excitation/emission (ex/em)=675/695) was chosen as a model compound. Three types of Q3-MSNs that contain different amounts of BHQ-3 (150, 350, and 500 BHQ-3 molecules per MSN) were prepared. A fixed amount of Cy5.5-N-hydroxy succinimide (NHS) ester was then conjugated onto the primary NH2 groups of the Q3-MSNs, which gave Q3-MSNs with BHQ-3/Cy5.5 ratios of three, seven, and ten. As shown in Figure 2b, the quenching effect of Q3-MSNs on the fluorescence produced by Cy5.5 (expressed as the fold decrease in fluorescence from the initial value) was exponentially improved with increasing numbers of BHQ-3 per Cy5.5 molecule (for the BHQ-3/Cy5.5 ratios of three, seven, and ten the decrease in fluorescence was (35.1±10.2), (69.9±6.8), and (358.9±17.8)-fold, respectively). These results indicate that loading a large number of quenchers onto the MSNs quenches the fluorescence of a single dye more effectively than a single quencher/dye pair. The distance between dyes over which FRET can occur is typically limited to 10 nm. As the diameter of MSNs is around 60 nm and the majority of Cy5.5 molecules are conjugated to the surface of the MSNs, BHQs that are embedded in the core of the MSNs would not be able to participate in the FRET-quenching process. To explain how the increased number of embedded BHQs was able to improve the quenching of fluorescence signals, we hypothesized that the dyes enter into the mesoporous channels of the MSNs. Thus, the distance between the dye and the quencher was kept in the effective FRET range. To test this hypothesis, BHQ3-doped nonmesoporous silica nanoparticles (Q3-SNs) were synthesized and their quenching efficiency was compared with Q3-MSNs. Under the same experimental conditions, Q3-MSNs were (7.7±0.4)-fold more effective at quenching the fluorescence than Q3-SNs, even though Q3-SNs were able to quench Cy5.5 signals on their surface (Figure 2 b). Therefore, the mesoporous structure of nanoparticles plays an important role in increasing the quenching ability of the MSNs by closing the distance between the quenchers and the dyes. After the BHQ/dye ratio was fixed at ten, we studied the fluorescence-quenching effect of Q-MSN on seven different fluorescent dyes in the visible to NIR range (λmax em from 522 to 814 nm, Figures S1–S3 in the Supporting Information). Q-MSNs provided a broad quenching effect over the range of 500 to 800 nm and the maximum quenching effect was a reduction in fluorescence of over 500-fold (Figure 2c). It should be noted that although the maximum absorption of Q-MSNs is far less than 800 nm, Q-MSNs were able to quench the NIR dye FPI-774 (λmax em, 814 nm). When the Q-MSNs were labeled with four different dyes, FPG-456 (λmax ex/em 495/522), FPR-560 (λmax ex/em 550/598), Cy5.5 (λmax ex/em 675/695) and FPI-774 (λmax ex/em 782/814, Figure S4 in the Supporting Information), all of the dyes were simultaneously quenched (Figure 2d).
Figure 2.
Quenching properties of nanoquenchers against various dyes. a) Absorbance spectra of Q1-MSNs (pink), Q2-MSNs (light blue), Q3-MSNs (dark blue), and Q-MSNs (purple) Inset: nanoquenchers dispersed in distilled water, from left to right, Q1-MSNs, Q2-MSNs, Q3-MSNs, and Q-MSNs. b) Fluorescence quenching efficiency of Q3-MSNs based on the BHQ3/Cy5.5 ratio and the structures of the nanoparticles. MSNs (with pores)=gray; SNs (no pores)=red. *P<0.001, MSNs versus SNs. c) Fluorescence quenching effect of Q-MSNs on FPG-456 (light green), FPG-530 (dark green), FPR-560 (yellow), FPR-570 (red), FPR-648 (purple), Cy5.5 (dark blue), and FPI-774 (light blue). The Q-MSNs were labeled with each dye separately. The appropriate excitation wave number for each dye was set and the emission spectra were recorded. d) Fluorescence quenching effects of Q-MSNs concurrently labeled with FPG-456 (green), FPR-560 (orange), Cy5.5 (dark blue), and FPI-774 (light blue). For graphs c) and d) upper lines=fluorescence emission spectra of free dyes; lower lines (gray zone)=emission spectra of dyes after quenching by Q-MSNs.
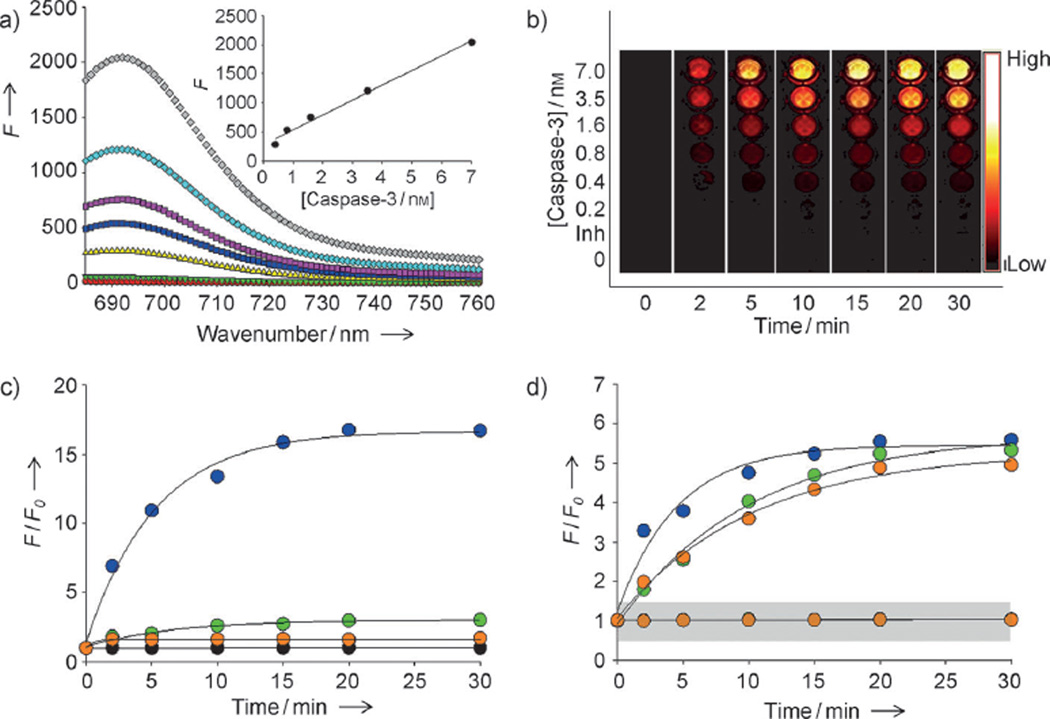
The nanoquencher was further modified as an activable nanosensor by inserting target, protease-specific substrates between the nanoquencher and the dye. Before targeting multiple proteases, Q3-MSNs were tested in a single protease assay for caspase-3. The Q3-MSNs were modified with an optimized crosslinker, NHS-PEG12-maleimide (Figure S6 in the Supporting Information), and then stabilized with the Cy5.5-substrate Cy5.5-GDEVDGC, in which the core specific substrate DEVD is selective for caspase-3 (Scheme S2 and Figure S5 in the Supporting Information). A cysteine residue was incorporated to allow specific conjugation of the substrate through a thiol-reactive maleimide group on the Q3-MSNs (Scheme S2 in the Supporting Information). The caspase-3 nanosensor C3Q3-MSN was purified on a desalting column (PD-10), dialyzed against distilled water, and concentrated. The C3Q3-MSNs were well-dispersed in the enzyme reaction buffer (4-(2-hydroxyethyl)-1-piperazineethanesulfonic acid (HEPES, 50 mm), NaCl (100 mm), 3-[(3-cholamidopropyl)dimethylammonio]-1-propane sulfonate (CHAPS, 0.1%), dithiothreitol (10 mm), and ethylenediaminetetraacetic acid (EDTA, 1 mm) at pH 7.5) and had no significant change in overall shape and size. As shown in Figure 3a, the fluorescence signals were completely quenched in buffer; however, the signals were strongly activated ((135±8.5)-fold) when C3Q3-MSNs (3 µg) were incubated with active caspase-3 (7 nm) at 37°C for 30 min. Fluorescence signals were strongly quenched when the nanosensor was incubated along with caspase-3 and the caspase-3 inhibitor Z-DEVD-FMK (100 µm). Spectrofluorometry and fluorescence optical images clearly demonstrate that the intensity of the recovered fluorescence signal is proportional to the concentration of caspase-3 (0.4 nm to 7 nm, r2=0.99), time-dependent, and rapid (Figures 3a and b). Similarly, a nanosensor that targets caspase-3 by using Q-MSNs was prepared as described above, and the caspase selectivity of the C3Q-MSNs was evaluated by incubating the nanoparticles in buffer that contained caspase-3, caspase-8, and caspase-9 (7 nm each). As shown in Figure 3c, the significant recovery of fluorescence signals occurred only with caspase-3 ((16.7±1.8), (2.8±0.3), and (1.7±0.2)-fold increases in fluorescence for caspase-3, caspase-8, and caspase-9, respectively). To prepare a nanosensor that is capable of targeting of multiple caspases simultaneously the CQ-MSNs were labeled with a mixture of three dye substrates (Cy5.5-GDEVDGC, FPG456-GIETDGC, and FPR560-GLEHDGC for caspase-3, caspase-8, and caspase-9, respectively, Scheme S2 in the Supporting Information). The enzyme specificity was tested in the same reaction buffer as before (Figure 3d). The fluorescence signals from the different dyes on the CQ-MSNs were 490 nm, 560 nm, and 675 nm, for caspase-8, caspase-9, and caspase-3, respectively. As expected, different caspases were able to activate a particular dye by targeting a corresponding substrate (the increases in the fluorescence signals were (5.3±0.5), (4.9±0.4), and (5.6±0.4)-fold for caspase-8, caspase-9, and caspase-3, respectively). Differences in the activation kinetic profiles among caspases are a result of the dissimilar proteolytic activity of the dye substrates with the corresponding caspases. Multiple fluorescence activation was less than that caused by the nanoparticles that contained only a single quencher and substrate, for example, C3Q3-MSNs, or multiple quenchers and substrates, for example, C3Q-MSNs; however, CQ-MSNs provided enough signal changes so that the changes can be clearly distinguished from the cells. The caspases should be specific for their intended substrates, as used in this study, but substrate specificity can overlap (Figure S7 in the Supporting Information).[13] This is the inherent limitation and problem of the caspase substrates that have been reported. As our sensing platform enables versatile modification of substrates, any substrate can be replaced by highly specific, or newly discovered, substrates in the future to improve its specificity and efficiency. As CQ-MSNs target intracellular proteases, the nanosensor needs to penetrate the cell membrane and reach the intracellular compartment. The uptake of MSNs into cells was investigated by using MSNs that were labeled with fluorescein isothiocyanate (FITC) in HCT116 human colon cancer cells. MSNs were internalized into the cells after 2 h and were localized mostly in the cytoplasm and perinuclear regions of the cells, where activated caspases can be found (Figure S8 in the Supporting Information). The cytotoxicity of MSNs was tested in the same cell line and the nanoparticles were not toxic at concentrations of up to 500 µg mL−1 (Figure S9 in the Supporting Information). Overall, the in vitro characterization of CQ-MSNs indicated that the system could be used for quantitative imaging analysis of multiple caspase activities in cells.
Figure 3.
Enzyme specificity of the nanosensor targeting multiple caspases. a) Fluorescence emission spectra of C3Q3-MSNs in the presence of various concentrations of caspase-3 (in nm: 0 black, 0.2 light green, 0.4 yellow, 0.8 dark blue, 1.6 purple, 3.5 light blue, 7 gray) and caspase-3 with inhibitor (red). Inset: caspase-3 standard curve. The excitation was set at 675 nm. b) Fluorescence image sections of a 96-well microplate at different time points after incubation of C3Q3-MSN with various concentrations of caspase-3 with (Inh.) or without inhibitor (low=0; high=0.12×10⁶×photons cm−2 s−1). c) The relative increase in fluorescence (F/F0) produced by C3Q-MSNs in the presence of 7 nm caspase-3 (blue), caspase-8 (green), or caspase-9 (orange), or in the absence of any of the caspases (black). The excitation was set at 675 nm and the emission was recorded at 695 nm. d) F/F0 of CQ-MSNs in the presence (upper lines) or absence (lower lines in grey zone) of caspase-3 (blue), caspase-8 (green), or caspase-9 (orange); the excitation wavelengths were set at 675, 470, and 560 nm, respectively, and the emission spectra were recorded at 695, 520, and 600 nm, respectively. Datapoints represent the means of triplicate experiments and standard deviation.
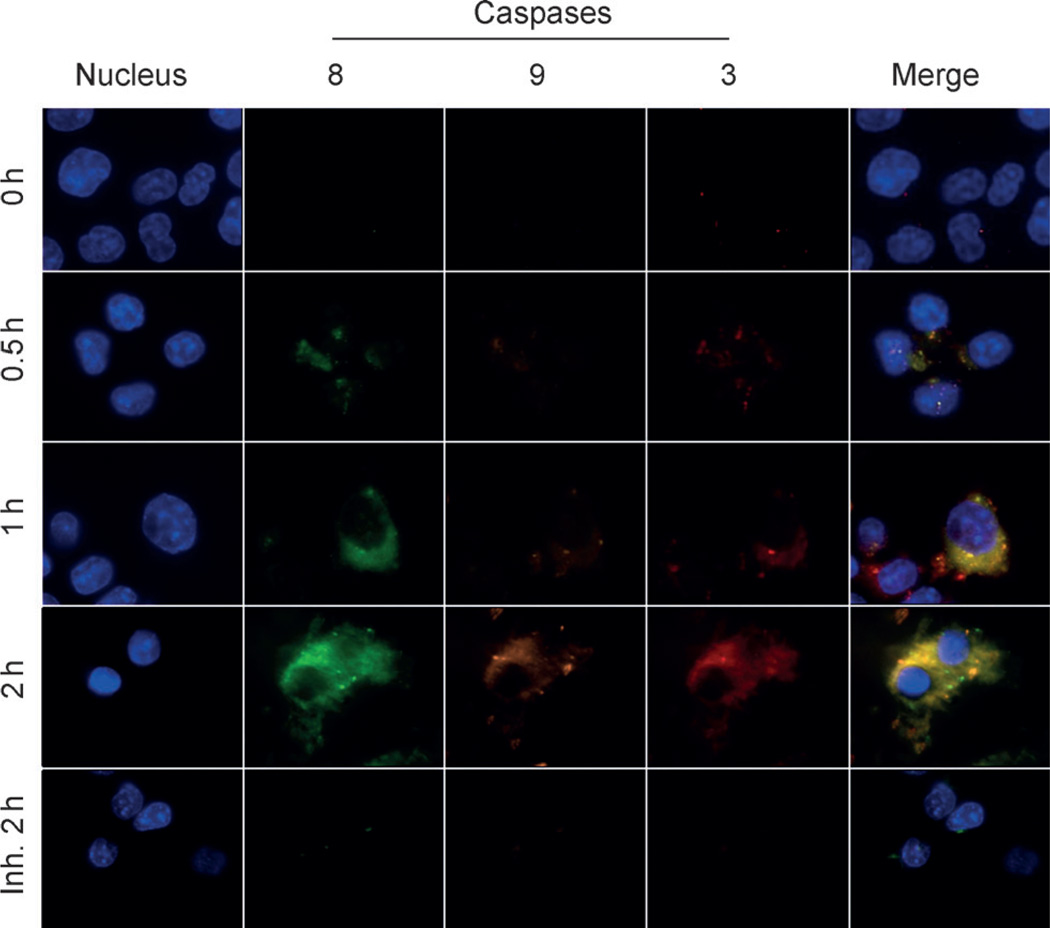
We investigated the potential application of CQ-MSNs for multiplexed imaging of the caspase cascade in HCT116 cells by using fluorescence microscopy. Apoptosis was induced by treating cells with tumor necrosis factor-related apoptosis-inducing ligand (TRAIL).[14] TRAIL is known to activate caspases through either the extrinsic or intrinsic pathway, depending on the cell line, and can activate caspase-3, caspase-8, and caspase-9 in HCT116 cells.[14b] The expression and activation of caspase-3, -8, and -9 upon treatment of the cells with TRAIL was verified by Western blot assays (Figure S10 in the Supporting Information). The HCT116 cells were first incubated with CQ-MSNs (50 µg mL−1) in serum-free Roswell Park Memorial Institute (RPMI) 1640 medium at 37°C for 2 h. The cells were washed twice with phosphate-buffered saline (PBS) and the caspase cascade was initiated by adding TRAIL (0.1 µg mL−1). The cells were also incubated without TRAIL and pretreated with caspase inhibitors (Z-DEVD-FMK, Z-IETD-FMK, and Z-LEHD-FMK for caspase-3, caspase-8, and, caspase-9, respectively) before exposure to TRAIL. The cells were fixed at different time points (0.5, 1, and 2 h post-incubation) and were imaged through four different filter sets, then the nucleus was stained. Figure 4 shows representative cellular images. Cells that were treated with the CQ-MSNs exhibited low background signals before TRAIL-induced apoptosis. After the cells were treated with TRAIL, the CQ-MSNs generated multiple strong fluorescence signals and allowed clear visualization of the caspase-dependent apoptotic process. Furthermore, the nanosensor emitted low fluorescence signals from three different channels upon addition of all three caspase inhibitors, which indicated multiple recovered fluorescence signals were activated by specific caspases. Taken together, these results demonstrate that CQ-MSNs can be used for imaging at the single cell level in the presence of multiple intracellular enzymes.
Figure 4.
Multiplexed imaging of the caspase cascade in HCT116 cells. Inh.=with inhibitor; blue (DAPI)=nucleus; red (Cy5.5)=caspase-3; green (FPG456)=caspase-8; purple (FPG560)=caspase-9.
Monitoring the activities of multiple intracellular proteases in living cells will not only help to improve the understanding of complex protease signaling mechanisms, but will also help identify and validate the efficacies of potential therapeutic inhibitors. In this study, we have demonstrated a biocompatible, cell-penetrating, nonfluorescent, broad-spectrum, activable probe based on a nanoquencher that is capable of producing multiplexed fluorescence signals in the presence of multiple proteases. As a model system, a series of alterations in caspase activities caused by TRAIL-induced apoptosis was directly visualized in living cells. The combination of various nonfluorescent quenchers in a single MSN produced strong quenching or activation of fluorescence in the presence of a broad range of visible and NIR fluorophores and substrates, thereby facilitating multiplexed imaging of a variety of protease activities. For more practical applications, further studies be explore real-time imaging and monitoring of caspase activities in living cells as well as in animal models. Furthermore, the large surface area, tunable size, and modifiable structure of MSNs enables the versatile functionalization of the nanoquencher for use in a variety of applications, such as a theranostic agent.
Supplementary Material
Footnotes
This work was supported by the Intramural Research Program of the NIBIB, NIH and partially supported by an NIH Pathway to Independence (K99/R00) Award, the Henry M. Jackson Foundation, and the Intramural Research Program of KIST (Korea). We thank Myung Sun Lee for illustrations.
Supporting information for this article is available on the WWW under http://dx.doi.org/10.1002/anie.201107795.
Contributor Information
Xinglu Huang, Laboratory of Molecular Imaging and Nanomedicine (LOMIN), National Institute of Biomedical Imaging and Bioengineering (NIBIB), National Institutes of Health (NIH, USA).
Magdalena Swierczewska, Laboratory of Molecular Imaging and Nanomedicine (LOMIN), National Institute of Biomedical Imaging and Bioengineering (NIBIB), National Institutes of Health (NIH, USA); Department of Biomedical Engineering, Stony Brook University (USA).
Ki Young Choi, Laboratory of Molecular Imaging and Nanomedicine (LOMIN), National Institute of Biomedical Imaging and Bioengineering (NIBIB), National Institutes of Health (NIH, USA).
Lei Zhu, Laboratory of Molecular Imaging and Nanomedicine (LOMIN), National Institute of Biomedical Imaging and Bioengineering (NIBIB), National Institutes of Health (NIH, USA).
Ashwinkumar Bhirde, Laboratory of Molecular Imaging and Nanomedicine (LOMIN), National Institute of Biomedical Imaging and Bioengineering (NIBIB), National Institutes of Health (NIH, USA).
Jinwoo Park, BioActs, DKC Corporation (Korea).
Kwangmeyung Kim, Center for Theragnosis, Korea Institute of Science and Technology (KIST, Korea).
Jin Xie, Department of Chemistry and Bio-Imaging Research Center, University of Georgia (USA).
Gang Niu, Laboratory of Molecular Imaging and Nanomedicine (LOMIN), National Institute of Biomedical Imaging and Bioengineering (NIBIB), National Institutes of Health (NIH, USA).
Kang Choon Lee, College of Pharmacy, SungKyunKwan University (Korea).
Seulki Lee, Email: seulki.lee@nih.gov, Laboratory of Molecular Imaging and Nanomedicine (LOMIN), National Institute of Biomedical Imaging and Bioengineering (NIBIB), National Institutes of Health (NIH, USA).
Xiaoyuan Chen, Email: shawn.chen@nih.gov, Laboratory of Molecular Imaging and Nanomedicine (LOMIN), National Institute of Biomedical Imaging and Bioengineering (NIBIB), National Institutes of Health (NIH, USA).
References
- 1.Puente XS, Sanchez LM, Overall CM, Lopez-Otin C. Nat. Rev. Genet. 2003;4:544–558. doi: 10.1038/nrg1111. [DOI] [PubMed] [Google Scholar]
- 2.a) Turk B. Nat. Rev. Drug Discovery. 2006;5:785–799. doi: 10.1038/nrd2092. [DOI] [PubMed] [Google Scholar]; b) Drag M, Salvesen GS. Nat. Rev. Drug Discovery. 2010;9:690–701. doi: 10.1038/nrd3053. [DOI] [PMC free article] [PubMed] [Google Scholar]; c) Cudic M, Fields GB. Curr. Protein Pept. Sci. 2009;10:297–307. doi: 10.2174/138920309788922207. [DOI] [PMC free article] [PubMed] [Google Scholar]
- 3.a) Matayoshi ED, Wang GT, Krafft GA, Erickson J. Science. 1990;247:954–958. doi: 10.1126/science.2106161. [DOI] [PubMed] [Google Scholar]; b) Zheng G, Chen J, Stefflova K, Jarvi M, Li H, Wilson BC. Proc. Natl. Acad. Sci. USA. 2007;104:8989– 8994. doi: 10.1073/pnas.0611142104. [DOI] [PMC free article] [PubMed] [Google Scholar]; c) Lee S, Park K, Lee SY, Ryu JH, Park JW, Ahn HJ, Kwon IC, Youn IC, Kim K, Choi K. Bioconjugate Chem. 2008;19:1743–1747. doi: 10.1021/bc800264z. [DOI] [PubMed] [Google Scholar]
- 4.Coughlin SR. Nature. 2000;407:258–264. doi: 10.1038/35025229. [DOI] [PubMed] [Google Scholar]
- 5.Peng X, Chen H, Draney DR, Volcheck W, Schutz- Geschwender A, Olive DM. Anal. Biochem. 2009;388:220– 228. doi: 10.1016/j.ab.2009.02.024. [DOI] [PubMed] [Google Scholar]
- 6.a) Maxwell D, Chang Q, Zhang X, Barnett EM, Piwnica- Worms D. Bioconjugate Chem. 2009;20:702–709. doi: 10.1021/bc800516n. [DOI] [PMC free article] [PubMed] [Google Scholar]; b) Dai N, Guo J, Teo YN, Kool ET. Angew. Chem. 2011;123:5211–5215. doi: 10.1002/anie.201007805. [DOI] [PMC free article] [PubMed] [Google Scholar]; Angew. Chem. Int. Ed. 2011;50:5105–5109. doi: 10.1002/anie.201007805. [DOI] [PMC free article] [PubMed] [Google Scholar]
- 7.a) Lee S, Park K, Kim K, Choi K, Kwon IC. Chem. Commun. 2008:4250–4360. doi: 10.1039/b806854m. [DOI] [PubMed] [Google Scholar]; b) Lee S, Xie J, Chen X. Chem. Rev. 2010;110:3087–3111. doi: 10.1021/cr900361p. [DOI] [PMC free article] [PubMed] [Google Scholar]; c) Lee S, Xie J, Chen X. Curr. Top. Med. Chem. 2010;10:1135–1144. doi: 10.2174/156802610791384270. [DOI] [PMC free article] [PubMed] [Google Scholar]; d) Zhu L, Xie J, Swierczewska M, Zhang F, Quan Q, Ma Y, Fang X, Kim K, Lee S, Chen X. Theranostics. 2011;1:18–27. doi: 10.7150/thno/v01p0018. [DOI] [PMC free article] [PubMed] [Google Scholar]; e) Swierczewska M, Lee S, Chen X. Phys. Chem. Chem. Phys. 2011;13:9929–9941. doi: 10.1039/c0cp02967j. [DOI] [PMC free article] [PubMed] [Google Scholar]
- 8.a) Bardet PL, Kolahgar G, Mynett A, Miguel-Aliaga I, Briscoe J, Meier P, Vincent JP. Proc. Natl. Acad. Sci. USA. 2008;105:13901–13905. doi: 10.1073/pnas.0806983105. [DOI] [PMC free article] [PubMed] [Google Scholar]; b) Kanno A, Yamanaka Y, Hirano H, Umezawa Y, Ozawa T. Angew. Chem. 2007;119:7739–7743. doi: 10.1002/anie.200700538. [DOI] [PubMed] [Google Scholar]; Angew. Chem. Int. Ed. 2007;46:7595–7599. doi: 10.1002/anie.200700538. [DOI] [PubMed] [Google Scholar]; c) Wu X, Simone J, Hewgill D, Siegel R, Lipsky PE, He L. Cytometry Part A. 2006;69:477–486. doi: 10.1002/cyto.a.20300. [DOI] [PubMed] [Google Scholar]
- 9.Huang X, Teng X, Chen D, Tang F, He J. Biomaterials. 2010;31:438–448. doi: 10.1016/j.biomaterials.2009.09.060. [DOI] [PubMed] [Google Scholar]; Huang X, Liu LLT, Liu H, Chen D, Tang F. ACS Nano. 2011;5:5390–5399. doi: 10.1021/nn200365a. [DOI] [PubMed] [Google Scholar]
- 10.a) Vaux DL, Korsmeyer SJ. Cell. 1999;96:245–254. doi: 10.1016/s0092-8674(00)80564-4. [DOI] [PubMed] [Google Scholar]; b) Riedl SJ, Shi Y. Nat. Rev. Mol. Cell Biol. 2004;5:897–907. doi: 10.1038/nrm1496. [DOI] [PubMed] [Google Scholar]
- 11.a) Kim K, Lee M, Park H, Kim JH, Kim S, Chung H, Choi K, Kim IS, Seong BL, Kwon IC. J. Am. Chem. Soc. 2006;128:3490–3491. doi: 10.1021/ja057712f. [DOI] [PubMed] [Google Scholar]; b) Lee S, Choi KY, Chung H, Ryu JH, Lee A, Koo H, Youn IC, Park JH, Kim IS, Kim SY, Chen X, Jeong SY, Kwon IC, Kim K, Choi K. Bioconjugate Chem. 2011;22:125–131. doi: 10.1021/bc1004119. [DOI] [PubMed] [Google Scholar]; c) Jun YW, Sheikholeslami S, Hostetter DR, Tajon C, Craik CS, Alivisatos AP. Proc. Natl. Acad. Sci. USA. 2009;106:17735–17740. doi: 10.1073/pnas.0907367106. [DOI] [PMC free article] [PubMed] [Google Scholar]; d) Niu G, Chen X. J. Nucl. Med. 2010;51:1659–1662. doi: 10.2967/jnumed.110.078584. [DOI] [PubMed] [Google Scholar]
- 12.Johansson MK, Cook RM. Chem. Eur. J. 2003;9:3466–3471. doi: 10.1002/chem.200304941. [DOI] [PubMed] [Google Scholar]
- 13.Pop C, Salvesen GS. J. Biol. Chem. 2009;284:21777–21781. doi: 10.1074/jbc.R800084200. [DOI] [PMC free article] [PubMed] [Google Scholar]; McStay GP, Salvesen GS, Green DR. Cell Death Differ. 2008;15:322–331. doi: 10.1038/sj.cdd.4402260. [DOI] [PubMed] [Google Scholar]
- 14.a) Chae SY, Kim TH, Park K, Jin CH, Son S, Lee S, Youn YS, Kim K, Jo DG, Kwon IC, Chen X, Lee KC. Mol. Cancer Ther. 2010;9:1719–1729. doi: 10.1158/1535-7163.MCT-09-1076. [DOI] [PMC free article] [PubMed] [Google Scholar]; b) Kim M, Liao L, Parker KR, Wang S, El-Deiry WS, Kao GD. Cancer Res. 2008;68:3440–3449. doi: 10.1158/0008-5472.CAN-08-0014. [DOI] [PubMed] [Google Scholar]
Associated Data
This section collects any data citations, data availability statements, or supplementary materials included in this article.


