

Abstract
Study Objectives:
Sleep disordered breathing is associated with cardiovascular disease. The pathophysiologic mechanisms remain unclear, but enhanced vascular inflammation is implicated. We sought to evaluate the association of sleep disordered breathing with biomarkers of inflammation.
Design:
Cross-sectional, observational.
Setting:
Community-based.
Participants:
There were 900 participants from the Framingham Heart Study site of the Sleep Heart Health Study (52% females, mean age 60 y, 23% ethnic minorities).
Interventions:
None.
Measurements:
We assessed circulating levels of nine inflammatory biomarkers in relation to polysomnographically-derived apnea-hypopnea index and hypoxemia index (% sleep time with oxyhemoglobin saturation < 90%). Multivariable models were adjusted for demographics, smoking, cardiovascular diseases, diabetes, and other potential confounders, without and with adjustment for body mass index.
Results:
With multivariable adjustment not including body mass index, the apnea-hypopnea index was associated with C-reactive protein, inter-leukin-6, fibrinogen, intercellular adhesion molecule-1, and P-selectin levels and hypoxemia index was associated with C-reactive protein, interleukin-6, and fibrinogen levels. After adjustment for body mass index, only the association of interleukin-6 with sleep disordered breathing remained significant: the adjusted mean serum interleukin-6 level was 2.93, 3.14, 3.34, and 4.62 pg/mL, respectively, in participants with apnea-hypopnea index < 5, 5-14.9, 15-29.9, and ≥ 30 events/h (P = 0.01 for trend) and 2.97, 3.01, 3.35, and 4.85 pg/mL, respectively, in participants with hypoxemia index < 0.5, 0.5-4.9, 5-9.9, and ≥ 10% of sleep time (P = 0.02 for trend).
Conclusions:
In a community-based sample, sleep disordered breathing is associated with higher levels of interleukin-6, a marker of myocardial infarction risk and mortality. Adiposity may mediate the increased levels of C-reactive protein, fibrinogen, intercellular adhesion molecule-1, and P-selectin observed in sleep disordered breathing.
Citation:
Chami HA; Fontes JD; Vasan RS; Keaney JF; O'Connor GT; Larson MG; Benjamin EJ; Gottlieb DJ. Vascular Inflammation and sleep disordered breathing in a community-based cohort. SLEEP 2013;36(5):763-768.
Keywords: Epidemiology, inflammation, sleep apnea syndromes
INTRODUCTION
Sleep disordered breathing (SDB) is associated with hypertension and prevalent cardiovascular disease.1,2 The pathophysiologic mechanisms underlying these relationships remain unclear, but there is evidence to implicate vascular inflammation.3–11 There are compelling data that atherosclerosis is a chronic inflammatory disease.12,13 A range of inflammatory molecules has been localized to the atherosclerotic plaque.14–16 C-reactive protein (CRP) and interleukin-6 (IL-6) are the most widely studied systemic markers of inflammation in cardiovascular disease (CVD). Levels of CRP and IL-6 are elevated in persons with prevalent CVD17 and predict future cardiovascular events18–20 and mortality21 in individuals with20 and without known CVD.19
Nevertheless, studies evaluating the association of SDB with serum CRP and IL-6 levels have yielded conflicting results. Several studies found an association between SDB severity and serum CRP levels,3–9 whereas other studies did not.22–28 Two small studies found an association between SDB severity and serum IL-6 levels,10,11 which conflicted with a larger study.29 Similarly, randomized controlled trials that evaluated the association of continuous positive airway pressure (CPAP) therapy and markers of inflammation levels also yielded heterogeneous results. One trial found no change in serum CRP or IL-6 levels after CPAP therapy30 and another trial found a significant decrease in CRP levels after CPAP therapy.31 Other markers of inflammation are less well studied. One study found an association between levels of intercellular adhesion molecule-1 (ICAM1) and SDB32 and another study did not.33 Plasma levels of CD40-ligands were elevated in otherwise healthy patients with SDB compared with matched control patients in one study.34 We hypothesized that SDB is associated with markers of inflammation, in particular with CRP and IL-6, and tested this hypothesis in a community-based sample of middle-aged adults selected independent of the presence of SDB or CVD.
METHODS
Sample
The study sample is a subset of the Framingham Offspring/
Omni cohort participants who underwent polysomnography as part of the Sleep Heart Health Study (SHHS). The designs of the SHHS and the Framingham Offspring and Omni cohorts have been described.35,36 The study was approved by the Boston University Medical Center Institutional Review Board. Participants signed informed consent. The sample size was 900. Additional details are available in the supplemental material.
Measurements
The selected biomarkers involve various stages of the inflammatory process. They include acute phase reactants (CRP and fibrinogen), cytokines (IL-6, tumor necrosis factor-α [TNF-α], tumor necrosis factor receptor II [TNF-R2]) and selectins (CD40-ligand and P-selectin), ICAM1 and monocytes chemoattractant protein (MCP)-1. Biomarkers were measured in blood samples drawn in the morning following an overnight fast. The measurement methods and reliability have been reported.37 Participants underwent polysomnography using previously published methods, scoring guidelines, and quality assurance procedures.38,39 The high reliability of the apnea-hypopnea index (AHI) in the SHHS was reported.39,40
Statistical Analysis
The main predictor variable was the AHI, the standard measure of SDB severity. The hypoxemia index and the arousal index, two additional measures of SDB severity, were evaluated in secondary analyses. The dependent variables were the log-transformed biomarker levels; CRP and IL-6 were the primary biomarkers of interest. The biomarker levels were natural log-transformed due to their skewed distribution to achieve near-normality in the analysis. The results were back-transformed to facilitate interpretation in the categorical analysis.
We evaluated the association of SDB and markers of inflammation using multiple linear regressions (PROC REG and GLM in SAS version 9.1, SAS Institute Inc., Cary, NC). In the main analysis AHI and the hypoxemia index were treated as continuous variables. For purposes of presentation, we repeated the main analyses treating AHI and hypoxemia index as categorical variables. For AHI, we used the common clinical thresholds 5, 15, and 30 events per h to define categories; for hypoxemia index we chose the thresholds 0.5%, 5%, and 10% of sleep time to approximate the frequency distribution of AHI in this sample.
In the demographic model, we adjusted for age, race, and sex. In the multivariable model, we further adjusted for potential confounders, specifically systolic blood pressure, self-reported medications (aspirin, other nonsteroidal antiinflammatory drugs, oral and inhaled steroids, antihypertensive medication, and hormone replacement therapy), current smoking, prevalent CVD, diabetes, asthma, and chronic obstructive pulmonary disease. In the multivariable + body mass index (BMI) model, we also adjusted for adiposity, a likely confounder, as measured by BMI. To account for possible residual confounding by adiposity, the associations of IL-6 and SDB measures were further adjusted for waist circumference (available on 770 participants) in a secondary analysis.
Secondary analyses stratifying by age (above or below the median), sex, and BMI (above or below 30 kg/m2) were performed; formal tests of interaction were conducted by including the product of the SDB measure and the modifier variable. For the main analysis, two-sided P < 0.025 was considered statistically significant accounting for testing of two biomarkers of primary interest. Analysis of other biomarkers, or alternative measures of SDB, and stratified analyses of the two primary biomarkers were considered exploratory and a two-sided P < 0.05 was considered significant. Nine hundred participants and 14 covariates in the multivariable model provided 80% power to detect a correlation of 0.094 and 90% power to detect a correlation of 0.108 between inflammatory biomarkers and SDB measures.
RESULTS
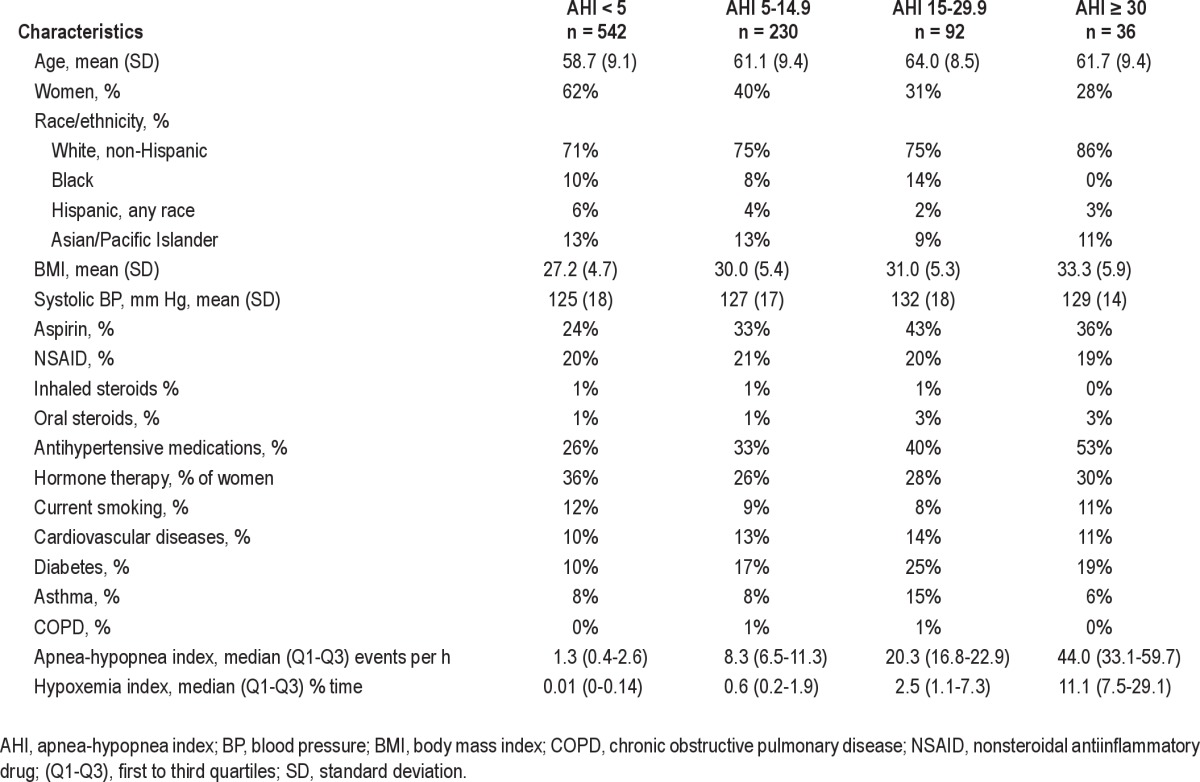
Characteristics of participants stratified by AHI categories are presented in Table 1. Sixty percent of study participants had AHI < 5. Participants with higher AHI had higher mean BMI and blood pressures, and were more likely to be men, white, have diabetes, and to report receiving antihypertensive therapy.
Table 1.
Characteristics of the study sample
In models adjusting only for demographics, AHI was associated with CRP, IL-6, fibrinogen, ICAM, and P-selectin but not with TNF-α, TNF-R2, CD40-ligand, or MCP-1 levels (Table S1, supplemental material). The magnitude of these associations was not meaningfully attenuated, and remained statistically significant, with adjustment for systolic blood pressure, self-reported medications (aspirin, other nonsteroidal antiinflamma-tory drugs, oral and inhaled steroids, antihypertensive therapy, and hormone replacement therapy), current smoking, cardiovascular disease, diabetes, asthma, and chronic obstructive pulmonary disease (multivariable model, Table S1). However, the associations were substantially attenuated, and remained statistically significant only for IL-6, after further adjustment for BMI (multivariable + BMI model, Table S1). The association of AHI with IL-6 was not further attenuated by additional adjustment for waist circumference. The findings were similar in analyses using the hypoxemia index (% time below an oxyhemoglobin saturation of 90%), as shown in Table S2. There was no association between CRP or IL-6 level and arousal index in any model (results not shown).
The adjusted mean values of CRP and IL-6 by category of SDB severity are shown in Figures 1 and 2, portraying the linear trend across categories of SDB severity and the effect of adjustment for BMI. Participants with AHI > 30 events per h had an adjusted mean IL-6 level 0.69 pg/mL or 0.35 standard deviation greater than participants with AHI < 5 events per h. Analyses stratifying by BMI above or below 30 kg/m2, by age above or below the median age of 59 y, or by sex showed no effect modification by these variables (see Tables S3, S4, and S5). Formal tests of interaction between SDB measures and these stratification variables were nonsignificant (P values for the interaction term = 0.99 for AHI*BMI, 0.90 for AHI*sex, and 0.46 for AHI*age).
Figure 1.
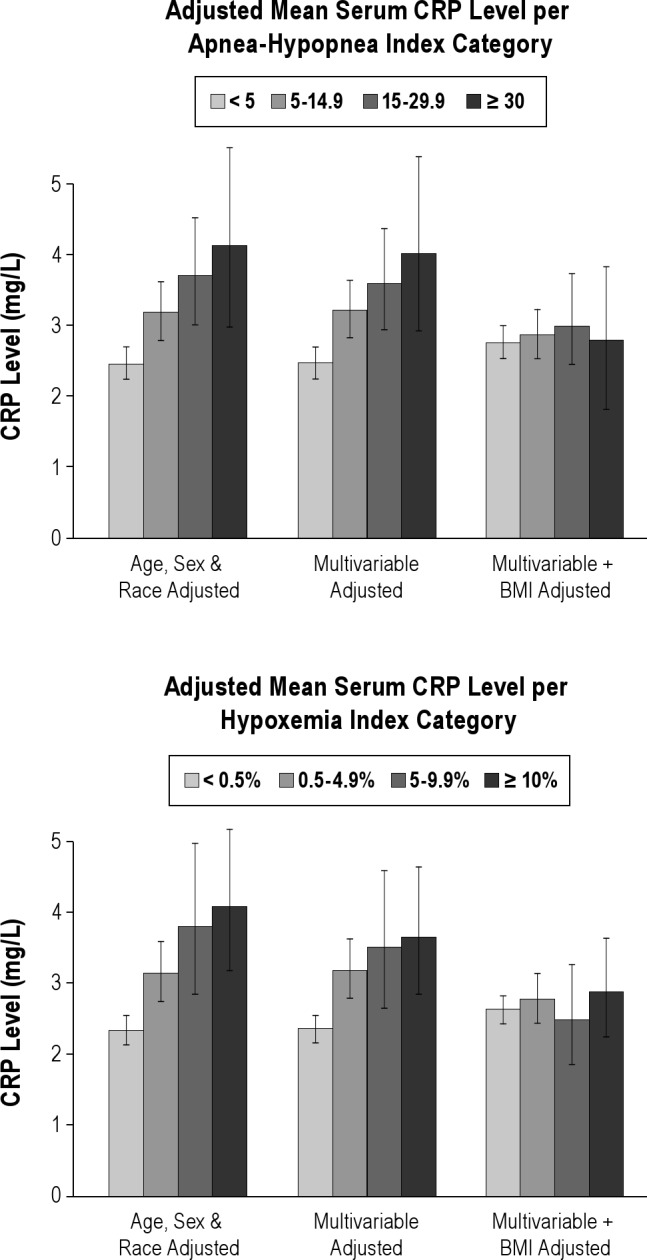
Association of sleep disordered breathing with C-reactive protein (CRP) level. BMI, body mass index.
Figure 2.
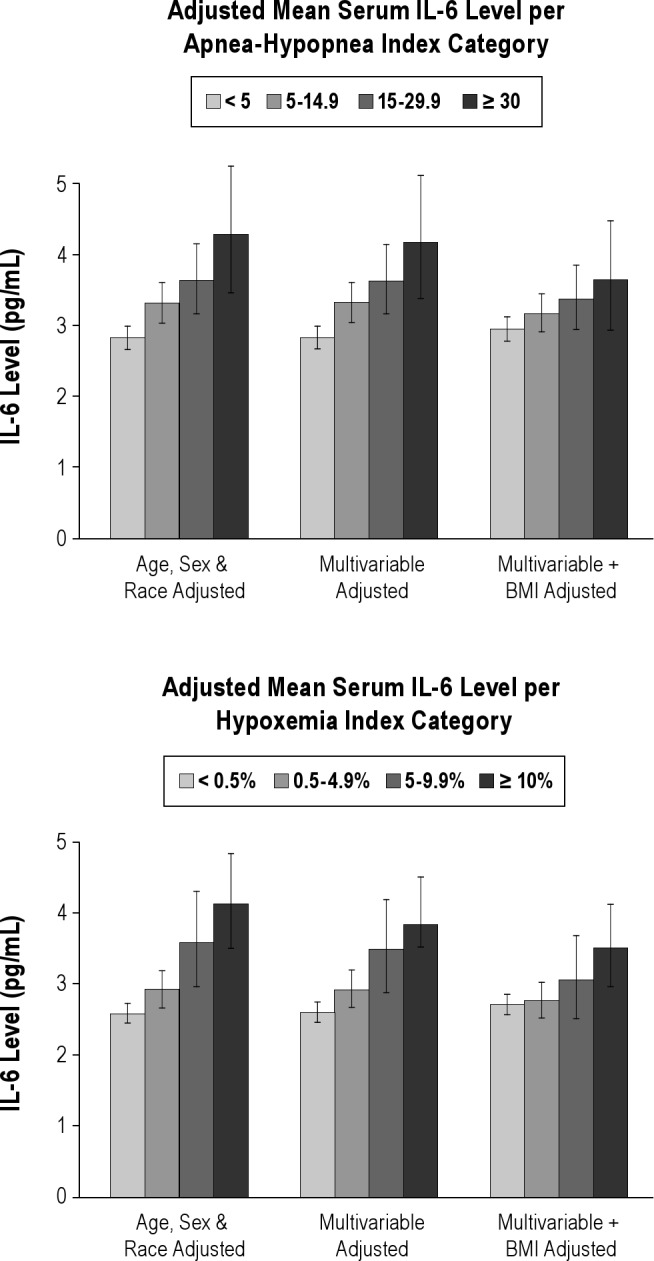
Association of sleep disordered breathing with interleukin-6 (IL-6) level. AHI, apnea-hypopnea index.
DISCUSSION
In a community-based cohort of middle-aged and older individuals, SDB, as measured by AHI or hypoxemia index, was associated with IL-6 levels after adjustment for a large number of potential confounders including two measures of adiposity. However, the observed associations of SDB with CRP, fibrinogen, ICAM, P-selectin, and CD40-ligand levels were highly attenuated and no longer significant after adjusting for adiposity. There was no association between SDB severity and levels of TNF-α, TNF-R2, and MCP-1. The magnitude of the association of SDB with IL-6 levels was moderate; participants with AHI > 30 events per h had an adjusted mean IL-6 level 0.35 standard deviation greater than participants with AHI < five events per h. The corresponding absolute difference in IL-6 level of 0.69 pg/mL is potentially of clinical importance, as a median IL-6 level of 1.81 pg/mL was previously reported in patients who developed myocardial infarction versus 1.46 pg/mL in patients who did not.19 A similar effect size was also reported in smokers who had a median IL-6 level of 2.23 pg/mL versus 1.58 pg/mL in nonsmokers.19
Previous studies that evaluated the association of SDB with markers of inflammation were generally clinic-based and thus more prone to selection bias than the current study, and most included few5–7,25,26 or no women.8–9,11,23,24 The current study evaluates the association of SDB and markers of inflammation in a community-based sample that was selected independent of the presence of symptoms and comorbidities of SDB and included a large number of women. One previous community-based study of more than 900 middle-aged adults also found that the association of CRP levels with SDB was explained by adiposity, with no significant association after adjustment for BMI,28 but did not evaluate other biomarkers of inflammation.
The finding of an association between SDB and IL-6 after adjusting for obesity and other potential confounders in a community-based sample is potentially important. IL-6 is a proinflammatory cytokine that has been implicated in the pathogenesis of atherosclerosis41 and predicts poor outcome in patients with unstable angina20 and increased risk of CVD in apparently healthy individuals.19 Previous studies have evaluated the association of SDB and IL-6 with conflicting results. Small case-control studies found higher serum levels of IL-6 in participants with obstructive sleep apnea than in normal or obese control patients.10,11 In one of these studies, IL-6 levels decreased after 1 mo of CPAP therapy,11 although a randomized clinical trial found no change in serum levels of IL-6 levels after 1 mo of CPAP.30 The largest previous study, including 385 adults, found no association between SDB severity and morning IL-6 levels, although in that study SDB was associated with soluble IL-6 receptor levels.29
SDB-induced chronic intermittent hypoxemia may contribute to the observed association of SDB with IL-6. Experimental intermittent hypoxemia induces nuclear factor kappa-B (NF-κB), an important inflammatory transcription factor known to bind to the promoter region of the IL-6 gene and induce IL-6 expression.42 Similarly, chronic partial sleep deprivation is associated with increased levels of IL-643; thus, sleep fragmentation from SDB is another potential mechanism linking SDB and IL-6 levels, although in this study the arousal index was not associated with IL-6 levels.
Obesity is a well-known cause of systemic inflammation. Indeed, in this study, confounding by adiposity explained most of the observed association of SDB with the inflammatory markers CRP, fibrinogen, ICAM, P-selectin, and CD40-ligand. Obesity is also associated with increased levels of IL-6, which is secreted by adipocytes as well as immune cells,44 and explains approximately half of the observed association of SDB with IL-6 in this study. Although the adjusted association between SDB and IL-6 could reflect residual confounding by adiposity not captured by adjustment for BMI, the lack of further attenuation of the association by adjustment for waist circumference argues against residual confounding.
Our study has several limitations. Although IL-6 was one of two markers identified a priori as being of greatest interest, and the statistically significant P value was adjusted for duplicate testing, the possibility of a type I statistical error must also be considered a possible explanation, given the significant adjusted association of SDB with IL-6 alone among the inflammatory markers assessed in this study. Indeed, TNF-α, which is also secreted by adipocytes and induces IL-6 secretion,45 was not associated with SDB in this analysis. Nor was CRP associated with SDB after adjustment for BMI, although IL-6 is one of the main triggers for CRP release by hepatocytes and the levels of the two markers are generally closely correlated. Furthermore, the cross-sectional design of our study does not allow drawing firm conclusions on the direction of association between levels of IL-6 and SDB; it is unlikely that elevated IL-6 levels could be implicated in the pathogenesis of SDB. Finally, the biomarker levels were measured in blood samples drawn a median of 789 days (range 314-1,883 days) after polysomnography was performed. This time difference raises concern about unmeasured factors influencing the inflammatory markers level. However, AHI is associated with levels of multiple biomarkers in models not adjusted for BMI and this association becomes nonsignificant after adjustment for BMI, which makes it unlikely that temporal difference is the cause of non-association in the adjusted models. Still, residual confounding by unmeasured covariates cannot be excluded in an observational study and causality cannot be proven. A randomized controlled trial evaluating the effect of treating SDB on IL-6 levels would provide superior evidence.
The strengths of the current study include the well-characterized, ethnically diverse, community-based cohort that provided excellent statistical power and allowed adjustments for a large number of potential confounders, and the assessment of SDB and inflammatory markers levels following strict protocols and rigorous quality control measures.37–40 No significant modification of the association of SDB with IL-6 by age, sex, or obesity was observed. Thus, in this community-based cohort, much of the association of SDB with markers of vascular inflammation appears to be explained by their shared association with adiposity. The association of SDB with IL-6, an important inflammatory cytokine and established marker of cardiovascular risk, does suggest the potential for inflammatory mechanisms linking SDB to increased cardiovascular risk. Yet, the inconsistent results of prior clinic-based studies and the narrow findings of the current study suggest that other mechanisms may mediate much of the cardiovascular risk of SDB in the general population.
DISCLOSURE STATEMENT
This was not an industry supported study. Dr. O'Connor served as a consultant for Sunovion, Inc. The other authors have indicated no financial conflicts of interest.
ACKNOWLEDGMENTS
The SHHS acknowledges the Atherosclerosis Risk in Communities Study, the Cardiovascular Health Study, the Framingham Heart Study, the Cornell Worksite and Hypertension Studies, the Strong Heart Study, the Tucson Epidemiology Study of Airways Obstructive Diseases, and the Tucson Health and Environment Study for allowing their cohort members to be part of the SHHS and for permitting data acquired by them to be used in the study. The SHHS is particularly grateful to the members of these cohorts who agreed to participate in SHHS as well. The SHHS further recognizes all of the investigators and staff who have contributed to its success. A list of SHHS investigators, staff, and their participating institutions is available on the SHHS Web site, http://www.jhucct.com/shhs.
ACKNOWLEDGMENTS
This study was supported by: N01-HC 25195; 1RO1 HL64753; R01 HL076784; 1 R01 AG028321; Sleep Heart Health Study National Heart, Lung, and Blood Institute cooperative agreements U01HL53940 (University of Washington), U01HL53941 (Boston University), U01HL53938 (University of Arizona), U01HL53916 (University of California, Davis),U01HL53934 (University of Minnesota), U01HL53931 (New York University), U01HL53937 and U01HL64360 (Johns Hopkins University),U01HL63463 (Case Western Reserve University), and U01HL63429 (Missouri Breaks Research); Lp-PLA2 activity measurements were provided by GlaxoSmithKline and mass measurements by diaDexus at no cost to the Framingham Heart Study.
SUPPLEMENTAL MATERIAL
SUPPLEMENTAL METHODS
Sample
The study sample is a subset of the Framingham Offspring/ Omni cohort participants who underwent polysomnography as part of the Sleep Heart Health Study (SHHS). The designs of the SHHS and the Framingham Offspring and Omni cohorts have been previously described,1,2 Briefly, the SHHS is a cohort of individuals 40 y or older recruited from participants in several ongoing cohort studies of cardiovascular and pulmonary diseases in the United States. Exclusion criteria were treatment of sleep disordered breathing with continuous positive airway pressure or an oral device, oxygen treatment at home, or having a tracheostomy. It includes 999 participants who were recruited from the Framingham Heart Study and underwent polysomnography between 1995 and 1998. Of those, 915 participants had available data on the main inflammatory biomarkers of interest, C-reactive protein (CRP) and interleukin-6, and were included in the main analysis. Fifteen participants were excluded for missing covariates data: history of asthma, chronic obstructive pulmonary disease, and hormone replacement therapy resulting in a sample size of 900 in the main analysis. Secondary analyses included participants with available data on the remaining inflammatory biomarkers: P-selectin and CD40-ligand (n = 900), intercellular adhesion molecule-1 (ICAM1, n = 899), monocyte chemoattractant protein-1 (MCP-1, n = 886), tumor necrosis factor receptor-II (TNF-R2, n = 866), fibrinogen (n = 899), and tumor necrosis factor-α (TNF-α, n = 532). The study was approved by the Boston University Medical Center Institutional Review Board. Participants signed informed consent.
Biomarkers
The selected biomarkers involve various stages of the inflammatory process. They include acute phase reactants (CRP and fibrinogen), cytokines (interleukin-6, TNF-α, TNF-R2) and selectins (CD40-ligand and P-selectin), ICAM1, and MCP-1. Biomarkers were measured in blood samples drawn in the morning following an overnight fast. The measurement methods have been reported.3 The mean intra-assay coefficients of variation were < 10% for all inflammatory biomarkers.
Polysomnography
Participants underwent in-home polysomnography using the Compumedics P-series portable monitor (Abbotsford, Victoria, Australia). The polysomnography recordings included electroencephalogram, electrooculogram, electrocardiogram, chin electromyogram, pulse oximetry, chest and abdominal excursion, airflow (by thermocouple), and body position. The polysomnography recordings were analyzed and scored centrally at the SHHS reading center (Cleveland, OH, USA) following previously published scoring guidelines and quality assurance procedures.4,5 As reported previously, the intraclass correlation coefficient of the apnea-hypopnea index (AHI) in the SHHS was > 0.9 for interscorer reliability5 and 0.8 for night-to-night variability.6
The AHI was defined as the number of apneas plus hypopneas per h of sleep, where apnea was defined as a decrease in airflow amplitude to < 25% of baseline lasting for at least 10 sec; hypopnea was defined as a decrease in airflow or chest wall movement amplitude to less than 70% of baseline lasting for at least 10 sec, with both apneas and hypopneas requiring an associated 4% oxyhemoglobin desaturation. The hypoxemia index was defined as the percent of sleep time with oxyhemoglobin saturation less than 90%. The arousal index was defined as the number of electroencephalography arousals per h of sleep.
Regressions of inflammatory markers (log transformed levels) on apnea-hypopnea indexa
Regressions of inflammatory markers (log-adjusted levels) on hypoxemia index
Regression of interleukin-6 (log transformed levels) on apnea-hypopnea index (10 units) stratified by body mass index above or below 30 kg/m2a
Regression of interleukin-6 (log transformed levels) on apnea-hypopnea index (10 units) stratified by median age (59 y)a
Regression of interleukin-6 (log transformed levels) on apnea-hypopnea index (10 units) stratified by sexa
SUPPLEMENTAL REFERENCES
- 1.Quan SF, Howard BV, Iber C, et al. The Sleep Heart Health Study: design, rationale, and methods. Sleep. 1997;20:1077–85. [PubMed] [Google Scholar]
- 2.Kannel WB, Feinleib M, McNamara PM, Garrison RJ, Castelli WP. An investigation of coronary heart disease in families. The Framingham off-spring study. Am J Epidemiol. 1979;110:281–90. doi: 10.1093/oxfordjournals.aje.a112813. [DOI] [PubMed] [Google Scholar]
- 3.Schnabel R, Larson MG, Dupuis J, et al. Relations of inflammatory bio-markers and common genetic variants with arterial stiffness and wave reflection. Hypertension. 2008;51:1651–7. doi: 10.1161/HYPERTENSIONAHA.107.105668. [DOI] [PMC free article] [PubMed] [Google Scholar]
- 4.Whitney CW, Gottlieb DJ, Redline S, et al. Reliability of scoring respiratory disturbance indices and sleep staging. Sleep. 1998;21:749–57. doi: 10.1093/sleep/21.7.749. [DOI] [PubMed] [Google Scholar]
- 5.Redline S, Sanders MH, Lind BK, et al. Methods for obtaining and analyzing unattended polysomnography data for a multicenter study. Sleep Heart Health Research Group. Sleep. 1998;21:759–67. [PubMed] [Google Scholar]
- 6.Quan SF, Griswold ME, Iber C, et al. Short-term variability of respiration and sleep during unattended nonlaboratory polysomnogaphy--The Sleep Heart Health Study. Sleep. 2002;25:843–9. [PubMed] [Google Scholar]
REFERENCES
- 1.Peppard PE, Young T, Palta M, Skatrud J. Prospective study of the association between sleep-disordered breathing and hypertension. N Engl J Med. 2000;342:1378–84. doi: 10.1056/NEJM200005113421901. [DOI] [PubMed] [Google Scholar]
- 2.Shahar E, Whitney CW, Redline S, et al. Sleep-disordered breathing and cardiovascular disease: cross-sectional results of the Sleep Heat Health Study. Am J Respir Crit Care Med. 2001;163:19–25. doi: 10.1164/ajrccm.163.1.2001008. [DOI] [PubMed] [Google Scholar]
- 3.Tauman R, Ivanenko A, O'Brien LM, Gozal D. Plasma C-reactive protein levels among children with sleep-disordered breathing. Pediatrics. 2004;113:e564–9. doi: 10.1542/peds.113.6.e564. [DOI] [PubMed] [Google Scholar]
- 4.Larkin EK, Rosen CL, Kirchner HL, et al. Variation of C-reactive protein levels in adolescents: association with sleep-disordered breathing and sleep duration. Circulation. 2005;111:1978–84. doi: 10.1161/01.CIR.0000161819.76138.5E. [DOI] [PubMed] [Google Scholar]
- 5.Shamsuzzaman AS, Winnicki M, Lanfranchi P, et al. Elevated C-reactive protein in patients with obstructive sleep apnea. Circulation. 2002;105:2462–4. doi: 10.1161/01.cir.0000018948.95175.03. [DOI] [PubMed] [Google Scholar]
- 6.Teramoto S, Yamamoto H, Ouchi Y. Increased C-reactive protein and increased plasma interleukin-6 may synergistically affect the progression of coronary atherosclerosis in obstructive sleep apnea syndrome. Circulation. 2003;107:E40–0. doi: 10.1161/01.cir.0000053956.46188.5f. [DOI] [PubMed] [Google Scholar]
- 7.Zouaoui BK, Van Meerhaeghe A, Doumit S, et al. Sleep apnoeahypopnoea index is an independent predictor of high-sensitivity C-reactive protein elevation. Respiration. 2006;73:243–6. doi: 10.1159/000090201. [DOI] [PubMed] [Google Scholar]
- 8.Minoguchi K, Yokoe T, Tazaki T, et al. Increased carotid intima-media thickness and serum inflammatory markers in obstructive sleep apnea. Am J Respir Crit Care Med. 2005;172:625–30. doi: 10.1164/rccm.200412-1652OC. [DOI] [PubMed] [Google Scholar]
- 9.Punjabi N, Beamer B. C-reactive protein is associated with sleep disordered breathing independent of adiposity. Sleep. 2007;30:29–34. doi: 10.1093/sleep/30.1.29. [DOI] [PMC free article] [PubMed] [Google Scholar]
- 10.Vgontzas AN, Papanicolaou DA, Bixler EO, Kales A, Tyson K, Chrousos GP. Elevation of plasma cytokines in disorders of excessive daytime sleepiness: role of sleep disturbance and obesity. J Clin Endocrinol Metab. 1997;82:1313–6. doi: 10.1210/jcem.82.5.3950. [DOI] [PubMed] [Google Scholar]
- 11.Yokoe T, Minoguchi K, Matsuo H, et al. Elevated levels of C-reactive protein and interleukin-6 in patients with obstructive sleep apnea syndrome are decreased by nasal continuous positive airway pressure. Circulation. 2003;107:1129–34. doi: 10.1161/01.cir.0000052627.99976.18. [DOI] [PubMed] [Google Scholar]
- 12.Ross R. Atherosclerosis: an inflammatory disease. N Engl J Med. 1999;340:15–26. doi: 10.1056/NEJM199901143400207. [DOI] [PubMed] [Google Scholar]
- 13.Alexander RW. Inflammation and coronary artery disease. N Engl J Med. 1994;331:468–9. doi: 10.1056/NEJM199408183310709. [DOI] [PubMed] [Google Scholar]
- 14.Reynolds GD, Vance RP. C-reactive protein immunohistochemical localization in normal and atherosclerotic human aortas. Arch Pathol Lab Med. 1987;111:265–9. [PubMed] [Google Scholar]
- 15.Poston RN, Haskkard DO, Coucher HR, Gall NP, Johnson-Tidey RR. Expression of intercellular adhesion molecule-1 in atherosclerotic plaques. Am J Pathol. 1992;140:665–73. [PMC free article] [PubMed] [Google Scholar]
- 16.Nelken NA, Coughlin SR, Gordon D, Wilcox JN. Monocyte chemoattractant protein-1 in human atheromatous plaques. J Clin Invest. 1991;88:1121–7. doi: 10.1172/JCI115411. [DOI] [PMC free article] [PubMed] [Google Scholar]
- 17.Tracy RP, Lemaitre RN, Psaty BM, et al. Relationship of C-reactive protein to risk of cardiovascular disease in the elderly: results from the Cardiovascular Health Study and the Rural Health Promotion Project. Arterioscler Thromb Vasc Biol. 1997;17:1121–7. doi: 10.1161/01.atv.17.6.1121. [DOI] [PubMed] [Google Scholar]
- 18.Ridker PM, Hennekens CH, Buring JE, Rifai N. C-reactive protein and other markers of inflammation in the prediction of cardiovascular disease in women. N Engl J Med. 2000;342:836–43. doi: 10.1056/NEJM200003233421202. [DOI] [PubMed] [Google Scholar]
- 19.Ridker PM, Rifai N, Stampfer MJ, Hennekens CH. Plasma concentration of interleukin-6 and the risk of future myocardial infarction among apparently healthy men. Circulation. 2000;101:1767–72. doi: 10.1161/01.cir.101.15.1767. [DOI] [PubMed] [Google Scholar]
- 20.Koukkunen H, Penttila K, Kemppainen A, et al. C-reactive protein, fibrinogen, interleukin-6 and tumor necrosis factor-alpha in the prognostic classification of unstable angina pectoris. Ann Med. 2001;33:37–47. doi: 10.3109/07853890109002058. [DOI] [PubMed] [Google Scholar]
- 21.Harris TB, Ferrucci L, Tracy RP, et al. Associations of elevated interleukin-6 and C-reactive protein levels with mortality in the elderly. Am J Med. 1999;106:506–12. doi: 10.1016/s0002-9343(99)00066-2. [DOI] [PubMed] [Google Scholar]
- 22.Kaditis AG, Alexopoulos EI, Kalampouka E, et al. Morning levels of C-reactive protein in children with obstructive sleep-disordered breathing. Am J Respir Crit Care Med. 2005;171:282–6. doi: 10.1164/rccm.200407-928OC. [DOI] [PubMed] [Google Scholar]
- 23.Barcelo A, Barbe F, Llompart E, et al. Effects of obesity on C-reactive protein level and metabolic disturbances in male patients with obstructive sleep apnea. Am J Med. 2004;117:118–21. doi: 10.1016/j.amjmed.2004.01.025. [DOI] [PubMed] [Google Scholar]
- 24.Can M, Acikgoz S, Mungan G, et al. Serum cardiovascular risk factors in obstructive sleep apnea. Chest. 2006;129:233–7. doi: 10.1378/chest.129.2.233. [DOI] [PubMed] [Google Scholar]
- 25.Guilleminault C, Kirisoglu C, Ohayon MM. C-reactive protein and sleep-disordered breathing. Sleep. 2004;27:1507–11. doi: 10.1093/sleep/27.8.1507. [DOI] [PubMed] [Google Scholar]
- 26.Akashiba T, Akahoshi T, Kawahara S, Majima T, Horie T. Effects of long-term nasal continuous positive airway pressure on C-reactive protein in patients with obstructive sleep apnea syndrome. Intern Med. 2005;44:899–900. doi: 10.2169/internalmedicine.44.899. [DOI] [PubMed] [Google Scholar]
- 27.Saletu M, Nosiska D, Kapfhammer G, et al. Structural and serum surrogate markers of cerebrovascular disease in obstructive sleep apnea (OSA): association of mild OSA with early atherosclerosis. J Neurol. 2006;253:746–52. doi: 10.1007/s00415-006-0110-6. [DOI] [PubMed] [Google Scholar]
- 28.Taheri S, Austin D, Lin L, Nieto J, Young T, Mignot E. Correlates of serum C-reactive protein (CRP)--no association with sleep duration or sleep disordered breathing. Sleep. 2007;30:991–6. doi: 10.1093/sleep/30.8.991. [DOI] [PMC free article] [PubMed] [Google Scholar]
- 29.Mehra R, Storfer-Isser A, Kirchner L, et al. Soluble interleukin 6 receptor: a novel marker of moderate to severe sleep-related breathing disorder. Arch Intern Med. 2006;166:1725–31. doi: 10.1001/archinte.166.16.1725. [DOI] [PubMed] [Google Scholar]
- 30.Kohler M, Ayers L, Pepperell JCT, et al. Effects of continuous positive airway pressure on systemic inflammation in patients with moderate to severe obstructive sleep apnoea: a randomised controlled trial. Thorax. 2009;64:67–73. doi: 10.1136/thx.2008.097931. [DOI] [PubMed] [Google Scholar]
- 31.Drager LF, Bortolotto LA, Figueiredo AC, et al. Effects of continuous positive airway pressure on early signs of atherosclerosis in obstructive sleep apnea. Am J Respir Crit Care Med. 2007;176:706–12. doi: 10.1164/rccm.200703-500OC. [DOI] [PubMed] [Google Scholar]
- 32.Ohga E, Nagase T, Tomita T, et al. Increased levels of circulating ICAM-1, VCAM-1, and L-selectin in obstructive sleep apnea syndrome. J Appl Physiol. 1999;87:10–4. doi: 10.1152/jappl.1999.87.1.10. [DOI] [PubMed] [Google Scholar]
- 33.O'Brien LM, Serpero LD, Tauman R, Gozal D. Plasma adhesion molecules in children with sleep-disordered breathing. Chest. 2006;129:947–53. doi: 10.1378/chest.129.4.947. [DOI] [PubMed] [Google Scholar]
- 34.Akinnusi ME, Paasch LL, Szarpa KR, Wallace PK, El Solh AA. Impact of nasal continuous positive airway pressure therapy on markers of platelet activation in patients with obstructive sleep apnea. Respiration. 2009;77:18–20. doi: 10.1159/000158488. [DOI] [PubMed] [Google Scholar]
- 35.Quan SF, Howard BV, Iber C, et al. The Sleep Heart Health Study: design, rationale, and methods. Sleep. 1997;20:1077–85. [PubMed] [Google Scholar]
- 36.Kannel WB, Feinleib M, McNamara PM, Garrison RJ, Castelli WP. An investigation of coronary heart disease in families. The Framingham off-spring study. Am J Epidemiol. 1979;110:281–90. doi: 10.1093/oxfordjournals.aje.a112813. [DOI] [PubMed] [Google Scholar]
- 37.Schnabel R, Larson MG, Dupuis J, et al. Relations of inflammatory bio-markers and common genetic variants with arterial stiffness and wave reflection. Hypertension. 2008;51:1651–7. doi: 10.1161/HYPERTENSIONAHA.107.105668. [DOI] [PMC free article] [PubMed] [Google Scholar]
- 38.Whitney CW, Gottlieb DJ, Redline S, et al. Reliability of scoring respiratory disturbance indices and sleep staging. Sleep. 1998;21:749–57. doi: 10.1093/sleep/21.7.749. [DOI] [PubMed] [Google Scholar]
- 39.Redline S, Sanders MH, Lind BK, et al. Methods for obtaining and analyzing unattended polysomnography data for a multicenter study. Sleep Heart Health Research Group. Sleep. 1998;21:759–67. [PubMed] [Google Scholar]
- 40.Quan SF, Griswold ME, Iber C, et al. Short-term variability of respiration and sleep during unattended nonlaboratory polysomnography--The Sleep Heart Health Study. Sleep. 2002;25:843–49. [PubMed] [Google Scholar]
- 41.Yudkin JS, Kumari M, Humphries SE, et al. Inflammation, obesity, stress and coronary heart disease: is interleukin-6 the link? Atherosclerosis. 2000;148:209–14. doi: 10.1016/s0021-9150(99)00463-3. [DOI] [PubMed] [Google Scholar]
- 42.Greenberg H, Ye X, Wilson D, Htoo AK, Hendersen T, Liu SF. Chronic intermittent hypoxia activates nuclear factor-kappa-B in cardiovascular tissues in vivo. Biochem Biophys Res Commun. 2006;343:591–6. doi: 10.1016/j.bbrc.2006.03.015. [DOI] [PubMed] [Google Scholar]
- 43.Vgontaz AN, Zoumakis E, Bixler EO, et al. Adverse effects of modest sleep deprivation on sleepiness performance and inflammatory cytokines. J Clin Endocrinol Metab. 2004;89:2119–26. doi: 10.1210/jc.2003-031562. [DOI] [PubMed] [Google Scholar]
- 44.Rotter V, Nagaev I, Smith U. Interleukin-6 (IL-6) induces insulin resistance in 3T3-L1 adipocytes and is, like IL-8 and tumor necrosis factor-alpha, overexpressed in human fat cells from insulin-resistant subjects. J Biol Chem. 2003;278:45777–84. doi: 10.1074/jbc.M301977200. [DOI] [PubMed] [Google Scholar]
Associated Data
This section collects any data citations, data availability statements, or supplementary materials included in this article.
Supplementary Materials
Regressions of inflammatory markers (log transformed levels) on apnea-hypopnea indexa
Regressions of inflammatory markers (log-adjusted levels) on hypoxemia index
Regression of interleukin-6 (log transformed levels) on apnea-hypopnea index (10 units) stratified by body mass index above or below 30 kg/m2a
Regression of interleukin-6 (log transformed levels) on apnea-hypopnea index (10 units) stratified by median age (59 y)a
Regression of interleukin-6 (log transformed levels) on apnea-hypopnea index (10 units) stratified by sexa