

Abstract
Re‐entrant modulation of visual cortex has been suggested as a critical process for enhancing perception of emotionally arousing visual stimuli. This study explores how the time information inherent in large‐scale electrocortical measures can be used to examine the functional relationships among the structures involved in emotional perception. Granger causality analysis was conducted on steady‐state visual evoked potentials elicited by emotionally arousing pictures flickering at a rate of 10 Hz. This procedure allows one to examine the direction of neural connections. Participants viewed pictures that varied in emotional content, depicting people in neutral contexts, erotica, or interpersonal attack scenes. Results demonstrated increased coupling between visual and cortical areas when viewing emotionally arousing content. Specifically, intraparietal to inferotemporal and precuneus to calcarine connections were stronger for emotionally arousing picture content. Thus, we provide evidence for re‐entrant signal flow during emotional perception, which originates from higher tiers and enters lower tiers of visual cortex. Hum Brain Mapp, 2009. © 2007 Wiley‐Liss, Inc.
Keywords: affective arousal, electroencephalography, emotion, Granger causality, steady‐state potentials
INTRODUCTION
Studies of emotional perception suggest that visual cortical processing is facilitated specifically for features indicating motivational relevance [Bradley et al., 2003; Vuilleumier, 2005]. The effects of such prioritized processing can be measured on a behavioral [Öhman et al., 2001], physiological [Lang et al., 1997], and electrocortical level [Cuthbert et al., 2000; Mini et al., 1996]; however, the specific neural mechanisms that underlie this specific facilitation remain unclear. One hypothesis suggests that facilitation of visual perception and attention to emotionally arousing stimuli is effected through afferent modulation of occipital cortex by anterior cortical and subcortical structures [Lang et al., 1997]. In particular, the amygdaloid complex and parietofrontal cortex have been suggested as potential origins of re‐entrant modulation [Baizer et al., 1993; Iwai and Yukie, 1987]. Consistent with concepts of selective attention research [Martinez et al., 1999], re‐entrant signals entering visual areas may thus tune visual cortical neurons, altering thresholds or enhancing gain in the networks representing the relevant features [Vuilleumier and Driver, 2007].
In line with a re‐entrant hypothesis, hemodynamic measures have provided evidence for coactivation of temporal and occipital structures when human observers viewed emotional faces or scenes [e.g., Pessoa et al., 2002; Sabatinelli et al., 2004]. Covariation of activation in the amygaloid complex and visual cortex has been reported for picture categories that vary in emotional content [Sabatinelli et al., 2005]. Complementing hemodynamic measures and providing near‐optimum time resolution of large‐scale electrocortical processes, event‐related potentials (ERPs) measured during affective picture viewing have also shown amplitude enhancement as a function of emotional picture content [Cuthbert et al., 2000], both in early [Pizzagalli et al., 2003; Schupp et al., 2003] and late [300 ms; Cuthbert et al., 2000] time segments. Distributed source estimation has suggested that ERP effects are generated in occipital and temporal cortex, as well as in right‐hemispheric parietal areas [Keil et al., 2002; Sabatinelli et al., 2007]. Here we explore whether the time information inherent in large‐scale electrocortical measures can be used to examine the functional interrelationships among the structures involved in emotional perception. Although most parts of the cerebral cortex are massively interconnected, here we were specifically interested in identifying coupled regions of the visual cortex that may show re‐entrant or feedback characteristics with other structures, as suggested by prior work.
The present study recorded the steady‐state visual evoked potential [ssVEP, Regan, 1989] as a measure of electrocortical activity in visual cortex. The ssVEP is an oscillatory brain response elicited by a flashing visual stimulus by periodically modulating its luminance at a fixed rate of 6–8 s−1 or greater. It has been used to investigate attentional and perceptual processes in human vision [Müller et al., 1998, 2003; Srinivasan et al., 1999]. Importantly, it has repeatedly been observed that the ssVEP amplitude is enhanced when viewing flickering picture stimuli rated as being emotionally arousing. Presenting pleasant, neutral, and unpleasant pictures from the international affective picture system [IAPS; Lang et al., 2005] at a rate of 10 Hz, Keil et al. [2003] found higher ssVEP amplitude and accelerated phase for arousing, compared with calm pictures. These differences were most pronounced at central posterior as well as right parietotemporal recording sites. In another study, the steady‐state visual evoked magnetic field, which is the magnetocortical counterpart of the ssVEP, also varied as a function of emotional arousal [Moratti et al., 2004].
Source estimation procedures indicated involvement of parietofrontal attention networks in activating and directing attentional resources toward motivationally relevant stimuli [Moratti et al., 2004]. In line with this notion, Kemp and collaborators found amplitude reduction for ssVEPs elicited by flickering full field stimulation, when concurrently presented picture stimuli were emotionally engaging as opposed to having neutral content [Kemp et al., 2002, 2004]. This opposite pattern is consistent with the results reported earlier, as the full field flicker represents a concurrent stimulus that competes for resources with the affective pictures. In a series of studies capitalizing on classical conditioning designs, Moratti and Keil [2005] showed enhancement of ssVEP amplitude to stimuli, predicting aversive events after a small number of learning trials. This pattern of results was replicated in a second study in which all subjects were fully aware of the contingencies, reducing the variability due to attention to the fear signal [Moratti et al., 2006]. In line with observations made in affective picture viewing, processing of conditioned fear stimuli activated frontal, parietal, and occipital cortical areas. Given the oscillatory nature of ssVEPs, this suggests coactivation in a common network, with structures interacting in a massively parallel manner. Previous work suggests that this network largely overlaps with structures also involved in the allocation of selective attention. The nature of large‐scale interactions and the direction of effective connections mediating attentional resource allocation to affective stimuli remain unclear however.
Here, we exploited the fact that ssVEP time series can be stationary for a significant period of time. This property of the signal allowed us to apply time‐domain Granger causality analysis across epochs of multiple seconds of picture viewing. In the framework of Granger causality, one measured process is said to be causal to a second if the predictability of the second process at a given time point is improved by including measures from the history of the first process. Granger‐based algorithms in the time and frequency domains have been used to study neural connectivity in experimental animals [Bernasconi and Konig, 1999; Brovelli et al., 2004] as well as in humans [Schlögl and Supp, 2006]. Using dense‐array electroencephalogram (EEG) together with regional source analysis, we expected that directed, re‐entrant connectivity in the extended visual cortex (including occipital, temporal, and parietal cortices) would be more pronounced when participants view emotionally arousing, when compared with neutral, visual scenes.
MATERIALS AND METHODS
Participants
Sixteen volunteers (8 females, 8 males, mean age 23.5 years) gave written informed consent to participate in the study. All participants had normal or corrected‐to‐normal vision and no family history of photic epilepsy. One additional participant was excluded due to covariance nonstationarity (see later). Participants received class credit or were paid 10 euros (∼13 USD) for their time.
Stimuli
Thirty colored pictures from the IAPS [Lang et al., 2005] were used as stimuli. Picture stimuli were selected based on previous work showing reliable amplitude and phase modulations of the ssVEP as well as normative ratings and physiological differences in response to their specific content [Keil et al., 2003; Moratti et al., 2004]. Affective content was manipulated by presenting 10 images each of erotic couples, neutral people, and human attack scenes. The average luminance, contrast, and color spectrum were determined across each picture using a luminance‐meter and digital image processing software (MATLAB 5.2). The open source software tool Gimp 2.2 was used to adjust mean luminance as well as mean red, green, and blue values, such that there were no systematic differences between the three picture categories. Mean luminance of pictures as measured in the experimental chamber was kept between 12.0 and 24.5 cd/m2. Likewise, luminance of picture centers was kept between 13.0 and 26.0 cd/m2.
The pictures were presented in a pseudorandom order on a 21″ monitor with a vertical refresh rate of 60 Hz, subtending a visual angle of 8.4° both horizontally and vertically. A fixation point was marked in the center of the screen and was present throughout the experiment. During each trial, a picture was presented in a 10‐Hz flickering mode (the picture being shown for 50 ms, followed by 50 ms black screen) for a period of 6,000 ms, thus containing 60 on/off cycles. The intertrial interval varied between 8 and 12 s.
Procedure and Design
Upon arriving at the laboratory, each participant completed an informed consent form and was given examples of pictures that were not part of the experimental set. After application of the electrode net, the experimental session started with the presentation of 30 flickering stimuli in one of three pseudorandomized orders. The participant was instructed to view the pictures attentively, to maintain gaze on the central fixation spot, and to avoid blinks and eye movements during picture presentation. Randomization was constrained such that more than three pictures from the same affective category did not occur. After the first block, a second block of the same 30 pictures in an alternate order was run. Subsequently, the sensor net was removed and the subjects viewed the pictures a third time, during which the picture was rated for pleasure and emotional arousal using the Self‐Assessment Manikin self‐report scale [Lang, 1980]. Self‐report data were averaged across pictures according to content, resulting in three values for each participant and scale (pleasure, arousal). These were statistically evaluated by means of repeated measures ANOVA with one within factor of content (erotica, neutral people, attack). The anticipated differences were modeled using contrast analyses (linear contrast for pleasure: erotica > neutral people > attack; quadratic contrast for arousal: erotica = attack > neutral people).
EEG Recordings and Data Analysis
EEG was recorded from 129 electrodes using an Electrical Geodesics™ electrode net. Data were sampled at a rate of 250 Hz, using an online band‐pass filter ranging from 0.1 to 100 Hz. Eye movements and blinks were controlled by visually inspecting the vertical and horizontal electrooculogram as computed from a subset of net electrodes. Artifact rejection was performed offline, following the procedure proposed by Junghöfer et al. [2000]. This procedure uses the distribution of mean voltage, variability of voltage, and temporal voltage gradients to detect individual recording channel artifacts, global artifacts, and to replace sensors contaminated with artifacts using a statistically weighted spherical spline interpolation. The maximum number of approximated channels was set to 20, resulting in an overall rejection rate of 14% of trials. Epochs of 500‐ms prestimulus and 7,000‐ms poststimulus onset were obtained. Artifact‐free epochs were averaged separately for the three affective categories, and a 200‐ms prestimulus data segment was subtracted as baseline. To eliminate effects of initial ERPs to stimulus train onset, a time period of 1,000–6,000 ms after train onset was used for all subsequent analyses. After averaging, data were downsampled to 125 Hz, resulting in data matrices of 129 electrode channels by 625 points, which were submitted to source space projection. Figure 1 shows the grand average of the ssVEP data for the three picture contents and a subset of tree electrode sites.
Figure 1.
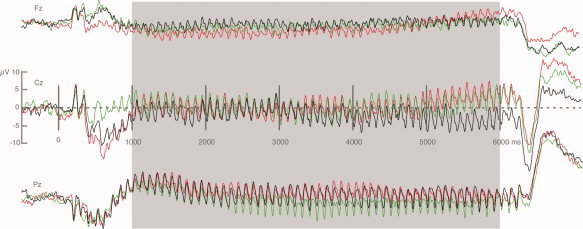
Grand mean (n = 16) waveforms of the ssVEP time series, shown for 3 out of 120 electrodes (Fz, Cz, Pz) of the sensor array, for the three picture contents. The time segment (1,000–6,000 ms after onset of the stimulus train) used for Granger analysis is highlighted in gray. Red lines: erotica; green lines: neutral people; black lines: attack.
Regional Source Representation of the ssVEP Time Series
To specifically highlight the temporal dynamics within and across different regions of extended visual system, we applied a model of discrete regional sources to the voltage time series. Regional sources do not aim to provide precise neuroanatomic localization, but represent the multielectrode ERP data in an anatomically representative low‐dimensional space. This overcomes some of the limitations associated with using voltage maps, such as interpretation of positive and negative voltage maxima when generators are oriented tangentially in relation to the skull. As an important advantage, it is possible to interpret source current amplitude enhancement as an increase in brain electric activity. Because of this high sensitivity, it is critical to ensure that electric currents originating far from a given regional source do not contribute to its source waveform. Here, we used source sensitivity maps implemented in the BESA™ software to track whether the sensitivity of the modeled sources was sufficiently restricted to local current changes. To calculate source sensitivity, the software models unit brain activity at different locations throughout the brain, with source sensitivity defined as the fraction of power that is mapped on the selected source, given a chosen head model and regularization constant [Scherg et al., 2002].
To represent brain activity during stimulus presentation, we seeded 13 symmetric sources in a four‐shell ellipsoidal head model [Berg and Scherg, 1994]. Positioning of regional dipoles drew on recent functional imaging work on visual processing when viewing affective pictures [Sabatinelli et al., 2007]. In particular, we aimed to achieve good coverage and spatial specificity along the temporal and parietal visual pathways. The source montage used here is illustrated in Figure 2. In addition to a midline posterior occipital source (in the region of calcarine fissure), two bilateral sources were seeded in the temporal cortices in the region of inferotemporal cortex and temporal pole. The model also included bilateral sources close to intraparietal sulcus, precuneus, frontocentral premotor cortex, and prefrontal cortex, in an attempt to account for activity outside the ventral visual system and to restrict the sensitivity of each source to a specific brain region. All sources (save for the single midline occipital) were bilateral and equidistant to the midline. Talairach coordinates of the regional dipoles and proximate cortical structures are listed in Table I.
Figure 2.
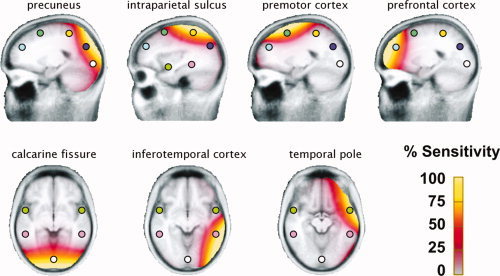
Source sensitivity maps for the 13 discrete regional sources used to model the ssVEP time series. The sensitivity maps show areas for which a given source is sensitive, with bright yellow indicating the greatest sensitivity, and gray the least sensitivity. Thus, a given source will be particularly sensitive to currents generated in areas shown in yellow and will not be sensitive to areas shown in gray.
Table I.
Talairach coordinates of the regional sources used to model ssVEP data
| Proximate cortical region | x | y | z |
|---|---|---|---|
| Calcarine fissure | 0 | −85 | −3 |
| Precuneus | ±20 | −72 | 28 |
| Intraparietal sulcus | ±33 | −42 | 53 |
| Inferotemporal cortex | ±51 | −39 | −6 |
| Temporal pole | ±51 | 4 | −10 |
| Frontal eye fields, premotor cortex | ±20 | 11 | 53 |
| Prefrontal cortex | ±20 | 45 | 27 |
Coordinates refer to sources in the left hemisphere. Right hemispheric sources were seeded symmetrically to the left sources, thus differing only on the x‐dimension, with y and z coordinates being identical. In addition to the six bilateral symmetric sources, the model included one midline occipital source to capture activity of lower‐level visual cortices.
Connectivity Analysis
Functional connectivity was based on Granger's causality analysis [Granger, 1969], which holds that a process A may “Granger cause” another process B, if information about the past of A helps to predict the time series B, better than knowing the past of B alone [cf., Seth, 2005]. This technique is the basis of several algorithms designed for the analysis of neural connectivity based on autoregressive models [Schlögl and Supp, 2006]. Most of these algorithms have been applied to frequency‐domain representations of electrocortical brain data [Baccala and Sameshima, 2001; Brovelli et al., 2004]. In the present case, we use the time‐domain approach proposed by Seth [Seth, 2005], as the comparatively long duration and stationary covariance (reflecting a sustained process) of the steady‐state evoked potential fits well with the assumptions of Granger technique. We followed the steps suggested by Seth [Seth, 2005], employing an approach similar to Brovelli et al. [2004]. All analyses were executed on source‐space‐projected ssVEP time series, i.e. on the traces at each model source, extending between 1,000 and 6,000 ms following the onset of the stimulus train.
First, we removed the mean from the ssVEP time series in source space. This standardization step served to maximize statistical covariance stationarity for all participants and conditions, and reduced the model order (see later) necessary for the multivariate (vector) autoregressive (MVAR) models, which provide the basis of the connectivity analysis. In the next step, the covariance stationarity of all time series samples (each picture condition for each participant) was tested by means of the Augmented Dickey Fuller Test [Elliott et al., 1996]. Data from all but one participant (who was then excluded) showed covariance stationarity. In a next step, we selected the model order for the differenced time series using the Akaike information criterion [AIC, Akaike, 1974]. This procedure penalizes the addition of parameters of the MVAR model, and thus selects a MVAR model with a good fit but a minimum of parameters. In the present data set, we chose a model with an order of 2, which was associated with a minimum AIC value.
Based on these MVAR specifications, significant Granger causality interactions between source waveforms were calculated for each condition and participant using an F‐test, which was corrected for multiple comparisons to a familywise error rate of P < 0.05. For each possible connection and direction, these Granger‐causal influences were illustrated across participants, with the line thickness corresponding to the number of participants showing a significant F‐value for a particular connection. Differences between affective conditions were evaluated using three different strategies. (i) The number of connections reaching significance for each individual participant and picture content was entered into repeated measures ANOVA with a repeated measure of content (erotica, neutral people, attack). This analysis was conducted for the overall number of connections and, in a second step, for the number of significant re‐entrant connections. Results from this analysis were compared to the result of a mixed‐model ANOVA with participants as a random factor, to ensure valid interpretation of group‐level results. Re‐entrant connections were defined as connections entering the sources in the calcarine, the precuneus, or the inferotemporal regions. The anticipated differences were modeled using contrast analyses (linear contrast for pleasure: erotica > neutral people > attack; quadratic contrast for arousal: erotica = attack > neutral people). (ii) For illustration of these findings, we mapped all connections that were significant in at least 10 out of the 16 participants, with a thicker arrow corresponding to a greater number of participants in which this connection reached significance. The cutoff of 10 participants was selected on the basis of the corrected 0.01 criterion of the nonparametric McNemar test (see below), which was also used for evaluation of differences between contents. (iii) To statistically compare content‐related differences in the number of significant connections for each pair of model sources, we used the nonparametric McNemar test, which is sensitive to differences between frequencies in limited samples and is used for within‐participant comparisons. Thus, across participants, a significant McNemar test would indicate a higher frequency of significant connections between two given model sources in a specific condition (e.g., attack), compared with another condition (e.g., neutral people). That is, a particular connection would be significant in more participants for one condition, compared with another condition. Because of the high number of tests involved (i.e. 468 tests), we used a permutation technique [Blair and Karniski, 1993; Karniski et al., 1994] to generate an empirical distribution of McNemar chi squares by shuffling contents randomly across participants. Specifically, individual connectivity values were shuffled for each participant, and McNemar results for all possible connections entered a permutation distribution. This process was repeated 8,000 times, and the resulting overall distribution, rather than the chi‐square distribution, served as a criterion for statistical significance. The chi‐square associated with the 95% tail of the permutation distribution was 7.3 and was used as the cutoff. Significant differences were illustrated in the model source space, with arrows indicating significant connections.
RESULTS
Self‐Report Data
As expected, human attack pictures were rated as less pleasant (mean pleasure rating = 2.31, SD = 0.42) than neutral people (mean pleasure rating = 5.13, SD = 0.61), which in turn were less pleasant than erotic couples (mean pleasure rating = 6.68, SD = 0.85), which resulted in a significant effect of content, F(2, 30) = 265.3, P < 0.0001. This pattern was best described by a linear contrast, F(1, 15) = 333.5, P < 0.0001.
In terms of emotional arousal, both erotica (mean rating = 5.12, SD = 1.57) and attack pictures (mean rating = 6.32, SD = 1.14) were rated more arousing than neutral people (mean rating = 2.60, SD = 1.28), F(2, 30) = 88.7, P < 0.0001, which was reflected in a quadratic contrast, F(1, 15) = 82.8, P < 0.0001.
Connectivity Analyses
Across participants and conditions, 4.6% of the possible connections showedsignificant F‐values on the participant level. There were no reliable differences (F < 1.0) in the number of overall (i.e., irrespective of direction) significant connections when viewing erotica (mean = 9.37, SD = 7.12), neutral people (mean = 9.25, SD = 7.04), and attack pictures (mean = 8.50, SD = 6.26). The same result was observed in a mixed‐model ANOVA with participants as a random factor, F(2, 30) = 0.22 ns. However, as expected, the number of re‐entrant connections (defined as connections entering the model sources in the calcarine fissure, inferotemporal cortex, and the precuneus) varied as a function of picture content, F(2, 30) = 6.35, P < 0.01. Contrast analyses showed that a quadratic pattern described this difference best, with erotic and attack pictures associated with more re‐entrant connections than neutral people, F(1, 15) = 32.67, P < 0.01 (see Fig. 3). Again, the result was confirmed in a mixed‐model ANOVA pointing to a significant effect of picture content on the number of re‐entrant connections, F(2, 30) = 6.33, P < 0.01.
Figure 3.
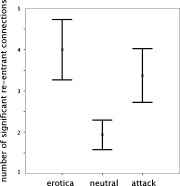
Mean number of re‐entrant connections across n = 16 participants, shown separately for the three picture contents. Error bars reflect 1 SE of the mean.
Topographical analyses on the level of single connections confirmed the results of the overall analyses. Figure 4. shows connections as a function of picture content that were significant in at least 10 out of the 16 participants. Thicker arrows correspond to greater numbers of participants in which a particular connection reached significance. When content‐related differences in the number of significant connections were evaluated by means of the McNemar test, only five connections survived thresholding, by means of generating the permutation distribution. All of these were re‐entrant in the sense of this study. Specifically, intraparietal to inferotemporal and precuneus to calcarine connections were stronger for emotionally arousing picture content. These connections are shown in Figure 5. and reflected a greater abundance of significant re‐entrant connections when viewing attack, compared with neutral and when viewing erotica compared with neutral picture content.
Figure 4.
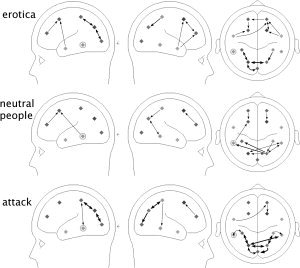
Topographical distribution of significant connections as a function of picture content, shown from left, right, and above. Thicker arrows correspond to greater numbers of participants in which a particular connection reached significance, with maximum thickness indicating that a given connection was significant in 14 out of 16 participants. Minimum thickness indicates that this connection was significant in 10 out of 16 participants.
Figure 5.
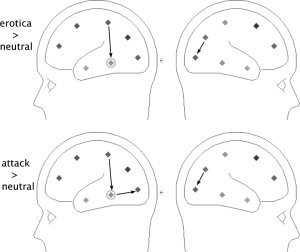
Topographical distribution of connections showing significantly different frequency in the McNemar test, comparing occurrence of significant connections between emotional contents. Top: two connections were significantly more frequent when viewing erotica, compared with neutral people: an intraparietal to inferotemporal connection on the left hemisphere, and a precuneus to calcarine connection on the right hemisphere. Bottom: three connections were more frequent when viewing attack scenes compared with neutral people: an intraparietal to inferotemporal connection and a inferotemporal to calcarine connection on the left hemisphere; and a precuneus to calcarine connection on the right hemisphere. Note that all of these were re‐entrant in the sense of the present study. No other connections/comparisons reached significance in the permutation‐corrected McNemar test.
DISCUSSION
This study sought to determine whether re‐entrant modulation of the visual system from anterior cortical sources is more pronounced when viewing emotionally arousing, compared with neutral pictures [Lang et al., 1997]. To that end, we calculated the Granger‐causal connectivity between electrocortical regional sources by means of time‐domain Granger causality for second‐order MVAR models of individual subject data [cf., Brovelli et al., 2004; Seth and Edelman, 2007]. Participants viewed perceptually balanced pleasant, neutral, and unpleasant pictures of people, flickering at 10 Hz. This paradigm resulted in a strong ssVEP signal, maintained for 6,000 ms (i.e. as long as the flickering pictures were present) and showed consistent covariance stationarity, a critical requirement of the Granger analyses conducted here. We found reliable evidence of enhanced influence from anterior cortical to visual cortical sites (re‐entrant modulation), when emotionally arousing pictures, relative to neutral, were viewed. These results provide clear support for the position that re‐entrant modulation of the visual system is enhanced as a function of the emotional arousal of the visual scene.
On a neurophysiological level, such re‐entrant modulation may represent a delayed feedback originating from higher visual cortex, deep cortical areas, or subcortical structures, which follows an initial bottom–up cascade of visual analysis [Martinez et al., 1999]. Such feedback may also arise from prefrontal cortical areas and may act to enhance sensitivity of visual neurons coding for the relevant features present in the field of view [Hamker, 2005]. Thus, the ssVEP as a measure of ongoing stimulus processing in visual cortex might be sensitive to a variety of temporally sustained biasing signals [Kastner and Ungerleider, 2000], changing the sensitivity of visual cortical neurons in favor of features associated with emotionally arousing content. It is difficult to draw strong conclusions as to the nature and time course of re‐entrant input into visual cortex; however, the present method does not allow for indepth analysis of rapid changes in connectivity after onset of the stimulus train. Consistent with the current results, previous studies using ssVEPs have suggested that visual cortical networks representing affectively arousing information show stronger connectivity and are more widespread than assemblies representing affectively neutral information [Keil et al., 2003; Moratti et al., 2004]. Thus, ssVEP response amplitude to arousing stimuli is enhanced, and its relative timing (phase) is accelerated [Keil et al., 2003; Kemp et al., 2002]. Enhanced cortical connectivity and phase acceleration during affective perception should be most pronounced in cases where the emotional content of repeatedly presented stimuli is constant and re‐entrant modulation can be in effect over a longer period of time, as is the case in ssVEP paradigms. It is likely that responses of networks involved in orchestrating re‐entrant modulation change with repeated exposure to the stimulus, leading to facilitation of the ability to detect and identify relevant features. Behavioral evidence for such improvement over time comes from studies examining identification of emotional cues, e.g. when cues are presented in the parafoveal or peripheral regions of the visual field [Calvo and Avero, in press]. In line with these behavioral data, recent work into classical conditioning of simple visual stimuli has suggested that local connectivity within visual cortex is indeed increased as a function of exposure to the learning regime [Keil et al., 2007]. Thus, one could speculate that re‐entrant modulation from anterior, distant structures is reduced over trials, giving rise to more effective, highly connected local networks [Gruber et al., 2004]. Such speculations can be tested in the future, taking advantage of the present technique in combination with time and frequency domain analyses of large‐scale neural dynamics, which allow investigating intersite phase‐locking at a millisecond scale.
An important methodological consideration of the present approach is related to the limited sensitivity of EEG measures to electric sources deeper than cortex. As a consequence, deep structures contributing to re‐entrant modulation may go undetected when using EEG‐based measures. Neuroimaging work using affective pictures has indeed converged with the animal model [Shi and Davis, 2001], showing that phylogenetically old structures such as the amygdala are critical for providing modulatory inputs to visual areas in the presence of threat or reward cues [Vuilleumier, 2005]. Using functional imaging, Sabatinelli et al. [2005] examined this hypothesis in a picture‐viewing paradigm similar to the present design, by comparing covariation of blood oxygen level‐dependent (BOLD) response across picture contents. These authors specifically considered re‐entrant processing from the amygdala into inferior temporal (i.e., fusiform) cortex. As a main result, the covariation between regional neural activation in fusiform gyrus and the amygdaloid complex was strong. This was particularly evident in a subgroup of snake phobic subjects, who showed significantly stronger activation for snake pictures (the phobic object) than did nonfearful participants and also displayed correlated BOLD increase both in the fusiform gyrus and amygdala. Our present data cannot help answering questions as to the nature and location of specific brain regions involved in top–down modulation of visual processing in emotional perception. Given the reliable overall result suggestive of systematic changes in the number of re‐entrant connections, a focus on the global pattern among sources appears a more valid strategy than focusing on particular source regions. Such a strategy takes into account the limitations of EEG in terms of spatial resolution as well as its strengths with respect to temporal properties.
Examining functional connectivity of BOLD during viewing of fear faces, Morris et al. [1998] could predict extrastriate (fusiform) activity based on amygdala responses, which corroborates the assumption that the early visual processing of emotional faces can be influenced by activity in the amygdala.
In addition to deep structures, anterior cortical areas have been shown to provide re‐entrant modulation into visual cortex on a system level [Moratti et al., 2004], which is in line with theoretical models of neural mass activity during feature‐based attention [Hamker, 2005; Mesulam, 1998]. The present results add to these data, providing evidence that (i) increased coupling for arousing content can be shown for large‐scale (neural mass) electrical activity on the cortical level and (ii) the direction of correlated activity is indeed from higher to lower tiers of visual cortex. Taken together, this indicates that allocation of visual attention to emotionally relevant visual stimuli may be effected by spatiotemporal dynamics, likely involving evolutionary old structures of the brain, but also various cortical structures. These structures appear to interact in a manner consistent across participants, providing lower tier areas with feedback according to motivational relevance on a continuous basis.
Acknowledgements
The authors thank Gilava Hamuni for editing help with a previous version of this manuscript.
REFERENCES
- Akaike H ( 1974): A new look at the statistical model identification. IEEE Trans Autom Control 19: 716–723. [Google Scholar]
- Baccala LA,Sameshima K ( 2001): Partial directed coherence: A new concept in neural structure determination. Biol Cybern 84: 463–474. [DOI] [PubMed] [Google Scholar]
- Baizer JS,Desimone R,Ungerleider LG ( 1993): Comparison of subcortical connections of inferior temporal and posterior parietal cortex in monkeys. Vis Neurosci 10: 59–72. [DOI] [PubMed] [Google Scholar]
- Berg P,Scherg M ( 1994): A fast method for forward computation of multiple‐shell spherical head models. Electroencephalogr Clin Neurophysiol 90: 58–64. [DOI] [PubMed] [Google Scholar]
- Bernasconi C,Konig P ( 1999): On the directionality of cortical interactions studied by structural analysis of electrophysiological recordings. Biol Cybern 81: 199–210. [DOI] [PubMed] [Google Scholar]
- Blair RC,Karniski W ( 1993): An alternative method for significance testing of waveform difference potentials. Psychophysiology 30: 518–524. [DOI] [PubMed] [Google Scholar]
- Bradley MM,Sabatinelli D,Lang PJ,Fitzsimmons JR,King W,Desai P ( 2003): Activation of the visual cortex in motivated attention. Behav Neurosci 117: 369–380. [DOI] [PubMed] [Google Scholar]
- Brovelli A,Ding M,Ledberg A,Chen Y,Nakamura R,Bressler SL ( 2004): Beta oscillations in a large‐scale sensorimotor cortical network: Directional influences revealed by Granger causality. Proc Natl Acad Sci USA 101: 9849–9854. [DOI] [PMC free article] [PubMed] [Google Scholar]
- Calvo MG,Avero P: Affective priming of emotional pictures in parafoveal vision: Left visual field advantage. Cogn Affect Behav Neurosci (in press). [DOI] [PubMed] [Google Scholar]
- Cuthbert BN,Schupp HT,Bradley MM,Birbaumer N,Lang PJ ( 2000): Brain potentials in affective picture processing: Covariation with autonomic arousal and affective report. Biol Psychol 52: 95–111. [DOI] [PubMed] [Google Scholar]
- Elliott G,Rothenberg TJ,Stock J ( 1996): Efficient tests for an autoregressive unit root. Econometrica 64: 813–836. [Google Scholar]
- Granger C ( 1969): Investigating causal relations by econometric models and cross‐spectral methods. Econometrica 37: 424–438. [Google Scholar]
- Gruber T,Malinowski P,Muller MM ( 2004): Modulation of oscillatory brain activity and evoked potentials in a repetition priming task in the human EEG. Eur J Neurosci 19: 1073–1082. [DOI] [PubMed] [Google Scholar]
- Hamker FH ( 2005): The reentry hypothesis: The putative interaction of the frontal eye field, ventrolateral prefrontal cortex, and areas V4, IT for attention and eye movement. Cereb Cortex 15: 431–447. [DOI] [PubMed] [Google Scholar]
- Iwai E,Yukie M ( 1987): Amygdalofugal and amygdalopetal connections with modality‐specific visual cortical areas in macaques (Macaca fuscata, M. mulatta, and M. fascicularis). J Comp Neurol 261: 362–387. [DOI] [PubMed] [Google Scholar]
- Junghöfer M,Elbert T,Tucker DM,Rockstroh B ( 2000): Statistical control of artifacts in dense array EEG/MEG studies. Psychophysiology 37: 523–532. [PubMed] [Google Scholar]
- Karniski W,Blair RC,Snider AD ( 1994): An exact statistical method for comparing topographic maps, with any number of subjects and electrodes. Brain Topogr 6: 203–210. [DOI] [PubMed] [Google Scholar]
- Kastner S,Ungerleider LG ( 2000): Mechanisms of visual attention in the human cortex. Annu Rev Neurosci 23: 315–341. [DOI] [PubMed] [Google Scholar]
- Keil A,Bradley MM,Hauk O,Rockstroh B,Elbert T,Lang PJ ( 2002): Large‐scale neural correlates of affective picture processing. Psychophysiology 39: 641–649. [DOI] [PubMed] [Google Scholar]
- Keil A,Gruber T,Muller MM,Moratti S,Stolarova M,Bradley MM,Lang PJ ( 2003): Early modulation of visual perception by emotional arousal: Evidence from steady‐state visual evoked brain potentials. Cogn Affect Behav Neurosci 3: 195–206. [DOI] [PubMed] [Google Scholar]
- Keil A,Stolarova M,Moratti S,Ray WJ ( 2007): Adaptation in visual cortex as a mechanism for rapid discrimination of aversive stimuli. Neuroimage 36: 472–479. [DOI] [PMC free article] [PubMed] [Google Scholar]
- Kemp AH,Gray MA,Eide P,Silberstein RB,Nathan PJ ( 2002): Steady‐state visually evoked potential topography during processing of emotional valence in healthy subjects. Neuroimage 17: 1684–1692. [DOI] [PubMed] [Google Scholar]
- Kemp AH,Gray MA,Silberstein RB,Armstrong SM,Nathan PJ ( 2004): Augmentation of serotonin enhances pleasant and suppresses unpleasant cortical electrophysiological responses to visual emotional stimuli in humans. Neuroimage 22: 1084–1096. [DOI] [PubMed] [Google Scholar]
- Lang PJ ( 1980): Behavioral treatment and bio‐behavioral assessment: Computer applications In: Sidowski JB,Johnson JH, William TA, editors. Technology in Mental Health Care Delivery Systems. Norwood, NJ: Ablex; pp 119–137. [Google Scholar]
- Lang PJ,Bradley MM,Cuthbert BN ( 1997): Motivated attention: Affect, activation, and action In: Lang PJ, Simons RF, Balaban MT, editors. Attention and Orienting: Sensory and Motivational Processes. Hillsdale, NJ: Lawrence Erlbaum Associates; pp 97–135. [Google Scholar]
- Lang PJ,Bradley MM,Cuthbert BN ( 2005): International affective picture system: Technical manual and affective ratings. Gainesville, FL: NIMH Center for the Study of Emotion and Attention. [Google Scholar]
- Martinez A,Anllo‐Vento L,Sereno MI,Frank LR,Buxton RB,Dubowitz DJ,Wong EC,Hinrichs H,Heinze HJ,Hillyard SA ( 1999): Involvement of striate and extrastriate visual cortical areas in spatial attention. Nat Neurosci 2: 364–369. [DOI] [PubMed] [Google Scholar]
- Mesulam MM ( 1998): From sensation to cognition. Brain 121(Pt 6): 1013–1052. [DOI] [PubMed] [Google Scholar]
- Mini A,Palomba D,Angrilli A,Bravi S ( 1996): Emotional information processing and visual evoked brain potentials. Percept Mot Skills 83: 143–152. [DOI] [PubMed] [Google Scholar]
- Moratti S,Keil A ( 2005): Cortical activation during Pavlovian fear conditioning depends on heart rate response patterns: An MEG study. Brain Res Cogn Brain Res 25: 459–471. [DOI] [PubMed] [Google Scholar]
- Moratti S,Keil A,Stolarova M ( 2004): Motivated attention in emotional picture processing is reflected by activity modulation in cortical attention networks. Neuroimage 21: 954–964. [DOI] [PubMed] [Google Scholar]
- Moratti S,Keil A,Miller GA ( 2006): Fear but not awareness predicts enhanced sensory processing in fear conditioning. Psychophysiology 43: 216–226. [DOI] [PubMed] [Google Scholar]
- Morris JS,Friston KJ,Büchel C,Frith CD,Young AW,Calder AJ,Dolan RJ ( 1998): A neuromodulatory role for the human amygdala in processing emotional facial expressions. Brain 121: 47–57. [DOI] [PubMed] [Google Scholar]
- Müller MM,Picton TW,Valdes‐Sosa P,Riera J,Teder‐Salejarvi WA,Hillyard SA ( 1998): Effects of spatial selective attention on the steady‐state visual evoked potential in the 20–28 Hz range. Brain Res Cogn Brain Res 6: 249–261. [DOI] [PubMed] [Google Scholar]
- Müller MM,Malinowski P,Gruber T,Hillyard SA ( 2003): Sustained division of the attentional spotlight. Nature 424: 309–312. [DOI] [PubMed] [Google Scholar]
- Öhman A,Flykt A,Esteves F ( 2001): Emotion drives attention: Detecting the snake in the grass. J Exp Psychol Gen 130: 466–478. [DOI] [PubMed] [Google Scholar]
- Pessoa L,Kastner S,Ungerleider LG ( 2002): Attentional control of the processing of neural and emotional stimuli. Brain Res Cogn Brain Res 15: 31–45. [DOI] [PubMed] [Google Scholar]
- Pizzagalli DA,Greischar LL,Davidson RJ ( 2003): Spatio‐temporal dynamics of brain mechanisms in aversive classical conditioning: High‐density event‐related potential and brain electrical tomography analyses. Neuropsychologia 41: 184–194. [DOI] [PubMed] [Google Scholar]
- Regan D ( 1989): Human Brain Electrophysiology: Evoked Potentials and Evoked Magnetic Fields in Science and Medicine. New York: Elsevier. [Google Scholar]
- Sabatinelli D,Flaisch T,Bradley MM,Fitzsimmons JR,Lang PJ ( 2004): Affective picture perception: Gender differences in visual cortex? Neuroreport 15: 1109–1112. [DOI] [PubMed] [Google Scholar]
- Sabatinelli D,Bradley MM,Fitzsimmons JR,Lang PJ ( 2005): Parallel amygdala and inferotemporal activation reflect emotional intensity and fear relevance. Neuroimage 24: 1265–1270. [DOI] [PubMed] [Google Scholar]
- Sabatinelli D,Lang PJ,Keil A,Bradley MM ( 2007): Emotional perception: Correlation of functional MRI and event‐related potentials. Cereb Cortex 17: 1066–1073. [DOI] [PubMed] [Google Scholar]
- Scherg M,Ille N,Bornfleth H,Berg P ( 2002): Advanced tools for digital EEG review: Virtual source montages, whole‐head mapping, correlation, and phase analysis. J Clin Neurophysiol 19: 91–112. [DOI] [PubMed] [Google Scholar]
- Schlögl A,Supp G ( 2006): Analyzing event‐related EEG data with multivariate autoregressive parameters. Prog Brain Res 159: 135–147. [DOI] [PubMed] [Google Scholar]
- Schupp HT,Junghofer M,Weike AI,Hamm AO ( 2003): Emotional facilitation of sensory processing in the visual cortex. Psychol Sci 14: 7–13. [DOI] [PubMed] [Google Scholar]
- Seth AK ( 2005): Causal connectivity of evolved neural networks during behavior. Network 16: 35–54. [DOI] [PubMed] [Google Scholar]
- Seth AK,Edelman GM ( 2007): Distinguishing causal interactions in neural populations. Neural Comput 19: 910–933. [DOI] [PubMed] [Google Scholar]
- Shi C,Davis M ( 2001): Visual pathways involved in fear conditioning measured with fear‐potentiated startle: Behavioral and anatomic studies. J Neurosci 21: 9844–9855. [DOI] [PMC free article] [PubMed] [Google Scholar]
- Srinivasan R,Russell DP,Edelman GM,Tononi G ( 1999): Increased synchronization of neuromagnetic responses during conscious perception. J Neurosci 19: 5435–5448. [DOI] [PMC free article] [PubMed] [Google Scholar]
- Vuilleumier P ( 2005): How brains beware: Neural mechanisms of emotional attention. Trends Cogn Sci 9: 585–594. [DOI] [PubMed] [Google Scholar]
- Vuilleumier P,Driver J ( 2007): Modulation of visual processing by attention and emotion: Windows on causal interactions between human brain regions. Philos Trans R Soc Lond B Biol Sci 362: 37–55. [DOI] [PMC free article] [PubMed] [Google Scholar]