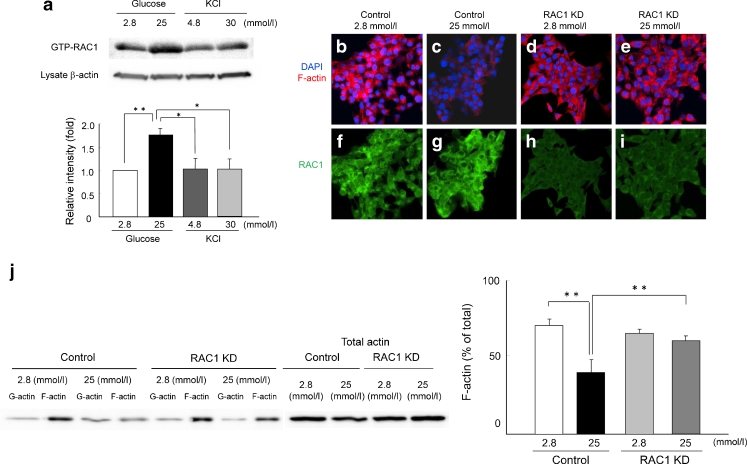
Fig. 4.
Glucose-stimulated change in F-actin in RAC1-deficient INS-1 cells. (a) INS-1 cells were stimulated with the indicated concentrations of glucose or KCl for 15 min and subjected to the measurement of GTP-RAC1, the active form of RAC1. The bar graph shows quantification of GTP-RAC1 levels. Data are means ± SE of four independent experiments. * p < 0.05, ** p < 0.01. (b–i) Control (b, c, f, g) and RAC1 knockdown (d, e, h, i) INS-1 cells were starved for 30 min in a 2.8 mmol/l glucose solution and then stimulated for 15 min with a 2.8 mmol/l or 25 mmol/l glucose solution. Staining of F-actin in response to the indicated concentrations of glucose was assessed in INS-1 cells treated with scramble siRNA (control) and Rac1 siRNA with rhodamine phalloidin (red) and DAPI (blue) (b–e). Immunostaining of RAC1 in response to the indicated concentrations of glucose was assessed in INS-1 cells treated with scramble siRNA (control) and Rac1 siRNA with antibody to RAC1 (f–i). (j) Immunoblot analysis was performed in 2.8 mmol/l and 25 mmol/l glucose-treated INS-1 cells treated with scramble siRNA (control) and Rac1 siRNA with antibodies to G-actin, F-actin and total actin. The bar graph shows quantification of the G-actin and F-actin levels. Data are means ± SE of five independent experiments. ** p < 0.01. RAC1 KD, RAC1 knockdown

