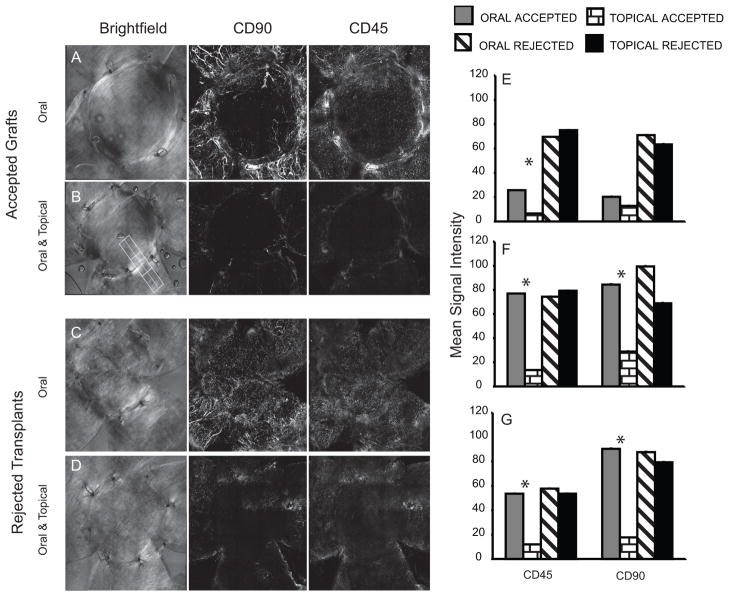
Figure 3. Effect of AZM on leukocytic infiltrate.
The figure illustrates representative corneas of mice treated with oral + topical AZM (B&D) or oral AZM only (A&C). Bright field images (left panel) illustrate the corneal bed and graft. Confocal maximum projection z-stack images illustrate localization of T cells (CD90, middle panel) and bone marrow derived cells (CD45, right panel). Accepted corneas with opacity scores of 0–0.5 at the time of sacrifice (A&B) and rejected corneas scores of 2.5–3 at the time of sacrifice. (C&D). The mean staining intensity within the graft (E), graft bed (G), and at the interface (F) was determined by drawing multiple contiguous regions (such as the figure drawn in the 3B) in the maximum projection z-stack images of corneas with equivalent opacity scores (clear or rejected). The numerous regions were analyzed in order to cover the majority of the corneas. The bar graph represents the mean ± SEM intensity in multiple corneas. The staining intensity for CD45 in all three regions of the cornea was significantly reduced (p<0.05) by topical AZM treatment and CD90 was significantly reduced by topical treatment compared to oral AZM in both the bed and the interface.

