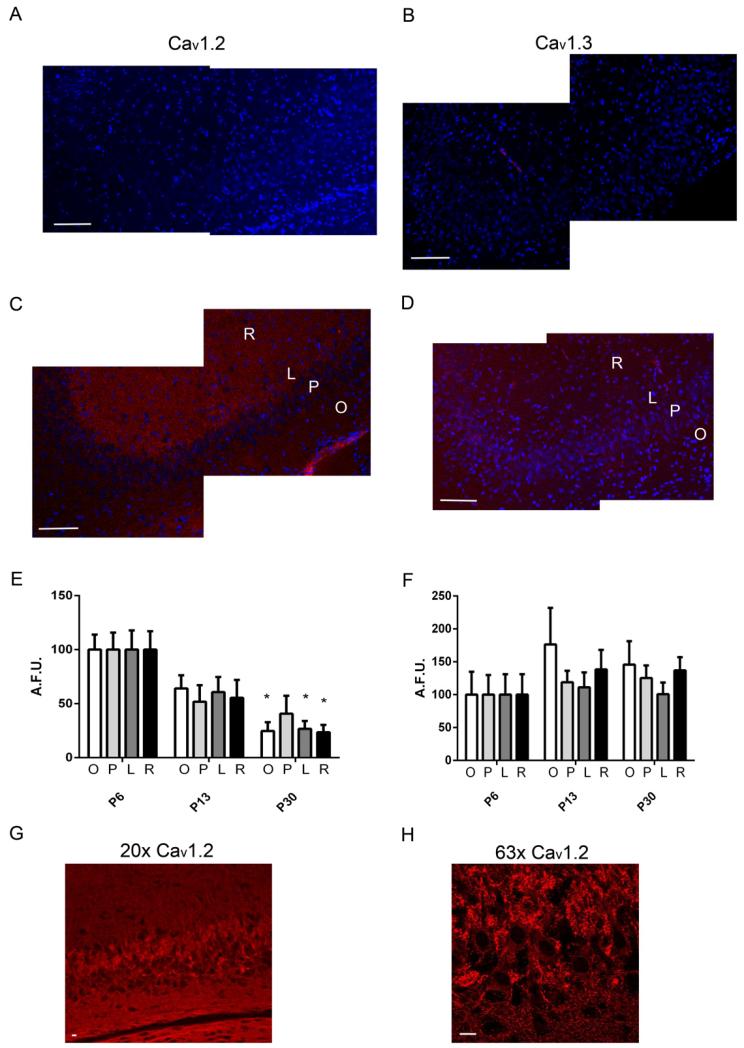
Figure 2. Immunohistochemical analysis of L-type VGCC α subunit expression during post-natal development in the CA3 hippocampal region.
Representative confocal images of tissue sections from a P6 rat that were incubated with anti-Cav1.2 or anti-Cav1.3 antibodies in the presence (A and B) or absence (C and D) of the immunogen peptide. Cav1.2 and 1.3 are represented by the red fluorescence and the blue fluorescence represents the nuclear DAPI stain. The location of the Stratum Oriens (O), Stratum Pyramidale (P), Stratum Lucidum (L), and Stratum Radiatum (R) are indicated. Scale Bars = 100 μm. Summary graphs of the average pixel intensities from each region within the CA3 for Cav1.2 (E) and Cav1.3 (F) (n = 5). Unit of determination = average of results obtained with tissue sections from a single animal. Asterisks indicate a significant (p < 0.05) difference between P30 and P6 for each region determined for each group by a one-way ANOVA. Higher magnification images at 20× (G) and 63× (H) of Cav1.2 at P6 show clustering of Cav1.2 within the soma and proximal dendrites. Scale bars = 10 μm.

