INTRODUCTION
Hepatocellular carcinoma (HCC) is the fifth most common tumor in the world, and the incidence of HCC is rapidly increasing.1 The value of imaging in the diagnosis of HCC is well-established and, in particular, magnetic resonance imaging (MRI) has been reported to be an excellent imaging modality because it offers high tissue contrast and allows the use of various tissue-specific contrast agents.2
Today, several liver-specific MRI contrast media have been investigated with the goal of increasing the diagnostic performance of liver MRI, especially with respect to lesion detection.3 One of these contrast media, the gadoxetate disodium (gadoliniumethoxybenzyl-diethylenetriamine pentaacetic acid; Gd-EOB-DTPA; Eovist and Primovist, Bayer-Schering Pharma), is taken up by hepatocytes and then excreted into the bile ducts,4 with combined vascular and hepatocyte-selective properties. In general, HCCs commonly show rapid enhancement during the arterial phase of gadoxetic acid-enhanced MR imaging and a decrease in signal intensity (SI) from the portal phase to the equilibrium phase (so-called washout), identical to the enhancement features on dynamic computerized tomography (CT).5 In the hepatobiliary phase, most HCCs are hypointense, although hyperintense HCCs are sometimes encountered.6
We report our experience with a case of a HCC that demonstrated a combination of hypo- and hyper-intensity during the hepatobiliary phase of gadoxetic acid enhanced MR imaging, features which correlated well with the histopathologic findings. In this report, we aimed to describe radiologic and pathologic findings of this case.
CASE
A 62-year-old man visited our institution on May 17, 2010, due to hoarseness that had developed one week before. Under the clinical suspicion of a laryngeal mass, he was scheduled for surgery at the department of otolaryngology. He used to be a heavy alcoholic and an 80 pack-year smoker. At the admission, high blood pressure and high blood sugar level were suspected. Family history was negative. On physical examination, the abdomen was soft with no tenderness, rebound tenderness or guardingno palpable mass was detected. Laboratory studies revealed the following values: white blood cell count, 6,800/mm3; hemoglobin, 15.9 g/dL; hematocrit, 46.4%; platelet count, 131,000/mm; total protein, 6.5 g/dL; albumin,4.3 g/dL. Aspartate aminotransferase, alanine aminotransferase, alkaline phosphatase, total bilirubin, and tumor markers including serum α-fetoprotein and protein induced by vitamin K antagonist-II (PIVKA-II) were all in the normal range. Hepatitis B virus surface antigen and anti-hepatitis C virus antibody were negative. During a routine ultrasound evaluation, a 3.3 cm-sized mass was incidentally discovered in segment VII of the liver. The mass was heterogeneously echogenic and the surrounded liver demonstrated generally increased echogenicity.
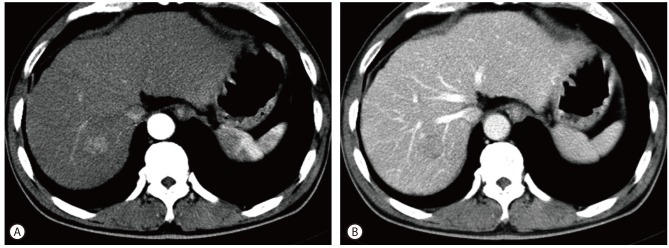
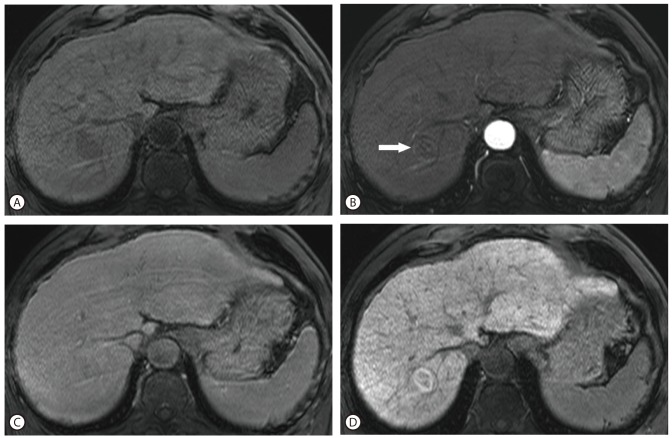
The patient subsequently underwent contrast-enhanced abdomen CT (Fig. 1) which demonstrated underlying cirrhotic change of the liver and the mass in that was previously detected on ultrasound. The mass showed enhancement during the arterial phase and wash-out during the portal phase. After being lost to follow-up for a period of 16 months, the patient revisited our hospital and underwent an MRI of the liver (Fig. 2). The mass, which had not increased in size, showed rim enhancement during the arterial phase and wash-out during the delayed phase. The mass was hyperintense on T2-weighted images and restricted diffusion was seen on diffusion-weighted imaging sequences. On the 20-minutes delayed scans, heterogeneously low SI was seen in the central portion while the peripheral rim demonstrated high SI. The patient's hepatic function suggested a Child-Pugh score of 5 points.
Figure 1.

Axial CT with arterial and portal phase images. The lesion at hepatic segment VII shows arterial enhancement at the arterial phase images (A), and subtle wash-out at the portal phase (B). Underlying liver cirrhosis was noted.
Figure 2.
Axial dynamic enhanced MRI with hepatobiliary phase MR images. The lesion at hepatic segment VII shows low SI on pre-contrast T1 weighted images (A), subtle enhancement in the peripheral rim portion (arrow) at the arterial phase of the gadoxetic acid-enhanced image (B), and subtle wash-out in the both portions at the delayed phase (C). On the hepatobiliary phase (20 minutes delay), high SI focus at the periphery and low SI portion at the center of the tumor were detected (D).
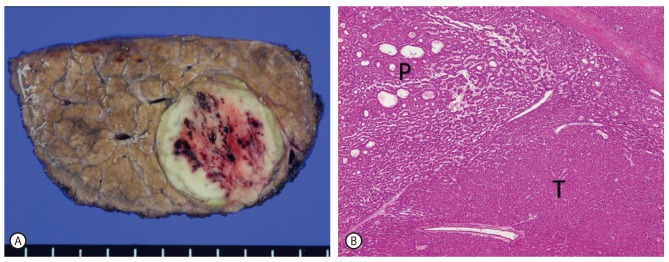
The surgeon at our institution performed a wedge resection of hepatic segment VII. Histologic examination of the surgical specimen, measuring 8×5×3 cm in dimensions, disclosed an encapsulated greenish white, ovoid nodular and solid mass situated within the liver parenchyma showing macronodular cirrhotic change (Fig. 3A). Microscopic examination of the mass revealed a well differentiated HCC composed of microtrabecular pattern in the central portion and pseudoglandular pattern in the periphery, features which correlated well with the findings from the hepatobiliary phase of enhanced MR imaging (Fig. 3B). In the immunohistochemical studies, CD34 revealed increased sinusoidal capillarization, but glypican-3, AFP and cytokeratin 7 were negative in tumor.
Figure 3.

Cut section of liver segment VII revealed an encapsulated ovoid solid mass showing a greenish white rim portion and a yellowish white central portion with punctate hemorrhage in the background of macronodular cirrhosis (A). Microscopically, the mass confirmed as a well differentiated HCC. The peripheral portion showed pseudoglandular pattern (P), whereas the central portion showed microtrabecular pattern (T) (H and E stain; original magnification ×40) (B).
The patient underwent a follow up CT scan 6 months after surgery demonstrating no evidence of recurrence.
DISCUSSION
Previous studies on dynamic MRI using liver specific contrast agents such as gadoxetic acid and gadobenate dimeglumin have shown that the contrast agent is distributed in the extracellular fluid during the arterial phase. It is then taken up by the functional hepatocytes and excreted into the biliary system during the hepatobiliary phase.4 In HCCs, while the tumor is well enhanced during the arterial phase and washed out during the equilibrium phase, it becomes more hypointense than the normal liver parenchyma during the hepatobiliary phase because HCC does not have functional hepatocytes.5,6
Recently, it has been reported that, some HCCs show iso- or hyperintensity during the hepatobiliary phase of gadoxetic acid-enhanced MR imaging.6 Some investigators reported that the degree of tumor enhancement by hepatobiliary contrast agents was correlated with the histologic grades of HCCs. They explained that the uptake of this type of MR contrast agent by tumor cells may be preserved; however, other researchers disputed this assertion.7-9
Looking at the mechanism of cellular uptake of gadoxetic acid, it is specifically taken up by hepatocytes which have the cloned organic anion transporting polypeptides (OATPs), and excreted via multidrug resistance-associated proteins (MRPs).10 OATPs mediate the uptake of bile acid and act as anion exchangers.11 OATP1B1 is most highly expressed in the human liver, and is mainly involved in the uptake of gadoxetic acid into the hepatocytes in conjunction with OATP8 (synonymous with OATP1B3). On the contrary, MRPs are multispecific ATP-binding cassette transporters involved in the efflux of organic anions.11 Among them, MRP 2 is involved in the excretion of gadoxetic acid into bile duct while MRP 3 is involved in the excretion into hepatic sinusoid.
Therefore, positive OATPs expression seems to be associated with significantly high enhancement of HCCs in hepatobiliary phase. However, this is not always true for tumor enhancement because it is also dependent to the overall degree of MRP expression.10 If MRP2 expression is increased and gadoxetic acid with bile is excreted into canaliculi, the SI of the tumor will be decreased during the hepatobiliary phase. However, if the histologic pattern of the tumor is pseudoglandular, gadoxetic acid will be excreted into the lumen of pseudogland, instead of canaliculi, and the SI will be increased (Fig. 4).10 Pseudoglandular pattern is one of four proliferative patterns of HCC (trabecular, pseudoglandular, solid, and scirrhous), showing gland-like dilatation of the canaliculi between tumor cells or central degeneration of trabeculae.12 In this case, the peripheral rim portion had high SI in the hepatobiliary phase, whereas a low SI was seen in the central portion of the lesion in the same phase. Histologically, the tumor showed moderate to high differentiation (Edmondson-Steiner grade I-II), and revealed a greenish white rim portion that corresponded to the pseudoglandular pattern and yellowish white central portion that corresponded to the trabecular pattern, exactly matching the features of the mass on MRI. Moreover, the index tumor had not enlarged for 16 months, possibly because the histologic grade of the tumor was relatively low.
Figure 4.

This diagram shows hypothetical mechanism of gadoxetic acid accumulation in HCC. OATP1B1 and/or -1B3 mediates uptake of gadoxetic acid from sinusoid to tumor cell, whereas MRP2 mediates secretion of gadoxetic acid from tumor cell to lumen (*) of canaliculus or pseudocyst (A). Flowchart illustrates relationship between transporter expression pattern and accumulation pattern of gadoxetic acid. Tumors without OATP1B1 and/or-1B3 expression do not accumulate gadoxetic acid, whereas tumors with OATP1B1 and/or -1B3 expression accumulate gadoxetic acid in cytoplasm, canaliculi, or pseudoglandular lumina, depending on MRP2 expression patterns (B). (From Tsuboyama T, et al. Radiology 2010;255(3):824-833, with permission from RSNA®).10
In conclusion, gadoxetic acid is a useful MR contrast media for the diagnosis of HCC, and many HCCs demonstrate low SI on hepatobiliary phase using this contrast media. However, in some cases the tumor may show high SI because of the difference of cellular transporters-OATPs and MRPs- of hepatocytes in the tumor.
SUMMARY
In gadoxetic acid-enhanced liver magnetic resonance imaging (MRI), it is known that the pseudoglandular type of hepatocellular carcinoma (HCC) may demonstrate high signal intensity on 20-minutes delayed imaging unlike the microtrabecular counterpart. Herein we report a case of HCC which consisted of mixed components of hypo- and hyper-intensity in the hepatobiliary phase of gadoxetic acid-enhanced MRI, focusing on its imaging findings and pathologic features.
Abbreviations
- AFP
α-Fetoprotein
- CT
computed tomography
- Gd-EOB-DTPA
gadolinium-ethoxybenzyl-diethylentriamine pentaacetic acid
- HCC
hepatocellular carcinoma
- MRI
magnetic resonance imaging
- MRP
multidrug resistance-associated protein
- OATP
organic anion transporting polypeptides
- PIVKA-II
protein induced by vitamin K antagonist-II
- SI
signal intensity
Footnotes
The authors have no conflicts to disclose.
References
- 1.El-Serag HB, Mason AC. Rising incidence of hepatocellular carcinoma in the United States. N Engl J Med. 1999;340:745–750. doi: 10.1056/NEJM199903113401001. [DOI] [PubMed] [Google Scholar]
- 2.Noguchi Y, Murakami T, Kim T, Hori M, Osuga K, Kawata S, et al. Detection of hepatocellular carcinoma: comparison of dynamic MR imaging with dynamic double arterial phase helical CT. AJR Am J Roentgenol. 2003;180:455–460. doi: 10.2214/ajr.180.2.1800455. [DOI] [PubMed] [Google Scholar]
- 3.Semelka RC, Helmberger TK. Contrast agents for MR imaging of the liver. Radiology. 2001;218:27–38. doi: 10.1148/radiology.218.1.r01ja2427. [DOI] [PubMed] [Google Scholar]
- 4.Schuhmann-Giampieri G, Schmitt-Willich H, Press WR, Negishi C, Weinmann HJ, Speck U. Preclinical evaluation of Gd-EOB-DTPA as a contrast agent in MR imaging of the hepatobiliary system. Radiology. 1992;183:59–64. doi: 10.1148/radiology.183.1.1549695. [DOI] [PubMed] [Google Scholar]
- 5.Hecht EM, Holland AE, Israel GM, Hahn WY, Kim DC, West AB, et al. Hepatocellular carcinoma in the cirrhotic liver: gadolinium-enhanced 3D T1-weighted MR imaging as a stand-alone sequence for diagnosis. Radiology. 2006;239:438–447. doi: 10.1148/radiol.2392050551. [DOI] [PubMed] [Google Scholar]
- 6.Huppertz A, Haraida S, Kraus A, Zech CJ, Scheidler J, Breuer J, et al. Enhancement of focal liver lesions at gadoxetic acid-enhanced MR imaging: correlation with histopathologic findings and spiral CT--initial observations. Radiology. 2005;234:468–478. doi: 10.1148/radiol.2342040278. [DOI] [PubMed] [Google Scholar]
- 7.Lee SA, Lee CH, Jung WY, Lee J, Choi JW, Kim KA, et al. Paradoxical high signal intensity of hepatocellular carcinoma in the hepatobiliary phase of Gd-EOB-DTPA enhanced MRI: initial experience. Magn Reson Imaging. 2011;29:83–90. doi: 10.1016/j.mri.2010.07.019. [DOI] [PubMed] [Google Scholar]
- 8.Choi JY, Kim MJ, Park YN, Lee JM, Yoo SK, Rha SY, et al. Gadoxetate disodium-enhanced hepatobiliary phase MRI of hepatocellular carcinoma: correlation with histological characteristics. AJR Am J Roentgenol. 2011;197:399–405. doi: 10.2214/AJR.10.5439. [DOI] [PubMed] [Google Scholar]
- 9.Kitao A, Zen Y, Matsui O, Gabata T, Kobayashi S, Koda W, et al. Hepatocellular carcinoma: signal intensity at gadoxetic acid-enhanced MR Imaging--correlation with molecular transporters and histopathologic features. Radiology. 2010;256:817–826. doi: 10.1148/radiol.10092214. [DOI] [PubMed] [Google Scholar]
- 10.Tsuboyama T, Onishi H, Kim T, Akita H, Hori M, Tatsumi M, et al. Hepatocellular carcinoma: hepatocyte-selective enhancement at gadoxetic acid-enhanced MR imaging--correlation with expression of sinusoidal and canalicular transporters and bile accumulation. Radiology. 2010;255:824–833. doi: 10.1148/radiol.10091557. [DOI] [PubMed] [Google Scholar]
- 11.Dancygier H. Hepatocellular transport. In: Dancygier H, editor. Clinical Hepatology. 1st ed. Vol 1. Berlin: Springer; 2010. pp. 61–74. [Google Scholar]
- 12.Kondo Y, Nakajima T. Pseudoglandular hepatocellular carcinoma. A morphogenetic study. Cancer. 1987;60:1032–1037. doi: 10.1002/1097-0142(19870901)60:5<1032::aid-cncr2820600518>3.0.co;2-k. [DOI] [PubMed] [Google Scholar]


