

Abstract
Epithelial-to-mesenchymal transition (EMT) is controlled by cellular signaling pathways that trigger the loss of cell-cell adhesion and lead to the restructuring of the cell cytoskeleton. Transforming growth factor β (TGF-β) has been shown to regulate cell plasticity through the phosphorylation of Par6 on a conserved serine residue (S345) by the type II TGF-β receptor. We show here that atypical protein kinase C (aPKC) is an essential component to this signaling pathway in non-small-cell lung cancer (NSCLC) cells. We show that the aPKC, PKCι, interacts with TGF-β receptors through Par6 and that these proteins localize to the leading edge of migrating cells. Furthermore, Par6 phosphorylation on serine 345 by TGF-β receptors is enhanced in the presence of aPKC. aPKC kinase activity, as well as an association with Par6, were found to be important for Par6 phosphorylation. In effect, small interfering RNA-targeting aPKC reduces TGF-β-induced RhoA and E-cadherin loss, cell morphology changes, stress fiber production, and the migration of NSCLC cells. Interestingly, reintroduction of a phosphomimetic Par6 (Par6-S345E) into aPKC-silenced cells rescues both RhoA and E-cadherin loss with TGF-β stimulation. In conclusion, our results suggest that aPKCs cooperate with TGF-β receptors to regulate phospho-Par6-dependent EMT and cell migration.
INTRODUCTION
During tumor progression, epithelial-to-mesenchymal transition (EMT) characterizes an event where the cohesive, apicobasolaterally polarized cells of the epithelium detach from the basement membrane and acquire the ability for independent movement as mesenchyme-like cells (1–3). EMT is characterized by the loss of E-cadherin based adherens junctions, allowing for stationary carcinoma cells to escape the physical constraints of cell-cell adhesion, leading to invasion of the stromal compartment (1). The process of EMT involves altering cell genetic programs and inducing morphological changes that foster an invasive and migratory phenotype (2–6). Transforming growth factor β (TGF-β) signaling is an important regulator of EMT through its promotion of invasion and metastasis (7–9). In conjunction with the canonical TGF-β/Smad pathway that has been shown to alter transcriptional responses leading to EMT, a second TGF-β pathway was defined, in which the conserved polarity protein Par6 was shown to be a binding partner and substrate of the TGF-β receptors (10, 11). Indeed, TGF-β-dependent phosphorylation of Par6 on serine 345 leads to Smurf1-mediated degradation of RhoA. This in turn leads to significant remodeling of the actin cytoskeleton and the dissolution of tight and adherens junctions, leading to EMT and metastasis (11–13).
Par6 is an adaptor molecule for the polarity complex (14–18), a highly conserved group of interacting protein partners, including atypical protein kinase C (aPKC), Par3, and several small GTPases that work in concert to control apical-basal cell polarity, directional cell polarization, migration, and cell proliferation (15, 17, 19–24). Notably, aPKC was shown to be part of the complex that regulates protrusion formation through the TGF-β receptors (11, 25, 26), although its exact role has not been defined.
The atypical PKCs (aPKCs), which consist of PKCι and PKCζ, are a unique subset of PKCs that do not require diacylglycerol (DAG), phosphatidylserine, or calcium for their activation (27). PKCι has been implicated in carcinogenesis (28–34) and is considered to be the first member of the PKC family to be a human oncogene (30). Our recent work has shown that PKC activity can regulate the trafficking and degradation of TGF-β receptors, as well as the duration of phospho-Smad2 signaling (35).
Here, we report that, in addition to TGF-β receptors, aPKCs phosphorylate Par6 on serine 345, and aPKC expression increases Par6 steady-state levels. Furthermore, reduction in aPKC expression or the association of aPKC with Par6 reduces EMT and the migration of non-small-cell lung cancer (NSCLC) cells.
MATERIALS AND METHODS
Antibodies and reagents.
Primary monoclonal anti-GFP (Living Colors; catalog no. JL8), anti-Flag (Sigma; catalog no. F3165), anti-HA (Santa Cruz; catalog no. Y11-SC-805), anti-β-actin (Sigma; catalog no. A2668), anti-PKCι (Santa Cruz; catalog no. SC11399)/(BD Transduction; catalog no. 610175), anti-PKCζ and anti-PPKCζ (Cell Signaling Technology; catalog no. 9372 and 9378), anti-Rac1 (BD Transduction; catalog no. 610650), and anti-E-cadherin (BD Transduction; catalog no. 610182, and Cell Signaling Technology; catalog no. 3195) antibodies were used in accordance with the manufacturers' suggestions. Anti-P-Par6 antibody (S345) was a gift from Jeff Wrana. Horseradish peroxidase (HRP)-conjugated secondary goat anti-rabbit (Thermo Scientific; catalog no. 31460) and goat anti-mouse (Thermo Scientific; catalog no. 31430) antibodies were used for immunoblot analysis. Fluorescently conjugated goat antimouse (Jackson Immunoresearch; catalog no. 715225150) and goat antirabbit (Jackson Immunoresearch; catalog no. 711175152) antibodies and Cy3-conjugated streptavidin (Jackson Immunoresearch; catalog no. 016160084) antibodies were used for immunofluorescence studies. A555-conjugated phalloidin (Invitrogen; catalog no. A34055) was used for F-actin staining. Human small interfering RNA (siRNA) constructs were purchased from Invitrogen (Stealth; siPKCζ, siPKCι, and siControl catalog no. 10620319-HSS183348, 10620319-HSS183318, and 12935112), respectively. The constructs encoding Flag- or hemagglutinin (HA)-tagged TGF-β receptors, Flag-Smurf1, Flag-Par6 (WT and S345), and PKCζ-HA were used as previously described (11, 36). The green fluorescent protein (GFP)-tagged PKCι was kindly provided by A. Babwah (The Children's Health Research Institute, London, Ontario, Canada) and S. Ferguson (Robarts Research Institute, London, Ontario, Canada) (37). Transwell migration assays were conducted using Costar Transwell permeable support inserts with a pore size of 8 μm (Costar; catalog no. 3422).
Cell culture and transfections.
Rat2 fibroblast and HEK293T cell lines were maintained in Dulbecco modified Eagle medium supplemented with 10% fetal bovine serum (FBS). A549 and H1299 NSCLC cell lines were maintained in F12K and RPMI 1640 media, respectively, supplemented with 10% FBS. The cells were kept in a humidified tissue culture incubator at 37°C in 5% CO2. Calcium phosphate transfections were carried on cells at ca. 40% confluence, followed by a change in medium ∼24 h from the time of transfection. siRNA transfections were conducted using Lipofectamine RNAiMAX (Invitrogen) according to the manufacturer's protocol. DNA transfection of H1299 and A549 cells was conducted with Lipofectamine 2000 (Invitrogen) or Lipofectamine LTX (Invitrogen), respectively, according to the manufacturer's protocol.
Protein concentrations.
Protein concentrations were determined according to the Lowry method (Fisher).
Immunoblotting and immunoprecipitation.
Cells were lysed (50 mM Tris-HCl [pH 7.4], 150 mM NaCl, 1 mM EDTA, 0.5% Triton X-100, 1 mM phenylmethylsulfonyl fluoride, and a mixture of protease inhibitors) and centrifuged at 14,000 rpm at 4°C for 10 min. Aliquots of supernatants were collected for analysis of the total protein concentration. For immunoprecipitation, equal amounts of the remaining cell lysates were incubated with primary antibody, followed by incubation with protein G-Sepharose beads. The precipitates were washed three times with lysis buffer, eluted with sample buffer, and subjected to SDS-PAGE. Proteins were transferred to nitrocellulose, followed by blocking in 5% skim milk and incubation with primary antibody in Tris-buffered saline plus Tween overnight at 4°C. After incubation with HRP-conjugated secondary antibody, the proteins were visualized using West Dura Super Signal ECL (Fisher) and imaged on a VersaDoc imaging system (Bio-Rad).
Scratch assays and polarization assay.
To assess cell migration, a confluent monolayer of cells was scratched with a sterile pipette tip to create an opening or “wound.” After wounding, the cells were incubated in serum containing medium for 4 h to allow for cell polarization and leading edge formation. The cells were then fixed and processed for immunofluorescence microscopy. For the polarization assay, A549 cells were transfected with control or aPKC-directed siRNA. At 24 h posttransfection, cells were seeded subconfluently onto coverslips to allow the cells to establish front-rear polarization. At 24 h after seeding, the cells were fixed and processed for immunofluorescence microscopy. For quantification of polarization, immunofluorescence images were acquired and scored for polarization phenotype. At least 100 cells were assessed per condition, per experiment. Graphs represent the averages of three independent experiments ± the standard errors of the means (SEM).
Immunofluorescence microscopy.
For the immunofluorescence microscopy studies, the cells were fixed with 4% paraformaldehyde, permeabilized with 0.25% Triton X-100, and incubated for 1 h in blocking solution (10% FBS plus phosphate-buffered saline) and then incubated with the indicated primary antibodies in blocking solution. After incubation with the appropriate Cy-conjugated secondary antibodies (or streptavidin) and A555 phalloidin, the cells were visualized by immunofluorescence microscopy using an inverted IX81 microscope (Olympus, Canada).
Transwell migration assays.
H1299 cells were transfected with equal amounts of either empty vector (pIRES) or one of the Par6 constructs in the pIRES vector. The cells were serum starved for 3 h prior to being seeded onto the top of a Transwell chamber (Costar). A total of 30,000 cells per condition were seeded and allowed to migrate toward medium containing 10% serum. In parallel, 30,000 cells from each condition were seeded onto coverslips in medium containing 10% serum. After 18 h, the cells on the topside of the Transwell membrane were removed with a cotton swab, and the migrated cells (on the underside of the Transwell membrane) were fixed with 4% paraformaldehyde. Cells on both the Transwell membrane and coverslips were stained with DAPI (4′,6′-diamidino-2-phenylindole) and mounted onto glass slides. Images were acquired using an IX81 inverted microscope (Olympus). Ten representative fields were acquired at ×200 magnification and quantified. The graphs represent the averages of three independent experiments. Cells expressing GFP were counted for each Transwell membrane. Cells that were plated simultaneously on coverslips were also quantified and compared to DAPI-stained cells (total cells) to determine transfection efficiencies.
EMT and migration.
A549 cells were transfected with either control or aPKC-directed siRNA. At 24 h posttransfection, the cells were serum starved for 3 h prior to treatment. The cells were then incubated in serum-free medium containing either no TGF-β or 250 pM TGF-β for 0, 48, or 72 h to induce EMT. At each time point, the cells were bright-field imaged using a IX71 inverted microscope (Olympus), processed for immunofluorescence microscopy, or processed for immunoblotting. For quantification of stress fiber formation, immunofluorescence images (multiple fields) were acquired and assessed for F-actin morphology over three independent experiments. At least 100 cells were assessed per condition and per experiment (>600 cells total per experiment were assessed). The graphs represent the averages of three independent experiments. For cell migration analysis, transfected A549 cells were serum starved and treated with TGF-β for 48 h. After 48 h, 30,000 cells were seeded into Transwell chambers. The cells were allowed to migrate toward serum-free medium or medium containing 10% FBS. After 18 h, Transwell chambers were processed as described above. Cell nuclei on the underside of the membrane were visualized and counted using DAPI staining. Ten representative fields were acquired at ×200 magnification and quantified. The graphs represent the averages of four independent experiments normalized to the serum-free control. Cells that were plated simultaneously into a six-well culture dish were lysed after 18 h and processed for SDS-PAGE to assess E-cadherin loss and subsequently whether EMT had occurred.
Reverse transcription, real-time PCR, and statistical analyses.
Total RNA was isolated from A549 cells using an RNeasy minikit (Qiagen) according to the manufacturer's protocol. For cDNA synthesis, 1,000 ng of total RNA was reverse transcribed using a Superscript VILO cDNA synthesis kit according to the manufacturer's protocol. (Applied Biosystems). A cDNA equivalent to 10 ng of total RNA was used for all PCRs in a total volume of 20 μl. Each reaction was carried out in triplicate. Quantitative PCRs were conducted using SsoFast EvaGreen Supermix (Bio-Rad) with a Chromo4 real-time thermal cycler (Bio-Rad) according to the recommended protocol of the manufacturer. The primers, with sequences (5′ to 3′) in parentheses, were as follows: PKCι (TACGGCCAGGAGATACAACC and TCGGAGCTCCCAACAATATC), PKCζ (ATCATTCATGTTTTCCCGAGCA and GTTGGCACGGTACAGCTTC), SNAI-1 (AATCGGAAGCCTAACTACAGCG and GTCCCAGATGAGCATTGGCA), SNAI-2 (ATACCACAACCAGAGATCCTCA and GACTCACTCGCCCCAAAGATG), β-actin (GGGAAATCGTGCGTGACATTAAG and TGTGTTGGCGTACAGGTCTTTG), and POLR2A (GGATGACCTGACTCACAAACTG and CGCCCAGACTTCTGCATGG). The primers were selected using Primer3 (38), as well as PrimerBank (39–41). Baseline and threshold for threshold cycle (CT) calculation were set manually using the Opticon Monitor 3.1 software (Bio-Rad). PCR efficiencies (E) were calculated using cDNA dilution curves and were >90% for all of the genes assessed. Calculated PCR efficiencies were used for gene expression quantification using the Pfaffl formula (42), i.e., the ratio (Etarget)ΔCT target(control − treated)/(Ereference)ΔCT ref(control − treated), where control refers to siControl with no TGF-β. Final ratios were calculated using geometric averaging (43) from two reference genes: POLR2A, a gene which was found to be a suitable reference gene in NSCLC models (44), and β-actin. Gene expression of each treatment is expressed in relation to the control (siControl, no TGF-β) and is an average of three independent experimental trials. One-way analysis of variance (ANOVA), followed by post hoc Tukey's tests, was used to evaluate the significance of the results. Statistical analyses were performed using GraphPad Prism Software 5.0, and P values of <0.05 were considered statistically significant.
Site-directed mutagenesis.
Lysine 19 and serine 345 were mutated to alanine and glutamic acid, respectively, using a QuikChange mutagenesis kit (Agilent Technologies) onto the Par6-Flag-pCMV5b template according to the manufacturer's guidelines. Both mutants were transformed into an Escherichia coli XL1-Blue strain, amplified, purified by using a Qiagen miniprep kit (Qiagen), and sequenced at the London Regional Genomics Centre (London, Ontario, Canada).
Statistical analysis.
One- or two-way ANOVA analysis, followed by post hoc Bonferroni's tests were used to evaluate the significance of the results. Statistical analyses were performed using GraphPad Prism Software 5.0, and P values of <0.05 were considered statistically significant.
RESULTS
TGF-β receptors and aPKCι localize to the leading edge of migrating cells.
Migrating fibroblasts are polarized and show a clear leading edge as they migrate toward a wound. The TGF-β receptors, as well as the atypical PKCζ, have been shown to localize to the leading edge of migrating cells (45). Furthermore, PKCζ, TGF-β, and Par6 have been shown to be involved in membrane protrusion dynamics through Smurf1 (12, 26). We investigated here whether PKCι, the other member of the aPKC family, colocalizes with TGF-β receptors at the leading edge and membrane protrusions of migrating cells. To do this, we carried out scratch assays followed by immunofluorescence microscopy (Fig. 1). Polarized Rat2 fibroblasts were immunostained for PKCι and Rac1, a leading edge marker, and TGF-β receptors, using biotin-labeled TGF-β ligand. We observed that the TGF-β receptors and PKCι colocalized with Rac1 at the leading edge of migrating fibroblasts (Fig. 1A), whereas GM130, a marker for the Golgi apparatus, was not detected at the leading edge with PKCι and the TGF-β receptors (Fig. 1B). This colocalization was also observed in polarized A549 adenocarcinoma cells (see Fig. 9B). Having ascertained that aPKC and TGF-β receptors colocalized in migrating cells, we next sought to determine whether there was an interaction between PKCι and the TGF-β receptors.
Fig 1.
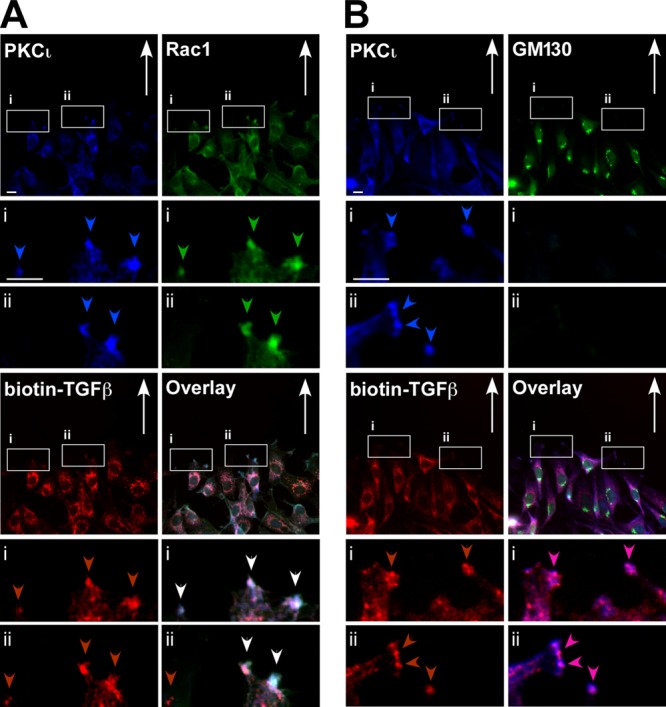
Atypical PKCι colocalizes with TGF-β receptors at the leading edge of migrating cells. Rat2 fibroblasts were scratched and incubated for 4 h to establish cell polarity and then fixed, permeabilized, and immunostained with anti-PKCι (PKCι, blue), biotin-labeled TGF-β (biotin-TGF-β; red), anti-Rac1 (Rac1, green [A]), or anti-GM130 (Golgi apparatus marker, green [B]). The direction of cell migration is indicated with arrows, and PKCι, Rac1, and TGF-β receptors at the leading edge of migrating cells are indicated by blue, green, and red arrowheads, respectively. The white arrowheads indicate the colocalization of all three proteins. Bar, 10 μm.
Fig 9.

aPKC silencing reduces TGF-β-induced changes in cell morphology. (A) A549 cells transfected with control siRNA (siControl) or siRNA targeting PKC iota and zeta (siPKC ι/ζ) were treated with TGF-β for 0, 48, or 72 h and imaged by bright-field microscopy. Bar, 100 μm. (B) A549 cells transfected with control siRNA (siControl) or siRNA targeting PKC iota and zeta (siPKC ι/ζ) were plated subconfluently, fixed, permeabilized, and immunostained with anti-PKCι (PKCι, blue) anti-Rac1 (Rac1, green), and biotin-labeled TGF-β (biotin-TGF-β; red). (C) The average numbers of total elongated verses rounded cells were quantitated over three experiments and are presented graphically (n = 3, values are given ± the SEM). Bar, 100 μm.
TGF-β receptors and PKCι interact via Par6.
Previous work has shown that PKCζ interacts with TGF-β receptors through an association with Par6 (11). Par6 and aPKC each contain a distinct PB1 (Phox-BEM1) domain through which they interact (46). Par6 is also known to be an adaptor protein linking several kinases and small GTPases to facilitate cellular processes such as cell polarization and migration (16, 17, 23, 25, 47). To determine whether PKCι interacted with TGF-β receptors, we expressed TGF-β receptors in the presence of wild-type Par6 or a mutant of Par6 that lacks the PB1 domain (Par6-ΔPB1) and PKCι in HEK293T cells. After immunoprecipitation and immunoblot analyses, we observed that PKCι interacted with TGF-β receptors. Furthermore, this association occurred in the presence of wild-type Par6 but not in the presence of the mutant of Par6 that lacks the PB1 domain (Fig. 2, lanes 9 and 10). This result suggests that there is a complex formation between the TGF-β receptors and aPKC via Par6.
Fig 2.
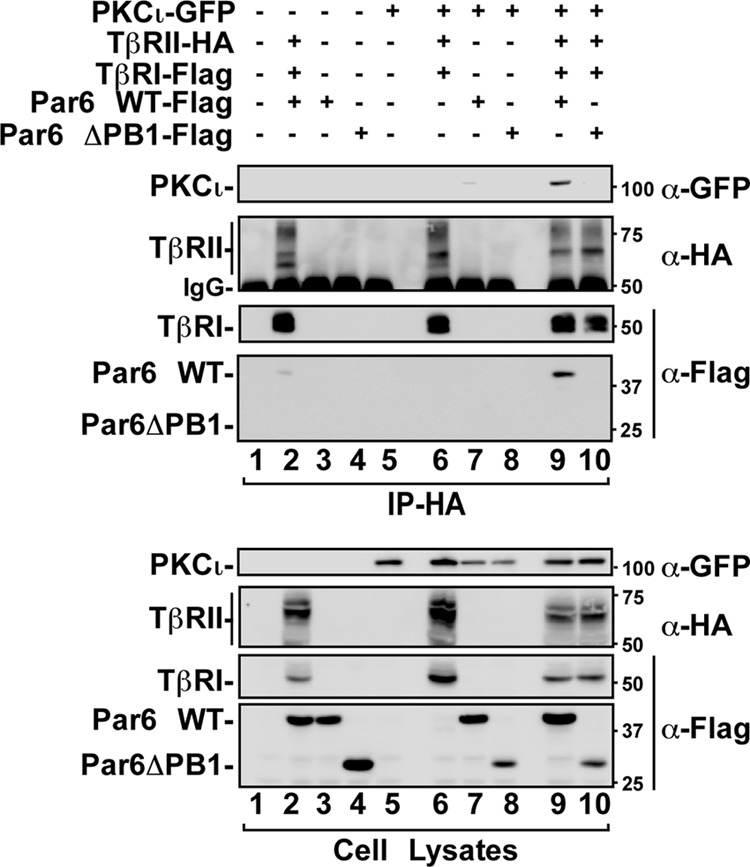
Atypical PKCι association with TGF-β receptors. HEK293T cells expressing the indicated combinations of GFP-tagged PKCι, HA-tagged TGF-β type II receptors (TβRII), Flag-tagged TGF-β type I receptors (TβRI), wild-type Par6 (Par6 WT), or a mutant of Par6 that does not associate with TGF-β receptor (Par6-ΔPB1) were lysed immunoprecipitated (IP) with anti-HA antibodies. The immunoprecipitates were then subjected to SDS-PAGE and immunoblotted with anti-GFP (α-GFP), anti-HA, or anti-Flag antibodies as primary antibodies to visualize proteins that coprecipitated with TβRII (top panel). The nonspecific immunoglobulin heavy chain is indicated (IgG), and cell lysates are shown in the bottom panel.
aPKC phosphorylates Par6.
Phosphorylation of Par6 by TβRII on S345 is an important step in TGF-β-dependent EMT (11, 12). Given the oncogenic role of aPKC in various cancers, and after seeing that aPKC and TGF-β receptors colocalized and interacted through Par6, we assessed whether aPKC had an effect on phospho-Par6 levels (P-Par6). We used immunoblotting to determine the levels of S345 phosphorylated Par6 in the presence of receptors and aPKC isoforms (Fig. 3).
Fig 3.

aPKC associates and phosphorylates Par6 on S345. (A) TGF-β receptors phosphorylate Par6 on S345. HEK293T cells expressing the indicated combinations of HA-tagged TGF-β type II receptors (TβRII), Flag-tagged TGF-β type I receptors (TβRI) or Par6 (Par6) were lysed and immunoblotted with anti-HA (α-HA), anti-Flag, or anti-phospho-specific S345 Par6 (α-P-Par6) antibodies. The relative mobilities of each protein are indicated on the left. (B) aPKC isoforms enhance TGF-β receptor phosphorylation of Par6. HEK293T cells expressing the indicated combinations of GFP-tagged PKCι, HA-tagged PKCζ or TGF-β type II receptors (TβRII), Flag-tagged TGF-β type I receptors (TβRI), wild-type Par6 (Par6 WT), or a mutant of Par6 that does not associate with aPKC (K19) were lysed, subjected to SDS-PAGE, and immunoblotted with anti-GFP, anti-PKCζ, anti-Flag, anti-Par6, or anti-P-Par6 antibodies. (C) Par6 phosphorylation is dependent on aPKC activity. HEK293T cells expressing the indicated combinations of HA-tagged wild-type (WT) or kinase-deficient (KR) PKCζ and Flag-tagged Par6 (Par6) were lysed, subjected to SDS-PAGE, and immunoblotted with anti-PKCζ, anti-Par6, or anti-P-Par6 antibodies. (D) Par6 phosphorylation is dependent on aPKC association. HEK293T cells expressing HA-tagged wild-type (WT) or kinase-deficient (KR) PKCζ and Flag-tagged Par6 (Par6) or a mutant of Par6 that does not associate with aPKC (K19) were lysed and immunoprecipitated (IP) with anti-Flag antibodies. The immunoprecipitates were then subjected to SDS-PAGE and immunoblotted with anti-PKCζ, or anti-Par6 antibodies (top panel). Cell lysates were immunoblotted with the antibodies indicated to assess protein expression and Par6 phosphorylation (bottom panel).
We first expressed TGF-β receptors and Par6 in HEK293T cells and assessed P-Par6 levels in the presence of TGF-β receptors (Fig. 3A). As expected, coexpression of TGF-β receptors and Par6 resulted in Par6 phosphorylation. We next determined whether coexpression of aPKC would alter P-Par6 levels by coexpressing TGF-β receptors, wild-type Par6, a Par6 mutant that does not bind aPKC (Par6 K19A), and/or aPKC isoforms (Fig. 3B). Expression of Par6 with TGF-β receptors resulted in an increase in P-Par6 levels, and this was greatly increased in the presence of either PKCι or PKCζ (Fig. 3B, lanes 2, 4, and 7). Interestingly, when we coexpressed the receptors, aPKC and a mutant of Par6 that does not interact with aPKC Par6 (K19A), we observed Par6 phosphorylation levels seen with TGF-β receptors alone (Fig. 3B, lanes 5 and 8).
To further assess whether aPKC could induce the phosphorylation of P-Par6 in the absence of TGF-β receptors, we expressed Par6 in the presence or absence of WT or kinase-deficient aPKC (Fig. 3C). We observed that active aPKC phosphorylated Par6 but the kinase-deficient aPKC did not. To assess whether the physical interaction of aPKC and Par6 is necessary for the phosphorylation of Par6, we conducted an immunoprecipitation experiment in cells expressing the indicated WT or mutant constructs (Fig. 3D). We observed that both the WT and kinase-deficient PKCζ associated with Par6, but only active PKCζ increased P-Par6 levels. In addition, we utilized a mutant of Par6 (Par6-K19A) that does not interact with aPKC due to the mutation of a lysine residue in the PB1 domain of Par6 (19, 48, 49). Accordingly, we observed that both active and kinase-deficient PKCζ do not associate with Par6-K19A. These results show that, in addition to TGF-β receptors, Par6 can be phosphorylated by aPKC. Furthermore, this phosphorylation is dependent on both aPKC-Par6 association and aPKC kinase activity.
Par6 acts as a scaffold between aPKC and TGF-β receptors.
We next set out to determine whether increased expression of aPKC would effect the association of Par6 with type I TGF-β receptors (TβRI) (Fig. 4A). TβRI and Par6 constructs (WT or K19A) were expressed in the presence of increasing levels of aPKCι. Par6 protein was then immunoprecipitated and immunoblotted for aPKC and TβRI to assess association with these binding partners. We found that increasing aPKC expression reduced the amount of TβRI bound to Par6, accompanied by an increased association of aPKC with Par6 (Fig. 4A). However, the Par6 mutant that cannot associate with aPKC (K19A) continued to associate with TβRI despite increasing aPKC levels (Fig. 4A, right panel). Interestingly, we also observed that the steady-state levels of Par6 increased when it was displaced from the TβRI (Fig. 4A, cell lysates, lanes 4 to 6). However, this was not observed in cells expressing Par6 K19A (Fig. 4A, cell lysates, lanes 8 to 10).
Fig 4.

aPKC, TβRI, and Par6 association. (A) aPKC displaces Par6 from TGF-β receptors. HEK293T cells were transfected with Flag-TβRI, Flag-Par6 (WT or K19A), and increasing amounts of GFP-tagged PKCι. Lysates were immunoprecipitated (IP) with anti-Par6 antibodies. The immunoprecipitates (IP) were subjected to SDS-PAGE and immunoblotted anti-GFP (α-GFP) or anti-Flag antibodies as primary antibodies to visualize proteins that coprecipitated with Par6. Total lysates are shown in the bottom panel. Par6-associated TβRI levels were quantitated and are shown graphically (n = 3, values are given ± the standard error of the mean [SEM]; *, P < 0.05). (B) Par6 mutants attenuate aPKC-dependent reduction of TGF-β receptor steady-state levels. HEK293T cells expressing HA-tagged TGF-β type II receptors (TβRII), Flag-tagged TGF-β type I receptors (TβRI), Flag-tagged Smurf1, and Flag-tagged Par6 (WT, K19A, or S345A) were lysed, subjected to SDS-PAGE, and immunoblotted with anti-HA, anti-Flag, antiactin, or anti-phospho-specific S345 Par6 (α-P-Par6) antibodies. The relative mobilities of each protein are indicated on the left.
The ubiquitin ligase Smurf1 is known to regulate the levels of Par6 as well as the TGF-β receptors (50–52). Interestingly, we observed that the expression of Par6 with TGF-β receptors and Smurf1 decreased the steady-state levels of receptors, Par6, and Smurf1 (Fig. 4B). This effect was reduced when the K19A or S345A mutants were expressed in place of WT Par6, suggesting that both endogenous aPKC association with Par6 and phosphorylation on S345 may be involved in Smurf1 mediated degradation of the TGF-β receptor-Par6 complex.
These data further substantiate the scaffolding of TβRI and aPKC via Par6 and implicates aPKC in the degradation of receptor associated Par6. Taken together, our results suggest that aPKC association and S345 phosphorylation of Par6 can regulate TGF-β receptor and Par6 levels.
aPKC expression and association increases Par6 levels.
After observing that the expression of aPKC displaced Par6 from TβRI and increased steady-state Par6 levels, we assessed the protein stability of Par6 when coexpressed with PKCι (Fig. 5A). Using the translation inhibitor, cycloheximide, cells expressing Par6 were assessed for Par6 levels over a 6-h time course. We observed that Par6 levels dropped to ca. 16.2% ± 8.3% within 6 h (Fig. 5A, right panel). When Par6 was coexpressed with aPKC, we observed stabilization of Par6 protein levels. Indeed, when Par6 was expressed with aPKC, the Par6 protein levels remained at 88.8% ± 3.9% of the time zero control (Fig. 5A, right panel).
Fig 5.

aPKC expression stabilizes Par6 protein levels. (A) HEK293T cells were transfected with Flag-Par6 and empty vector or with Flag-Par6 and GFP-tagged PKCι. These cells were then subjected to a time course with the translation inhibitor cycloheximide (100 μg/ml) and lysed after the indicated time points. Lysates were subjected to SDS-PAGE, followed by immunoblotting with anti-GFP, anti-Flag, or anti-GAPDH (loading control). The average Par6 levels over time were quantitated and are shown graphically (right panel, n = 3, values are given ± the SEM; **, P < 0.01). (B) HEK293T cells expressing combinations of Flag-Smurf1, GFP-PKCι, and Flag-Par6 were subjected to SDS-PAGE, followed by immunoblotting with anti-GFP, anti-Flag, or anti-P-Par6 to assess the protein or phosphoprotein levels. (C) HEK293T cells expressing combinations of Flag-Smurf1, GFP-PKCι, Flag-Par6, Flag-Par6-K19A, or Flag-Par6-S345A (phosphorylation site mutated) were lysed and subjected to SDS-PAGE, followed by immunoblotting with the primary antibodies indicated on the right of the panels. Par6 protein levels were quantitated and are shown graphically (n = 6, values are given ± the SEM).
We next assessed the effect of Smurf1 on Par6 levels. We observed that the coexpression of Par6 with Smurf1 led to reduced steady-state levels of Par6 (Fig. 5B). However, coexpression of aPKC with Par6 blocked this degradation, as observed by an increase in steady-state levels of Par6 (Fig. 5B). We further wanted to explore whether S345 phosphorylation of Par6 would alter its steady-state levels. We analyzed this by expressing aPKC in cells expressing Par6 or the K19A and S345A mutants (Fig. 5C). Notably, we observed an increase in steady-state Par6 levels when aPKC was introduced to cells expressing WT or S345A Par6 mutant (Fig. 5C, lanes 2 to 3 and lanes 6 to 7). This effect was not observed in cells expressing Par6-K19A, a mutant that cannot associate with aPKC (Fig. 5B, lane 4 versus lane 5). Interestingly, aPKC was not observed to displace Smurf1 from Par6 (data not shown). These results suggest that aPKC association and not the phosphorylation of Par6 inhibited Smurf1-mediated reduction of steady-state levels of Par6 (Fig. 5C).
Par6 phosphorylation and aPKC association are important for Par6-induced migration.
Expression and phosphorylation of Par6 have been shown to increase the migration and metastatic processes of breast cancer cells (12). We therefore tested whether Par6 phosphorylation and aPKC association could affect cell migration of a metastatic NSCLC cell line (H1299) using Transwell migration assays (Fig. 6). Briefly, H1299 cells were transiently transfected with empty pIRES vector, WT Par6 or the two mutant Par6 constructs (K19A and S345A). Our results indicated that overexpression of WT Par6 increased cell migration [(5.3 ± 0.1)-fold] toward serum compared to control cells. Cells expressing the aPKC binding mutant of Par6 (Par6-K19) also stimulated H1299 cell migration by (2.4 ± 0.4)-fold. This muted, yet significant stimulation of cell migration was expected, since Par6-K19 can still associate with TGF-β receptors and be phosphorylated by TβRII on S345. Finally, cells expressing the S345 mutant of Par6 that cannot be phosphorylated by either TβRII or aPKC did not significantly stimulate cell migration (Fig. 6B).
Fig 6.
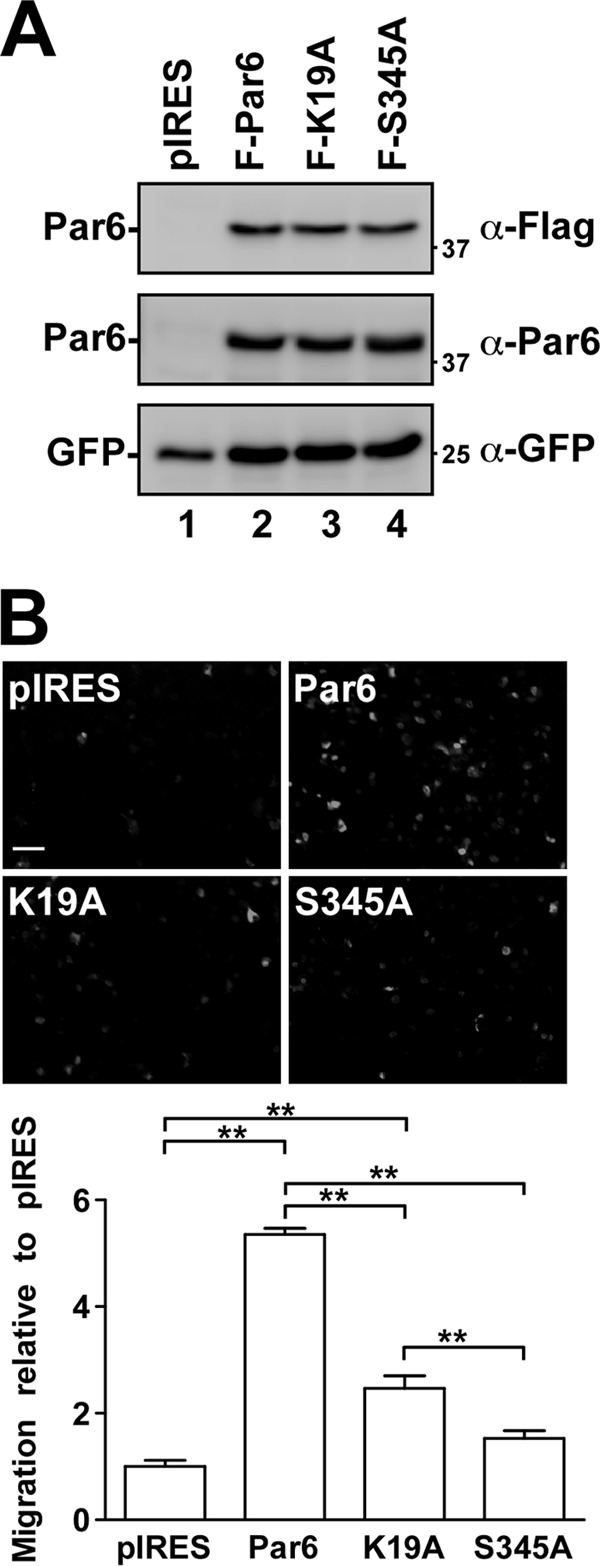
Par6-induced cell migration. (A) H1299 cells were transiently transfected with empty vector (pIRES), wild-type Par6 (Par6-WT), Par6-K19A, or Par6-S345A constructs. Immunoblots of lysates show the relative expression levels of transfected cells. (B) Cells transfected as described for panel A were plated into the top chamber of a Transwell chamber and allowed to migrate toward serum for 18 h. Representative images from the migration assay are shown above graphical analysis. The data are presented as a percentage of the control (pIRES) and represent the averages of three independent experiments (n = 3, values are given ± the SEM; **, P < 0.01). Bar, 100 μm.
Taken together, these results suggest that aPKC isoforms play a role in NSCLC cell migration both through Par6 association and S345 phosphorylation. We next explored whether siRNA directed toward aPKC would affect TGF-β-dependent EMT.
aPKC siRNA alters RhoA levels.
The TGF-β/Par6 pathway has been shown to regulate EMT by stimulating cytoskeletal remodeling and cell plasticity. A critical step in this process is TGF-β-induced degradation of RhoA by Smurf1 (11). Interestingly, this was shown to be Smurf1 dependent, since the reduction of Smurf1 expression blocked RhoA degradation and EMT (11, 26). Furthermore, both the phosphorylation of Par6 and the PKC activity were shown to be important for the recruitment of Smurf1 and targeting of RhoA for degradation (11, 26). Since we observed that aPKC cooperates with TGF-β receptors to phosphorylate Par6, we next determined whether aPKC played a role in TGF-β-induced RhoA degradation. Using siRNA targeting both aPKC isoforms, we monitored RhoA levels in response to TGF-β in A549 NSCLC cells (Fig. 7).
Fig 7.
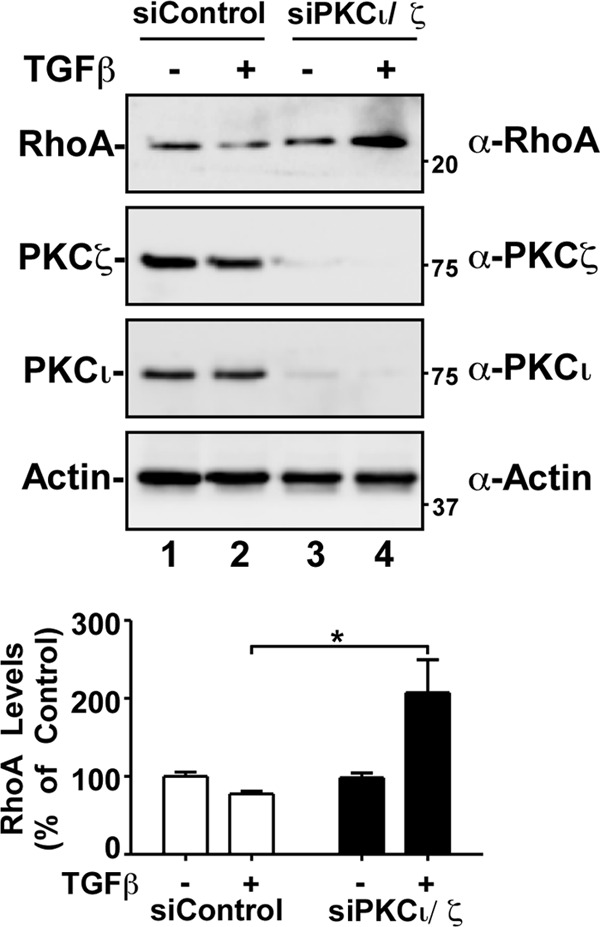
aPKC silencing attenuates TGF-β-dependent decrease in RhoA levels. A549 cells transfected with control siRNA (siControl) or siRNA targeting PKC iota and zeta (siPKCι/ζ) were treated with TGF-β, followed by lysing and processing for SDS-PAGE and immunoblotting with anti-RhoA (α-RhoA), anti-PKCζ, anti-PKCι, or antiactin antibodies. The average RhoA levels were quantitated and graphed (bottom panel, n = 5, values are given ± the SEM; *, P < 0.05).
Previous work has shown that, upon TGF-β stimulation, RhoA levels are reduced by ∼20%, followed by the cell cytoskeletal and morphological changes associated with EMT (11). Similarly, we detected a consistent reduction in RhoA levels after TGF-β treatment in cells transfected with control siRNA (Fig. 7). However, siRNA targeting aPKC resulted in a TGF-β-dependent increase in RhoA steady-state levels (Fig. 7). Intriguingly, this result was similar to previous findings that RhoA accumulates with Smurf1 knockdown (26). We next monitored activated aPKC levels in response to TGF-β treatment.
TGF-β treatment activates aPKC.
We next examined aPKC activity in response to TGF-β using a phospho-specific antibody that detects T410 phosphorylated PKCζ (or T403 in PKCι). Phosphorylation of aPKC on this site is known to regulate its enzymatic activity (53). Consistent with studies carried out with prostate cancer cells and mouse embryonic fibroblasts (23), we observed that TGF-β treatment increased the levels of endogenous phospho-PKCι/ζ in A549 cells (Fig. 8, cell lysates). Interestingly, expression of Par6 also increased P-PKCι/ζ levels to equivalent levels seen with TGF-β addition, indicating that Par6 may also scaffold aPKC to endogenous activators. After immunoprecipitation of Par6 and immunoblotting for activated aPKC, we found that Par6-associated P-PKCι/ζ levels increased by 22% ± 7% upon TGF-β treatment compared to control (Fig. 8, IP and graph). These results prompted us to assess whether aPKC played a role in TGF-β-induced cell morphology and EMT.
Fig 8.
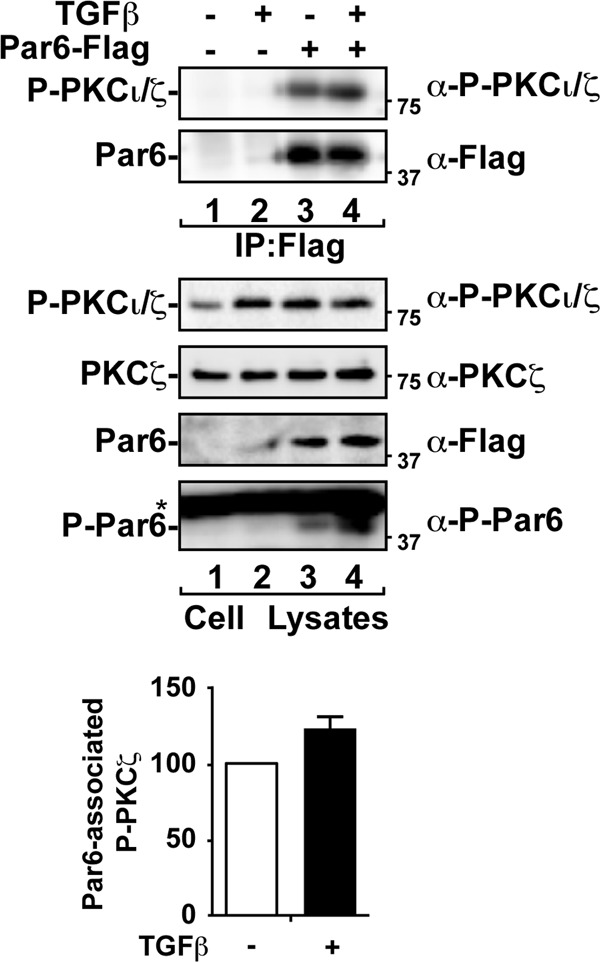
TGF-β increases total and Par6-associated aPKC activity. A549 cells transfected with empty vector or Flag-tagged Par6 were treated with (or without) TGF-β for 1 h. Cell lysates were immunoprecipitated (IP) with anti-Flag antibodies. The immunoprecipitates (IP) were subjected to SDS-PAGE and immunoblotted with anti-phospho-specific PKCζ (α-P-PKCζ), total PKCζ, and anti-Flag as indicated. The asterisk denotes a nonspecific band. The average Par6-associated P-PKCζ levels were quantitated and are shown graphically (n = 3, values are given ± the SEM).
aPKC siRNA induces changes in cell morphology.
TGF-β-treated A549 cells acquire a spindle-shaped appearance and reduce cell-cell contacts (7). We observed that siRNA-mediated aPKC silencing reduced TGF-β-induced morphological changes of A549 cells, as assessed by differential interference contrast microscopy (Fig. 9A). In cells expressing aPKC isoforms, the cobblestone appearance of A549 cells became elongated in the presence of TGF-β after 48 and 72 h. In contrast, aPKC-silenced cells retained their cobblestone morphology with TGF-β treatment at both time points. We also examined the front-rear polarization of subconfluent control and aPKC-silenced A549 cells (Fig. 9B). Interestingly, we found that the proportion of cells that polarize and form a leading edge is reduced in aPKC-silenced cells. Furthermore, we detected a greater number of cells with a rounded phenotype in aPKC-silenced cells than in control (Fig. 9C). This is in agreement with previous work that aPKC plays an important role in cell polarization (20) and similar to work that cells are less protrusive with Smurf1 knockdown (26).
aPKC siRNA reduces TGF-β-induced EMT.
Since we observed that both aPKCs and TGF-β receptors could phosphorylate Par6, that TGF-β increases activated aPKC levels, and that aPKC modulates TGF-β-induced RhoA degradation, we next determined to what extent aPKC was involved in TGF-β-induced EMT. TGF-β-dependent EMT involves the loss, in the expression and organization, of the adhesion protein E-cadherin (2, 3, 7) and leads to decreased cell adhesion and increased cell motility.
Using siRNA directed at both aPKC isoforms, we assessed changes in TGF-β-induced E-cadherin protein levels in A549 NSCLC cells (Fig. 10A). Control or aPKC-silenced cells were treated with TGF-β for 0 to 72 h, and cell lysates were immunoblotted for E-cadherin, P-Smad2, PKCι, PKCζ, Smad2, and actin. We observed that E-cadherin protein levels were significantly reduced in control cells incubated with TGF-β after 48 or 72 h (Fig. 10A, lanes 1 to 3). In addition, we observed Smad2 phosphorylation after 48 and 72 h of TGF-β treatment. In contrast, basal E-cadherin levels were significantly higher in aPKC-silenced cells and were only moderately decreased in response to TGF-β (Fig. 10A, lanes 4 to 6). This suggested that aPKC was important for TGF-β-induced E-cadherin loss despite efficient phosphorylation of Smad2. Interestingly, the levels of mRNA for the transcriptional repressors of E-cadherin, SNAI1 and SNAI2, both increased to a similar extent in control and aPKC-silenced cells (Fig. 10B). This is consistent with the idea that Smad2 signaling was still occurring in both control and aPKC-silenced cells.
Fig 10.

aPKC silencing reduces TGF-β-induced E-cadherin loss, stress fiber formation, and cell motility. (A) A549 cells transfected with control siRNA (siControl) or siRNA targeting PKC iota and zeta (siPKCι/ζ) were treated with TGF-β for 0, 48, or 72 h. The cells were then lysed and processed for SDS-PAGE and immunoblotting with anti-E-cadherin (α-E-cadherin), anti-phospho-specific Smad 2 (α-P-Smad2), anti-Smad2, anti-PKCζ, anti-PKCι, or antiactin antibodies. The asterisk denotes a nonspecific band. The average E-cadherin levels were quantitated and graphed (bottom panel, n = 5, values are given ± the SEM; **, P < 0.01). (B) A549 cells transfected with control siRNA (siControl) or siRNA targeting PKC iota and zeta (siPKCι/ζ) were treated with or without TGF-β. After 24 h, total RNA was extracted, reverse transcribed, and subjected to quantitative real-time PCR analysis of PRKCI (PKCι), PRKCZ (PKCζ), SNAI1 (Snail), and SNAI2 (Slug). The relative gene expression is shown graphically (n = 3, values are given ± the SEM; a, P < 0.05). (C) A549 cells transfected with control siRNA (siControl) or siRNA targeting PKC iota and zeta (siPKCι/ζ) were treated with or without TGF-β for 48 h, followed by processing for immunofluorescence microscopy and stained for filamentous actin with phalloidin (red), E-cadherin (green), and DAPI to image nuclei (blue). Cell morphology changes over three independent experiments were quantified and are displayed graphically. “a” indicates a statistically significant change with TGF-β treatment (P < 0.05). “b” indicates a statistically significant difference between siControl and siPKCι/ζ cells at the indicated time point (P < 0.05). Bar, 100 μm. (D) A549 cells transfected with control siRNA (siControl) or siRNA targeting PKC iota and zeta (siPKCι/ζ) were untreated or treated with TGF-β for 48 h and assessed for migration toward serum for 18 h. Representative images from the migration assay are shown below the graphical analysis (n = 4, values are given ± the SEM; **, P < 0.01). Bar, 100 μm.
We next assessed E-cadherin expression and stress fiber formation in A549 cells by immunofluorescence microscopy. We observed that in the absence of TGF-β treatment, 88% ± 5% of control cells and 82% ± 4% of siPKCι/ζ cells contained few spanning stress fibers and maintain a cortical F-actin distribution (Fig. 10C). In contrast, upon TGF-β treatment, the majority of cells transfected with control siRNA (76% ± 4%) display elongated, cell spanning stress fibers after 48 and 72 h. This effect was significantly reduced in aPKC-silenced cells in which only 15% ± 5% of cells show elongated stress fibers (Fig. 10C). Furthermore, TGF-β-induced E-cadherin loss was reduced in aPKC-silenced cells (Fig. 10C), a finding consistent with the immunoblot analyses (Fig. 10A). Taken together, these data suggest that aPKC is necessary for efficient TGF-β-induced EMT of NSCLC cells.
After observing that aPKC knockdown attenuated TGF-β-induced EMT, we next assessed cell motility. Our results showed that after 48 h of TGF-β stimulation, siControl cells migrated toward serum to a greater extent than aPKC-silenced cells, as assessed by Transwell migration assays (Fig. 10D). This indicated that aPKC-silenced cells that did not undergo EMT were also less motile. We next assessed whether reintroduction of exogenous P-Par6 into aPKC-silenced cells could restore TGF-β-induced EMT.
Phosphomimetic Par6 induces TGF-β-dependent EMT and RhoA degradation in aPKC-silenced cells.
We next sought to test whether a reduction in phospho-Par6 was indeed responsible for the reduced EMT response we were seeing in aPKC-silenced cells. To carry this out, we generated a serine 345 phosphomimetic version of Par6 (Par6 S345E). We first ascertained that the Par6 S345E mutant was phosphomimetic by immunoblot analysis using the phospho-Par6 antibody (Fig. 11A). Indeed, the phospho-S345 Par6 antibody recognized the Par6 S345E mutant.
Fig 11.

The S345E phosphomimetic Par6 mutant restores TGF-β-dependent E-cadherin and RhoA loss in aPKC-silenced cells. (A) HEK293T cells transfected with Flag-Par6 (WT, K19A, S345A, or S345E) were lysed, processed for SDS-PAGE, and immunoblotted with anti-Flag (α-Flag) or anti-phospho-Par6 antibodies to determine the relative levels of P-Par6. (B) A549 cells transfected with control siRNA (siControl) or siRNA targeting PKC iota and zeta (siPKCι/ζ) and Par6-S345E or empty vector were incubated in the presence or absence of TGF-β for 48 h. The cells were then lysed and processed for SDS-PAGE and immunoblotting with anti-E-cadherin, anti-PKCζ, anti-PKCι, or antiactin antibodies. The average E-cadherin levels were quantitated and graphed (n = 4, values are given ± the SEM; *, P < 0.05). (C) A549 cells were treated as described in panel B. The cells were then lysed and processed for SDS-PAGE and immunoblotting with anti-RhoA and antiactin antibodies. The average RhoA levels were quantitated and graphed (n = 4, values are given ± the SEM; *, P < 0.05).
Next, we introduced Par6 S345E into aPKC-silenced cells and assessed the E-cadherin protein levels after TGF-β treatment (Fig. 11B). Consistent with observations in Fig. 10A, aPKC silencing reduced the TGF-β-dependent loss of E-cadherin levels (Fig. 11B, lanes 1 to 4). However, the Par6 S345E mutant restored the TGF-β effect (Fig. 11B, lanes 7 and 8). Furthermore, Par6 S345E reduced the induction of basal E-cadherin levels observed in aPKC-silenced cells (Fig. 11B, lane 3 versus 7).
As observed with the E-cadherin analysis, expression of the phosphomimetic Par6 S345E mutant significantly reversed the effect of aPKC silencing on TGF-β-dependent RhoA levels (Fig. 11C). aPKC-silenced cells contained a significant increase of RhoA protein levels in response to TGF-β. However, not only did Par6 S345E reduce this effect, cells expressing this Par6 mutant had lower RhoA levels than cells transfected with only control siRNA (Fig. 11C, bottom panel).
Taken together, the data suggest that the phosphorylation of Par6 by both TGF-β receptors and aPKC is necessary for efficient EMT of A549 NSCLC cells.
DISCUSSION
Epithelial-to-mesenchymal transition (EMT) is a critical event in tumor progression leading to the disorganization of tissue architecture. The aPKC-Par6 axis is an emerging pathway shown to be important in the stimulation of EMT and the progression of metastatic tumors. Phosphorylation of Par6 is associated with tumors that are more invasive and have been correlated with reduced survival in breast cancer patients (12). Until now, Par6 phosphorylation on serine 345 has only been reported to occur through TGF-β receptor activation.
In this report, we observed that both atypical PKC isoforms (ι and ζ) also phosphorylate Par6 on S345, and this suggests a role for aPKC in promoting epithelial cell-derived tumor cells into EMT through the Par6 pathway. Coupled with the observations that aPKC shows malignant activity in various cancers (28, 32, 54) and oncogenic potential in lung cancer (29–31, 34), our results suggest that aberrant phosphorylation of Par6 by aPKC may be a major tumor promoting process.
Interestingly, we discovered that aPKC increases steady-state Par6 protein levels, which we attribute to a decrease in Smurf1 mediated degradation. A recent report has indicated that protein kinase A-dependent phosphorylation of Smurf1 leads to the protection of Par6 and the simultaneous Smurf1-mediated degradation of RhoA (50). Given our observations, it would be interesting to explore whether aPKC can also phosphorylate Smurf1, thus leading to protection of Par6 from Smurf1 mediated degradation. Furthermore, Smurf1 may target TGF-β receptors and Par6 for degradation via aPKC association and Par6 S345 phosphorylation. Since we have previously described a role for aPKC in TGF-β receptor trafficking and degradation (35), we believe the current results suggest a role for aPKC regulation of TGF-β receptor-Par6 complexes.
Ozdamar et al. have previously shown that Par6 phosphorylation on S345 is important for TGF-β-mediated RhoA degradation and adherens junction dissolution (11). Here, we show that basal E-cadherin levels are significantly higher in aPKC-silenced cells and, furthermore, that TGF-β-induced reductions of both RhoA and E-cadherin are severely impaired when aPKC is silenced. This effect was seen despite similar phospho-Smad2 signaling levels between control and aPKC-silenced cells, highlighting the importance of aPKC in the EMT process via the Par6 pathway.
A similar effect has been reported with respect to the ability of the ErbB2 receptor to disrupt tissue architecture of polarized epithelia (19). Inhibiting the interaction of aPKC and Par6 (with K19A) blocked the ability of ErbB2 to disrupt the acinar organization of breast epithelial cells (19). Interestingly, activation of the TGF-β/Par6 pathway has also been shown to disrupt acinus-like structure formation in normal murine mammary gland cells (12). This effect is reduced through expression of the S345A Par6 mutant, indicating that phosphorylation of Par6 on S345 is important for this disruption. Given the observations that both aPKC association with Par6 and S345 phosphorylation are important for tissue organization, we believe that aPKC phosphorylation of Par6 may be critical in the disorganization of normal tissue architecture. Interestingly, introduction of the phosphomimetic Par6 (S345E) into aPKC-silenced cells restored full TGF-β-induced E-cadherin loss and RhoA degradation, highlighting an important role for aPKC-induced P-Par6 in these processes.
We propose that multiple tumor promoting pathways (including TGF-β and ErbB2) may require aPKC to disrupt cell polarity and that aPKC may be a target for blocking oncogenic signaling pathways that induce tissue disruption during tumor progression. Indeed, we observed that the silencing of aPKC reduces TGF-β-induced EMT and migration of A549 adenocarcinoma cells. Furthermore, others have shown that loss-of-function experiments of PKCι in A549 cells showed reduced invasive activity as well as significantly reduced tumor growth and expansion in vivo in nude mice (31, 34). aPKC has recently been implicated in various disease states, and several studies have highlighted the oncogenic characteristics of PKCι in NSCLC (29, 33, 34, 54–56), with an elevated level of PKCι expression reported to be correlated with poor outcome in NSCLC patients. Patients with early-stage lung cancer and high PKCι expression are >10 times more likely to perish from the disease than those with low levels of PKCι (56). A similar trend is evident in patients with increased PKCι DNA copy number and ovarian cancer (28). Increased PKCι expression is also correlated with increased cyclin E expression in ovarian cancers and is implicated with increased proliferation, defects in cell polarity, and decreased survival rates (28). Furthermore, aPKC has been shown to be important in the Par6-induced cell proliferation in breast epithelial cells, since the K19A Par6 mutant reduces the mitogenic effects of Par6 signaling (24).
We believe that aPKC is an important component of TGF-β-activated phosphorylation of Par6 and that silencing of aPKC gene expression blocks TGF-β-induced EMT and migration of NSCLC cells. It will be interesting to explore whether the aPKC-Par6 axis is an important pathway in the metastatic progression of NSCLC tumors in vivo.
ACKNOWLEDGMENTS
We thank Jeffrey L. Wrana for generously providing the S345 phosphospecific Par6 antibody.
This study was funded by the Canadian Institutes of Health Research (MOP-93625).
Footnotes
Published ahead of print 17 December 2012
REFERENCES
- 1. Guarino M, Rubino B, Ballabio G. 2007. The role of epithelial-mesenchymal transition in cancer pathology. Pathology 39:305–318 [DOI] [PubMed] [Google Scholar]
- 2. Thiery JP. 2002. Epithelial-mesenchymal transitions in tumour progression. Nat. Rev. Cancer 2:442–454 [DOI] [PubMed] [Google Scholar]
- 3. Thiery JP, Sleeman JP. 2006. Complex networks orchestrate epithelial-mesenchymal transitions. Nat. Rev. 7:131–142 [DOI] [PubMed] [Google Scholar]
- 4. Huber MA, Kraut N, Beug H. 2005. Molecular requirements for epithelial-mesenchymal transition during tumor progression. Curr. Opin. Cell Biol. 17:548–558 [DOI] [PubMed] [Google Scholar]
- 5. Moreno-Bueno G, Portillo F, Cano A. 2008. Transcriptional regulation of cell polarity in EMT and cancer. Oncogene 27:6958–6969 [DOI] [PubMed] [Google Scholar]
- 6. Thiery JP, Huang R. 2005. Linking epithelial-mesenchymal transition to the well-known polarity protein Par6. Dev. Cell 8:456–458 [DOI] [PubMed] [Google Scholar]
- 7. Kasai H, Allen JT, Mason RM, Kamimura T, Zhang Z. 2005. TGF-β1 induces human alveolar epithelial to mesenchymal cell transition (EMT). Respir. Res. 6:56. [DOI] [PMC free article] [PubMed] [Google Scholar]
- 8. Levy L, Hill CS. 2006. Alterations in components of the TGF-β superfamily signaling pathways in human cancer. Cytokine Growth Factor Rev. 17:41–58 [DOI] [PubMed] [Google Scholar]
- 9. Siegel PM, Massague J. 2003. Cytostatic and apoptotic actions of TGF-β in homeostasis and cancer. Nat. Rev. Cancer 3:807–821 [DOI] [PubMed] [Google Scholar]
- 10. Barrios-Rodiles M, Brown KR, Ozdamar B, Bose R, Liu Z, Donovan RS, Shinjo F, Liu Y, Dembowy J, Taylor IW, Luga V, Przulj N, Robinson M, Suzuki H, Hayashizaki Y, Jurisica I, Wrana JL. 2005. High-throughput mapping of a dynamic signaling network in mammalian cells. Science 307:1621–1625 [DOI] [PubMed] [Google Scholar]
- 11. Ozdamar B, Bose R, Barrios-Rodiles M, Wang HR, Zhang Y, Wrana JL. 2005. Regulation of the polarity protein Par6 by TGF-β receptors controls epithelial cell plasticity. Science 307:1603–1609 [DOI] [PubMed] [Google Scholar]
- 12. Viloria-Petit AM, David L, Jia JY, Erdemir T, Bane AL, Pinnaduwage D, Roncari L, Narimatsu M, Bose R, Moffat J, Wong JW, Kerbel RS, O'Malley FP, Andrulis IL, Wrana JL. 2009. A role for the TGF-β-Par6 polarity pathway in breast cancer progression. Proc. Natl. Acad. Sci. U. S. A. 106:14028–14033 [DOI] [PMC free article] [PubMed] [Google Scholar]
- 13. Viloria-Petit AM, Wrana JL. 2010. The TGF-β-Par6 polarity pathway: linking the Par complex to EMT and breast cancer progression. Cell Cycle 9:623–624 [DOI] [PubMed] [Google Scholar]
- 14. Bose R, Wrana JL. 2006. Regulation of Par6 by extracellular signals. Curr. Opin. Cell Biol. 18:206–212 [DOI] [PubMed] [Google Scholar]
- 15. Etienne-Manneville S, Hall A. 2003. Cell polarity: Par6, aPKC, and cytoskeletal crosstalk. Curr. Opin. Cell Biol. 15:67–72 [DOI] [PubMed] [Google Scholar]
- 16. Joberty G, Petersen C, Gao L, Macara IG. 2000. The cell-polarity protein Par6 links Par3 and atypical protein kinase C to Cdc42. Nat. Cell Biol. 2:531–539 [DOI] [PubMed] [Google Scholar]
- 17. Lin D, Edwards AS, Fawcett JP, Mbamalu G, Scott JD, Pawson T. 2000. A mammalian PAR-3-PAR-6 complex implicated in Cdc42/Rac1 and aPKC signaling and cell polarity. Nat. Cell Biol. 2:540–547 [DOI] [PubMed] [Google Scholar]
- 18. Macara IG. 2004. Parsing the polarity code. Nat. Rev. 5:220–231 [DOI] [PubMed] [Google Scholar]
- 19. Aranda V, Haire T, Nolan ME, Calarco JP, Rosenberg AZ, Fawcett JP, Pawson T, Muthuswamy SK. 2006. Par6-aPKC uncouples ErbB2 induced disruption of polarized epithelial organization from proliferation control. Nat. Cell Biol. 8:1235–1245 [DOI] [PubMed] [Google Scholar]
- 20. Etienne-Manneville S, Hall A. 2001. Integrin-mediated activation of Cdc42 controls cell polarity in migrating astrocytes through PKCζ. Cell 106:489–498 [DOI] [PubMed] [Google Scholar]
- 21. Etienne-Manneville S, Manneville JB, Nicholls S, Ferenczi MA, Hall A. 2005. Cdc42 and Par6-PKCζ regulate the spatially localized association of Dlg1 and APC to control cell polarization. J. Cell Biol. 170:895–901 [DOI] [PMC free article] [PubMed] [Google Scholar]
- 22. Gao L, Joberty G, Macara IG. 2002. Assembly of epithelial tight junctions is negatively regulated by Par6. Curr. Biol. 12:221–225 [DOI] [PubMed] [Google Scholar]
- 23. Mu Y, Sundar R, Thakur N, Ekman M, Gudey SK, Yakymovych M, Hermansson A, Dimitriou H, Bengoechea-Alonso MT, Ericsson J, Heldin CH, Landstrom M. 2011. TRAF6 ubiquitinates TGF-β type I receptor to promote its cleavage and nuclear translocation in cancer. Nat. Commun. 2:330. [DOI] [PMC free article] [PubMed] [Google Scholar]
- 24. Nolan ME, Aranda V, Lee S, Lakshmi B, Basu S, Allred DC, Muthuswamy SK. 2008. The polarity protein Par6 induces cell proliferation and is overexpressed in breast cancer. Cancer Res. 68:8201–8209 [DOI] [PMC free article] [PubMed] [Google Scholar]
- 25. Etienne-Manneville S. 2008. Polarity proteins in migration and invasion. Oncogene 27:6970–6980 [DOI] [PubMed] [Google Scholar]
- 26. Wang HR, Zhang Y, Ozdamar B, Ogunjimi AA, Alexandrova E, Thomsen GH, Wrana JL. 2003. Regulation of cell polarity and protrusion formation by targeting RhoA for degradation. Science 302:1775–1779 [DOI] [PubMed] [Google Scholar]
- 27. Ono Y, Fujii T, Ogita K, Kikkawa U, Igarashi K, Nishizuka Y. 1989. Protein kinase C zeta subspecies from rat brain: its structure, expression, and properties. Proc. Natl. Acad. Sci. U. S. A. 86:3099–3103 [DOI] [PMC free article] [PubMed] [Google Scholar]
- 28. Eder AM, Sui X, Rosen DG, Nolden LK, Cheng KW, Lahad JP, Kango-Singh M, Lu KH, Warneke CL, Atkinson EN, Bedrosian I, Keyomarsi K, Kuo WL, Gray JW, Yin JC, Liu J, Halder G, Mills GB. 2005. Atypical PKCι contributes to poor prognosis through loss of apical-basal polarity and cyclin E overexpression in ovarian cancer. Proc. Natl. Acad. Sci. U. S. A. 102:12519–12524 [DOI] [PMC free article] [PubMed] [Google Scholar]
- 29. Fields AP, Frederick LA, Regala RP. 2007. Targeting the oncogenic protein kinase Cι signaling pathway for the treatment of cancer. Biochem. Soc. Trans. 35:996–1000 [DOI] [PubMed] [Google Scholar]
- 30. Fields AP, Regala RP. 2007. Protein kinase C iota: human oncogene, prognostic marker and therapeutic target. Pharmacol. Res. 55:487–497 [DOI] [PMC free article] [PubMed] [Google Scholar]
- 31. Frederick LA, Matthews JA, Jamieson L, Justilien V, Thompson EA, Radisky DC, Fields AP. 2008. Matrix metalloproteinase-10 is a critical effector of protein kinase Cι-Par6α-mediated lung cancer. Oncogene 27:4841–4853 [DOI] [PMC free article] [PubMed] [Google Scholar]
- 32. Patel R, Win H, Desai S, Patel K, Matthews JA, Acevedo-Duncan M. 2008. Involvement of PKC-ι in glioma proliferation. Cell Prolif. 41:122–135 [DOI] [PMC free article] [PubMed] [Google Scholar]
- 33. Regala RP, Thompson EA, Fields AP. 2008. Atypical protein kinase Cι expression and aurothiomalate sensitivity in human lung cancer cells. Cancer Res 68:5888–5895 [DOI] [PMC free article] [PubMed] [Google Scholar]
- 34. Regala RP, Weems C, Jamieson L, Copland JA, Thompson EA, Fields AP. 2005. Atypical protein kinase Cι plays a critical role in human lung cancer cell growth and tumorigenicity. J. Biol. Chem. 280:31109–31115 [DOI] [PubMed] [Google Scholar]
- 35. Gunaratne A, Benchabane H, Di Guglielmo GM. 2012. Regulation of TGF-β receptor trafficking and signaling by atypical protein kinase C. Cell Signal. 24:119–130 [DOI] [PubMed] [Google Scholar]
- 36. Kavsak P, Rasmussen RK, Causing CG, Bonni S, Zhu H, Thomsen GH, Wrana JL. 2000. Smad7 binds to Smurf2 to form an E3 ubiquitin ligase that targets the TGF-β receptor for degradation. Mol. Cell 6:1365–1375 [DOI] [PubMed] [Google Scholar]
- 37. Babwah AV, Dale LB, Ferguson SS. 2003. Protein kinase C isoform-specific differences in the spatial-temporal regulation and decoding of metabotropic glutamate receptor 1a-stimulated second messenger responses. J. Biol. Chem. 278:5419–5426 [DOI] [PubMed] [Google Scholar]
- 38. Rozen S, Skaletsky H. 2000. Primer3 on the WWW for general users and for biologist programmers. Methods Mol. Biol. 132:365–386 [DOI] [PubMed] [Google Scholar]
- 39. Spandidos A, Wang X, Wang H, Dragnev S, Thurber T, Seed B. 2008. A comprehensive collection of experimentally validated primers for polymerase chain reaction quantitation of murine transcript abundance. BMC Genomics 9:633 doi:10.1186/1471-2164-9-633 [DOI] [PMC free article] [PubMed] [Google Scholar]
- 40. Spandidos A, Wang X, Wang H, Seed B. PrimerBank: a resource of human and mouse PCR primer pairs for gene expression detection and quantification. Nucleic Acids Res. 38:D792–D799 [DOI] [PMC free article] [PubMed] [Google Scholar]
- 41. Wang X, Seed B. 2003. A PCR primer bank for quantitative gene expression analysis. Nucleic Acids Res. 31:e154. [DOI] [PMC free article] [PubMed] [Google Scholar]
- 42. Pfaffl MW. 2001. A new mathematical model for relative quantification in real-time RT-PCR. Nucleic Acids Res. 29:e45. [DOI] [PMC free article] [PubMed] [Google Scholar]
- 43. Vandesompele J, De Preter K, Pattyn F, Poppe B, Van Roy N, De Paepe A, Speleman F. 2002. Accurate normalization of real-time quantitative RT-PCR data by geometric averaging of multiple internal control genes. Genome Biol. 3:RESEARCH0034. [DOI] [PMC free article] [PubMed] [Google Scholar]
- 44. Saviozzi S, Cordero F, Lo Iacono M, Novello S, Scagliotti GV, Calogero RA. 2006. Selection of suitable reference genes for accurate normalization of gene expression profile studies in non-small cell lung cancer. BMC Cancer 6:200 doi:10.1186/1471-2407-6-200 [DOI] [PMC free article] [PubMed] [Google Scholar]
- 45. To C, Kulkarni S, Pawson T, Honda T, Gribble GW, Sporn MB, Wrana JL, Di Guglielmo GM. 2008. The synthetic triterpenoid 2-cyano-3,12-dioxooleana-1,9-dien-28-oic acid-imidazolide alters transforming growth factor beta-dependent signaling and cell migration by affecting the cytoskeleton and the polarity complex. J. Biol. Chem. 283:11700–11713 [DOI] [PMC free article] [PubMed] [Google Scholar]
- 46. Sumimoto H, Kamakura S, Ito T. 2007. Structure and function of the PB1 domain, a protein interaction module conserved in animals, fungi, amoebas, and plants. Sci. STKE 2007:re6. [DOI] [PubMed] [Google Scholar]
- 47. Henrique D, Schweisguth F. 2003. Cell polarity: the ups and downs of the Par6/aPKC complex. Curr. Opin. Genet. Dev. 13:341–350 [DOI] [PubMed] [Google Scholar]
- 48. Noda Y, Kohjima M, Izaki T, Ota K, Yoshinaga S, Inagaki F, Ito T, Sumimoto H. 2003. Molecular recognition in dimerization between PB1 domains. J. Biol. Chem. 278:43516–43524 [DOI] [PubMed] [Google Scholar]
- 49. Wilson MI, Gill DJ, Perisic O, Quinn MT, Williams RL. 2003. PB1 domain-mediated heterodimerization in NADPH oxidase and signaling complexes of atypical protein kinase C with Par6 and p62. Mol. Cell 12:39–50 [DOI] [PubMed] [Google Scholar]
- 50. Cheng PL, Lu H, Shelly M, Gao H, Poo MM. 2011. Phosphorylation of E3 ligase Smurf1 switches its substrate preference in support of axon development. Neuron 69:231–243 [DOI] [PubMed] [Google Scholar]
- 51. Ebisawa T, Fukuchi M, Murakami G, Chiba T, Tanaka K, Imamura T, Miyazono K. 2001. Smurf1 interacts with transforming growth factor-beta type I receptor through Smad7 and induces receptor degradation. J. Biol. Chem. 276:12477–12480 [DOI] [PubMed] [Google Scholar]
- 52. Stiess M, Bradke F. 2011. Controlled demolition: Smurf1 regulates neuronal polarity by substrate switching. Neuron 69:183–185 [DOI] [PubMed] [Google Scholar]
- 53. Hirai T, Chida K. 2003. Protein kinase Cζ (PKCζ): activation mechanisms and cellular functions. J. Biochem. 133:1–7 [DOI] [PubMed] [Google Scholar]
- 54. Li Q, Wang JM, Liu C, Xiao BL, Lu JX, Zou SQ. 2008. Correlation of aPKC-ι and E-cadherin expression with invasion and prognosis of cholangiocarcinoma. Hepatobiliary Pancreat. Dis. Int. 7:70–75 [PubMed] [Google Scholar]
- 55. Erdogan E, Lamark T, Stallings-Mann M, Lee J, Pellecchia M, Thompson EA, Johansen T, Fields AP. 2006. Aurothiomalate inhibits transformed growth by targeting the PB1 domain of protein kinase Cι. J. Biol. Chem. 281:28450–28459 [DOI] [PubMed] [Google Scholar]
- 56. Regala RP, Weems C, Jamieson L, Khoor A, Edell ES, Lohse CM, Fields AP. 2005. Atypical protein kinase Cι is an oncogene in human non-small cell lung cancer. Cancer Res. 65:8905–8911 [DOI] [PubMed] [Google Scholar]