

Abstract
Microbial sewage communities consist of a combination of human fecal microorganisms and nonfecal microorganisms, which may be residents of urban sewer infrastructure or flowthrough originating from gray water or rainwater inputs. Together, these different microorganism sources form an identifiable community structure that may serve as a signature for sewage discharges and as candidates for alternative indicators specific for human fecal pollution. However, the structure and variability of this community across geographic space remains uncharacterized. We used massively parallel 454 pyrosequencing of the V6 region in 16S rRNA genes to profile microbial communities from 13 untreated sewage influent samples collected from a wide range of geographic locations in the United States. We obtained a total of 380,175 high-quality sequences for sequence-based clustering, taxonomic analyses, and profile comparisons. The sewage profile included a discernible core human fecal signature made up of several abundant taxonomic groups within Firmicutes, Bacteroidetes, Actinobacteria, and Proteobacteria. DNA sequences were also classified into fecal, sewage infrastructure (i.e., nonfecal), and transient groups based on data comparisons with fecal samples. Across all sewage samples, an estimated 12.1% of sequences were fecal in origin, while 81.4% were consistently associated with the sewage infrastructure. The composition of feces-derived operational taxonomic units remained congruent across all sewage samples regardless of geographic locale; however, the sewage infrastructure community composition varied among cities, with city latitude best explaining this variation. Together, these results suggest that untreated sewage microbial communities harbor a core group of fecal bacteria across geographically dispersed wastewater sewage lines and that ambient water quality indicators targeting these select core microorganisms may perform well across the United States.
INTRODUCTION
At least 1.24 million miles of underground sewer lines (1) deliver sewage from homes and commercial buildings to more than 16,000 wastewater treatment facilities and 21,000 sanitary operating sewer systems in the United States. Although sanitary sewer lines normally isolate sewage from the surrounding environment, severe weather events, blockages, line breaks, power failures, inadequate design and construction, or vandalism can discharge disease-causing pathogens and other pollutants. Public exposure to untreated sewage can occur through contamination of nearby drinking water reservoirs, direct contact through recreational activities, or consumption of foods harvested from polluted water bodies. Even though exposure to untreated sewage remains a serious public health risk, very little is known about the microbial composition of this pollution source.
Massively parallel sequencing of DNA and high-density microarrays provide new tools for monitoring wastewater management and treatment. To date, most studies have focused on sludge and pilot scale bioreactors (2–4) or treated wastewater effluent (5). However, a small number of studies have provided important clues about the composition of untreated sewage microbial communities. A phylogenetic microarray analysis of marine water and sewage samples collected during a sewage spill indicated that sewage communities differ significantly from marine water, even when the marine water is mixed with small amounts of sewage (6). Pyrosequencing of samples from two wastewater treatment plants (WWTPs) in Milwaukee revealed that human feces, soil, and ambient water microorganisms (introduced through gray water, rainwater, and stormwater infiltration) could contribute to untreated sewage microbial communities and suggested that some community members may be resident in the sewer system (7, 8). The abundance and complexity of microbial life can vary greatly among external (i.e., ambient water and soil) and sewer system environments or from one individual host to the next (9–11), suggesting that untreated sewage microbial community structure may differ from one geographic location to another.
We characterized here the microbial community composition in untreated sewage from 13 different geographic locations in the United States using a next-generation sequencing technology. Our primary goal was to determine whether there was a core fecal signature of microorganisms among sewage influent locations. Secondarily, we wanted to determine whether the nonfecal organisms in sewage were common across geographically dispersed sites or were unique to each site. We explored patterns in each group over latitudinal and plant-parameter gradients.
MATERIALS AND METHODS
Sewage sample collection and DNA extraction.
Single-grab, primary influent sewage samples were collected from 13 different wastewater treatment facilities across the United States (Table 1). The latitudinal gradient of facilities ranged from 20.895 (Kihei, HI) to 47.662 (Seattle, WA). Facilities represented human populations ranging from 24,498 (Clarksburg, WV) to 1.2 × 10⁶ million (Elk Grove, CA) individuals based on population-served statistics. These facilities received between 4.3 (Kihei, HI) to 181 (Elk Grove, CA) million gallons per day of raw sewage. Samples were collected between 2006 and 2007. Multiple samples from Milwaukee, WI, were reported previously (8), and paired samples from 21 August 2007 were included in these analyses. Briefly, 500 ml of untreated primary influent sewage was collected from each facility and immediately stored on ice. Samples were then packed and shipped on ice overnight to Cincinnati, OH, for laboratory testing. Twenty-five milliliters of sewage from each sample was filtered through a 0.22-μm-pore-size Supor-200 filter (GE HealthCare); each filter was placed in a sterile 1.5-ml microtube and stored at −80°C until time of analysis (<6 months). DNA from filters was extracted using the DNA-EZ kit (GeneRite, New Brunswick, NJ) according to the manufacturer's instructions. The concentration and purity of each DNA extract was determined using a NanoDrop ND-1000 UV spectrophotometer (NanoDrop Technologies, Wilmington, DE).
Table 1.
Untreated sewage sample collection, geographic location, and facility demographics
| Sample code | Geographic location |
Facility demographics |
|||
|---|---|---|---|---|---|
| City | State | Latitude | Population served | Avg inflow (MG/day)b | |
| SE | Seattle | WA | 47.662 | 33,000 | 8.3 |
| DU | Duluth | MN | 46.759 | 62,000 | 40 |
| RL | Rutland | VT | 43.603 | 22,000 | 5.84 |
| JI | Jones Island | WI | 43.021 | 550,000a | 120 |
| SS | South Shore | WI | 42.887 | 550,000a | 135 |
| AL | Albany | NY | 42.630 | 100,000 | 25 |
| CL | Crystal Lake | IL | 42.212 | 38,600 | 5.8 |
| CB | Clarksburg | WV | 39.307 | 24,498 | 8.6 |
| EG | Elk Grove | CA | 38.592 | 1,200,000 | 168 |
| TU | Tulsa | OK | 36.236 | 160,000 | 42.6 |
| LV | Las Vegas | NV | 36.133 | 815,207 | 68 |
| TA | Tallahassee | FL | 30.392 | 170,000 | 27.5 |
| KH | Kihei | HI | 20.895 | 41,720 | 4.3 |
1.1 million people are served by these two treatment plants, and each plant receives approximately half of the flow.
Inflow values are expressed in millions of gallons per day (MG/day).
DNA pyrosequencing.
Purified DNA from each sewage sample served as a template for preparation of amplicon libraries from the hypervariable V6 region of the 16S rRNA coding region prior to pyrosequencing on a Roche GS FLX system. A cocktail of five primers at the 5′ end and four primers at the 3′ end directed the amplification of V6 16S rRNA regions to help capture the full diversity of bacterial 16S rRNA sequences (10, 12). Fused primers that contained a unique five-nucleotide barcode between the 454 adapter-A sequence and the V6 16S rRNA primers were used to multiplex samples. Triplicate reactions for each PCR library minimized the impact of PCR errors generated during early cycles of amplification. The resulting amplicon libraries were purified with a Qiagen (Valencia, CA) MinElute PCR purification kit and were visualized on an Agilent Bioanalyzer, model 2100. Emulsion PCR was performed using the Roche protocols. The mixture of different samples was then deposited in a picotiter plate for GS-FLX pyrosequencing.
Quality trimming, taxonomic assignments, and OTU clustering.
Each pyrotag, i.e., sequence read, underwent a series of quality filters to trim and/or remove poor-quality data. Pyrotags were removed from the data set if the read length was <50 nucleotides (the length of the shortest V6 sequence in the reference base), if the read contained any ambiguous base, if there were any errors in the proximal primer sequence or barcode, if the average quality score was <30, or if the distal primer was not present (13). Pyrosequencing of 13 primary influent sewage samples yielded 452,041 pyrotags with read lengths ranging from 51 to 125 bp. Trimming filters identified 71,866 (16%) pyrotags as poor quality; these were removed from the data set, resulting in 380,175 high-quality pyrotags. An additional 68 pyrotags (0.015% of all reads) did not display significant matches to V6 16S rRNA regions in the SILVA database (14), presumably because they have no valid match to the reference database, they correspond to nonribosomal regions, or they are chimeric molecules. After deconvoluting the high-quality pyrotags into original sample bins using the five-nucleotide barcode keys, the Global Assignment of Sequence Taxonomy (GAST) algorithm (15), which relies upon the SILVA database (14) as a reference, assigned taxonomy to each read. This analysis excluded all nonbacterial and organellar sequences. Single-linkage preclustering with average-linkage clustering (16) identified operational taxonomic units (OTUs) at a 3% threshold.
Classification of OTUs into fecal, sewage infrastructure, and transient groups.
We used SourceTracker, a Bayesian approach for estimating proportions of a community containing mixed sources (17), to estimate the proportion of fecal, sewage infrastructure (nonfecal), and transient derived OTUs in our sewage communities. We grouped the V6 sequence data sets from the current sewage study (n = 13) and from human (n = 48) and cattle (n = 30) fecal samples (11, 18, 19) into OTUs and used these OTU distributions as input for SourceTracker. We included cattle because data for this additional fecal source were available (19). To normalize sequencing depth across samples, we randomly selected 17,000 sequences (corresponding to the number of sequences in the smallest data set) from each sample. For the human and cattle fecal data sets, only 25 samples from each source contained more than 17,000 sequences; the remaining samples were discarded from analysis. SourceTracker analyses were used with default settings without subsampling (all 17,000 pyrotags were used in the sample by OTU matrix) with α set to 0.001. To identify “fecal” and “sewage infrastructure” OTUs, independent SourceTracker runs analyzed either the cattle or human data sets as source communities with the 13 sewage samples serving as sink communities. SourceTracker produces values for each OTU in each sink sample, indicating the probability that the OTU was derived from the source and the sink community. The mean probability value (MPV) across all 13 sewage samples was then calculated for each OTU. OTUs with an MPV of >25% of being from either the cattle or human fecal source community were considered to be “fecal.” A fairly low cutoff (25%) was chosen for classification purposes due to the high variability among both the human and cattle fecal samples. Likewise, all OTUs not considered fecal and that had an MPV of ≥25% for the sewage community were considered to be from “sewage infrastructure.” All OTUs not classified as fecal or sewage infrastructure were considered transient. Core OTUs are also reported for the fecal and sewage infrastructure groups and were defined as any OTUs present after subsampling in all 13 sewage samples.
Network analysis.
A network analysis approach illustrated the relationship between the latitudinal position of each wastewater treatment facility and its microbial community OTU structure (19). Cytoscape (20), version 2.7, using the edge-weighted spring embedded model (21) described each bacterial network. The latitude coordinates for each wastewater treatment facility corresponded to (i) >41.000 (n = 7), (ii) between 32.000 and 40.000 (n = 4), and (iii) <31.000 (n = 2). Network analyses of reduced data sets aided in pattern visualization of all high-quality pyrotags binned into 3% OTUs and then sorted by OTU abundance (from most abundant to least abundant) for each sewage sample. A running sum of total pyrotags for each sewage sample was calculated, and only the OTUs present in the top 95% of the respective sample data set were used to generate network images. OTUs present in the top 95% of one fecal sample but not in another were added back into all samples. The statistical significance of the network sample distribution patterns was assessed with t tests comparing within-group versus among-group plot distances for latitude groupings: ≥41.000 and <41.000.
Other statistical analyses.
The Chao1 (22) method calculated with mother (23) was used to estimate the richness of each microbial community. Pearson R calculations were carried out in Microsoft Excel across all pairwise comparisons between wastewater treatment plants. Bacterial community composition similarity between plants was correlated to the absolute difference in population size, the absolute difference in latitude, and the absolute difference in average influent flow. A permutation-based hypothesis testing algorithm, analysis of similarity (ANOSIM) (24, 25), was used to characterize the degree of similarity between north (≥41.000) and south (<41.000) samples for “fecal” and “sewage infrastructure” OTU assignments within Actinobacteria, Bacteroidetes, Firmicutes, Alphaproteobacteria, Betaproteobacteria, Deltaproteobacteria, Gammaproteobacteria, and all remaining phyla groupings. The similarity percentages (SIMPER) program was used to identify which OTUs contribute most to geographic differences between “sewage infrastructure” OTUs based on north and south groupings (25). Nonmetric multidimensional scaling plots (NMDS) and a cluster dendrogram based upon Bray-Curtis bacterial community composition similarities described community composition comparisons, including total community structure and community structure differences between north and south “sewage infrastructure” OTUs of key phyla, including Bacteroidetes, Firmicutes, Betaproteobacteria, and Gammaproteobacteria. A stress level of <0.20 was considered acceptable for NMDS plots. Primer6 software (Ivybridge, United Kingdom) was used to compute ANOSIM, SIMPER, and NMDS analyses.
Sequence data submission.
Pyrotag sequences from sewage samples for 12 cities, as well as previously published Milwaukee sewage and cattle and human fecal data sets (Table 2), are available through VAMPS (http://www.vamps.mbl.edu). Sequences for the 13 samples from 12 cities are also available from the Sequence Read Archive (SRA) under study accession number SRP018584, with sample accession numbers SRX235300 to -312.
Table 2.
Summary of V6 pyrotag counts and richness estimates
| Sample code | No. of V6 tagsa |
Richness estimateb (95% CI) (Chao1) | |
|---|---|---|---|
| Total | Unique | ||
| SE | 28,798 | 4,615 | 2,585 (2,366–2,855) |
| DU | 23,409 | 4,011 | 2,372 (2,190–2,597) |
| RL | 25,639 | 4,191 | 2,332 (2,144–2,565) |
| JI | 27,883 | 4,350 | 3,957 (3,612–4,372) |
| SS | 33,181 | 4,654 | 3,164 (2,947–3,423) |
| AL | 32,876 | 4,837 | 2,682 (2,482–2,925) |
| CL | 19,560 | 3,751 | 2,719 (2,475–3,019) |
| CB | 27,103 | 4,911 | 2,609 (2,427–2,830) |
| EG | 26,587 | 4,457 | 2,458 (2,251–2,715) |
| TU | 26,119 | 4,554 | 2,654 (2,439–2,920) |
| LV | 44,351 | 5,594 | 2,366 (2,181–2,595) |
| TA | 38,951 | 5,605 | 3,196 (2,951–3,494) |
| KH | 29,677 | 5,738 | 3,150 (2,889–3,470) |
Trim reads that passed quality controls.
Richness estimates for OTUs in each sample, determined with a 3% width. CI, confidence interval.
RESULTS
Taxonomy and diversity.
Of the high-quality bacterial V6 16S rRNA pyrotags (n = 380,175), GAST annotated 99.9% to the phylum level, 97.0% to the order level, 96.0% to the family level, 80.0% to the genus level, and 3.9% to the species level. The most abundant taxa included Proteobacteria (62.2%), Firmicutes (20.6%), Bacteroidetes (12.5%), Actinobacteria (1.7%), and Fusobacteria (1.2%). The Proteobacteria were dominated by Gammaproteobacteria (38.1% of all pytrotags) and Betaproteobacteria (18.7%). Epsilonproteobacteria (2.6%), Deltaproteobacteria (1.6%), and Alphaproteobacteria (1.1%) were also present. Figure 1 depicts GAST taxon assignments at the phylum level for each sewage bacterial community. Table 2 summarizes the total number of sequences, the number of unique sequences, and Chao1 richness values at a 3% cluster value for each sewage bacterial community. The number of unique OTUs in a sewage sample ranged from 1,384 (Elk Grove, CA) to 1,921 (Jones Island, WI).
Fig 1.

Phylum relative abundance box plot for all phyla from primary influent sewage samples as determined by Global Alignment Sequence Taxonomy assignments. Proteobacteria are broken down as follows: Gammaproteobacteria (38.1% of all pytrotags), Betaproteobacteria (18.7%), Epsilonproteobacteria (2.6%), Deltaproteobacteria (1.6%), and Alphaproteobacteria (1.1%). Phyla are colored by their respective phylum (see inset color key). The boundary of the box closest to zero indicates the 25th percentile, the line within the box represents the median, and the boundary of the box farthest from zero indicates the 75th percentile. Whiskers above and below the box indicate the 10th and 90th percentiles. A “●” symbol denotes outlier measurements.
Fecal, sewage infrastructure, and transient group assignments.
We used a subsampled data set (17,000 sequences per sample) to explore the origin of different OTUs in sewage bacterial communities. Of the 221,000 total pyrotag sequences in the subsampled data set, single-linkage preclustering identified 5,010 OTUs (3% width). Only 12.1% (n = 26,797) of the sequences were identified as fecal in origin, accounting for 2.6% (n = 132) of the total OTUs (Table 3). The majority of these (54%) were classified as Bacteroidales (17%) and Clostridiales (37%). A much larger portion of the sequences (81.4%; n = 179,809) and OTUs (18.8%; n = 942) corresponded to the sewage infrastructure group and these primarily were classified to Gammaproteobacteria (43%) and, to a lesser extent, Betaproteobacteria (22%). The transient group included only 6.5% (n = 14,394) of the sequences but accounted for the bulk of the OTUs (78.6%; n = 3,936). The most common of the transient OTUs occurred in only 5 of the 13 samples.
Table 3.
Classification of subsampled V6 pyrotags into fecal, sewage infrastructure, and transient groupsa
| Sample code | Fecal |
Sewage infrastructure |
Transient |
|||
|---|---|---|---|---|---|---|
| No. | % | No. | % | No. | % | |
| SE | 2,376 | 14.0 | 14,060 | 82.7 | 564 | 3.3 |
| DU | 1,295 | 7.6 | 12,518 | 73.6 | 3,187 | 18.7 |
| RL | 2,365 | 13.9 | 14,100 | 82.9 | 535 | 3.1 |
| JI | 3,100 | 18.2 | 12,218 | 71.9 | 1,682 | 9.9 |
| SS | 2,540 | 14.9 | 13,573 | 79.8 | 887 | 5.2 |
| AL | 1,046 | 6.2 | 15,253 | 89.7 | 701 | 4.1 |
| CL | 2,146 | 12.6 | 13,780 | 81.1 | 1,074 | 6.3 |
| CB | 2,225 | 13.1 | 14,066 | 82.7 | 709 | 4.2 |
| EG | 1,278 | 7.5 | 14,936 | 87.9 | 786 | 4.6 |
| TU | 730 | 4.3 | 15,121 | 88.9 | 1,149 | 6.8 |
| LV | 1,802 | 10.6 | 14,067 | 82.7 | 1,131 | 6.7 |
| TA | 1,022 | 6.0 | 14,961 | 88.0 | 1,017 | 6.0 |
| KH | 4,872 | 28.7 | 11,156 | 65.6 | 972 | 5.7 |
| All samples | 26,797 | 12.1 | 179,809 | 81.4 | 14,394 | 6.5 |
“No.” indicates the number of subsampled V6 pyrotags.
Characterization of core sewage bacterial community members.
The 13 sewage influent data sets had a “sewage core” of 153 OTUs shared among all of the samples that accounted for 70.1% of the subsampled sequences. Core OTUs (n = 70) from the fecal grouping resolved to the Firmicutes, Bacteroidetes, Actinobacteria, Proteobacteria, and Verrucomicrobia phyla (Table 4). Within the “fecal” group, OTUs from the genera Bacteroides, Bautia, Roseburia, and Faecalibacterium, along with unknown genera from the Lachnospiraceae and Ruminococcaceae families, dominated the microbial community. A sewage infrastructure core group of 83 shared OTUs classified to the Proteobacteria, Firmicutes, Bacteroidetes, Actinobacteria, Tenericutes, and Fusobacteria phyla (Table 4). Within the sewage infrastructure core, the genera Acinetobacter, Aeromonas, Cloacibacterium, Tolumonas, Enhydrobacter, and Acrobacter, along with unknown genera from Comamonadaceae family, were the most prominent, making up 56% of the sequences associated with the core OTUs and 40% of all sequences recovered from sewage.
Table 4.
Core OTUs and pyrotags in fecal and sewage infrastructure groupsa
| Group and phylum | Most resolved taxonomyb | In core |
|
|---|---|---|---|
| No. of OTUs | % pyrotag | ||
| Fecal | |||
| Actinobacteria | Bifidobacterium | 5 | 0.99 |
| Others | 1 | 0.11 | |
| Bacteroidetes | Bacteroides | 9 | 1.84 |
| Others | 6 | 0.96 | |
| Firmicutes | Lachnospiraceae NA | 13 | 1.68 |
| Blautia | 7 | 1.36 | |
| Roseburia | 1 | 1.25 | |
| Ruminococcaceae NA | 6 | 1.06 | |
| Faecalibacterium | 6 | 1.29 | |
| Others | 12 | 2.29 | |
| Proteobacteria | Others | 4 | 1.45 |
| Verrucomicrobia | Akkermansia | 1 | 0.20 |
| Totals (core fecal) | Sewage core | 70 | 14.48 |
| Fecal classified | 83.76 | ||
| Total data set | 10.16 | ||
| Sewage infrastructure | |||
| Actinobacteria | Dermacoccus | 1 | 0.16 |
| Bacteroidetes | Bacteroides | 3 | 1.44 |
| Cloacibacterium | 3 | 4.56 | |
| Others | 5 | 2.24 | |
| Firmicutes | Trichococcus | 1 | 1.88 |
| Streptococcus | 2 | 2.17 | |
| Peptostreptococcaceae NA | 3 | 1.25 | |
| Others | 13 | 2.46 | |
| Fusobacteria | Leptotrichiaceae NA | 1 | 0.88 |
| Proteobacteria | Betaproteobacteria NA | 3 | 3.14 |
| Comamonadaceae NA | 3 | 8.34 | |
| Propionivibrio | 2 | 1.99 | |
| Arcobacter | 1 | 2.95 | |
| Aeromonas | 5 | 10.23 | |
| Tolumonas | 3 | 3.16 | |
| Enterobacteriaceae NA | 4 | 1.92 | |
| Acinetobacter | 6 | 24.15 | |
| Enhydrobacter | 1 | 3.08 | |
| Pseudomonas | 2 | 2.39 | |
| Others | 21 | 7.10 | |
| Tenericutes | Mollicutes NA | 1 | 0.03 |
| Totals (core infrastructure) | Sewage core | 83 | 85.52 |
| Infrastructure classified | 74.93 | ||
| Total data set | 60.97 | ||
“Core” indicates OTUs and pyrotags shared across all 13 sewage samples. “Totals” were calculated from subsampled data sets containing a total of 5,010 OTUs from 221,000 pyrotags.
“Others” indicate only taxa contributing >1% to the sewage core or those that were the sole representative of a phylum are listed. “Fecal others” include Collinsella, Parabacteroides, Prevotella, Alistipes, Streptococcus, Anaerostipes, Coprococcus, Dorea, Lachnospira, Peptostreptococcaceae NA, Oscillibacter, Subdoligranulum, Erysipelotrichaceae NA, Coprobacillus, Parasutterella, Gammaproteobacteria NA, and Enterobacteriaceae NA. “Infrastructure others” include Paludibacter, Parabacteroides, Flavobacterium, Lactobacillales NA, Lactobacillus, Lactococcus, Clostridium, Lachnospiraceae NA, Butyrivibrio, Ruminococcaceae NA, Veillonellaceae NA, Anaerosinus, Megamonas, Phascolarctobacterium, Catenibacterium, Rhizobiales NA, Acidovorax, Aquabacterium, Delftia, Hydrogenophaga, Aquaspirillum, Laribacter, Neisseria, Uruburuella, Rhodocyclaceae NA, Dechloromonas, Propionivibrio, Thauera, Desulfobulbus, Desulfovibrio, Helicobacteraceae NA, Gammaproteobacteria NA, Klebsiella, Cellvibrio, and Xanthomonadaceae NA.
Sewage bacterial community composition patterns.
We explored the relationship between several treatment plant characteristics and the bacterial community composition similarity among plants. A cluster analysis of all OTUs revealed two prominent treatment plant community groups (Fig. 2). Correlations between bacterial community composition similarity and plant characteristics indicated that latitude (Pearson r = 0.45) was more related to the composition observed than either contributing population size (Pearson r = 0.06) or average inflow (Pearson r = −0.08).
Fig 2.

Cluster dendrogram of community composition similarity (Bray-Curtis, average neighbor clustering) based on OTU distributions (all OTUs) among sewage influent samples.
Since latitude was most related to the variation among the sewage bacterial communities, we further explored this relationship. The sewage infrastructure and fecal groups were divided into two latitudinal categories: (i) <41.000 (south) and (ii) ≥41.000 (north). A network analysis identified a significant difference between latitude groupings for the sewage infrastructure OTUs (P = 0.02) but not for the fecal OTUs (P > 0.05) (Fig. 3). ANOSIM values were used to test OTU distributions within phyla that significantly contributed to the observed latitude differences. A significant difference (P ≤ 0.01) emerged for sewage infrastructure Bacteroidetes (r = 0.574) and Firmicutes (r = 0.47; see Fig. 4 for NMDS plots) but not for other phyla (r ≤ 0.325). For the “fecal” group, no phyla generated an ANOSIM r value of >0.20, suggesting that there was no significant difference between these fecal north and south communities. A SIMPER analysis identified the OTUs most contributing to the differences between the north and south defined groups in the “sewage infrastructure” communities. Among the top 10 contributing OTUs were those that were nearly exclusive to one geographic region (e.g., a Flavobacterium and a Trichococcus; Table 5). Also, among these top 10 OTUs, were multiple OTUs within a single highly abundant genus such as Cloacibacterium and Acinetobacter that had opposite geographic preferences.
Fig 3.
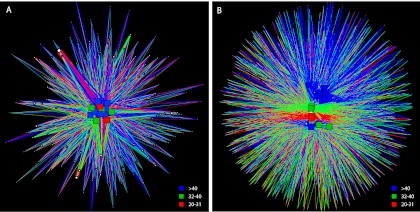
Network analysis of the top 95% of all high-quality V6 pyrotags after binning into OTUs and sorting by OTU abundance (from most abundant to least abundant) for fecal community (A) and sewage infrastructure community (B). Squares represent untreated sewage influent samples, and circles represent individual OTUs. The size of each circle indicates the OTU abundance. The line color indicates the presence of an OTU in a latitudinal group (blue, >40; green, between 32 and 40; red, between 20 and 31), and the line width indicates the abundance of an OTU in a sample.
Fig 4.
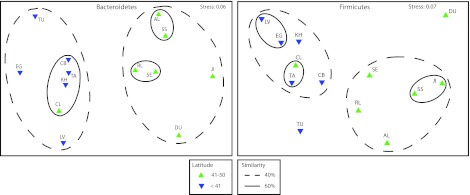
Nonmetric multidimensional scaling plots of sewage-infrastructure classified Bacteroidetes (left) and Firmicutes (right) community composition in northern (green, 41 to 50) and southern (blue, <41) latitudinal groupings. Solid (≥60%) and dashed (≥40%) lines indicate percent similarities between grouped samples.
Table 5.
Identification and ranking of OTU contributions to latitudinal differences in sewage infrastructure communities with SIMPERa
| Phylum | Most resolved taxonomy | Higher abundance |
Fold differenceb | Rankc | |
|---|---|---|---|---|---|
| North | South | ||||
| Bacteroidetes | Cloacibacterium | x | 1.85 | 10 | |
| Cloacibacterium | x | 3.55 | 7 | ||
| Flavobacterium | x | 24.31 | 5 | ||
| Firmicutes | Streptococcus | x | 3.32 | 6 | |
| Trichococcus | x | 10.08 | 3 | ||
| Proteobacteria | Acinetobacter | x | 1.85 | 1 | |
| Acinetobacter | x | 1.9 | 2 | ||
| Comamonadaceae | x | 1.33 | 4 | ||
| Enhydrobacter | x | 1.23 | 8 | ||
| Pseudomonas | x | 2.03 | 9 | ||
The top 10 OTUs contributing to the difference between north and south groups are listed.
That is, the fold difference in abundance between the north and south groupings.
That is, the number assignment between 1 and 10, where 1 indicates the OTU with the most influence on differences between the north and south groupings.
DISCUSSION
General characteristics of the untreated sewage microbial community.
Untreated sewage samples tested in this study consisted of a complex array of taxa dominated by Gammaproteobacteria, Betaproteobacteria, Firmicutes, and Bacteroidetes. The high abundance of nonfecal associated taxa/OTUs and the consistency of these taxa/OTUs among all 13 sewage samples and in a previous study of sewage influent from a single city over time (7) suggests that there may be resident microbial communities in these pipe-based systems. It is known that microbial communities are present within biofilms on pipe surface and in deposited sediments along the pipe system (26). Frequent sloughing and/or resuspension could be the mechanism of consistent delivery of these organisms to WWTPs and explain the consistent patterns observed in our community data. Either gray water, the non-sewage-containing wastewater from households, or rare fecal taxa could be the seeding source for these pipe communities. Alternatively, gray water may be delivering high loads of bacteria directly to the WWTPs, making it the primary source of the cosmopolitan nonfecal bacteria that we identified. Environmental sources such as ambient water and soil likely also contribute microorganisms to the untreated wastewater community, but at lower densities these contributions may not have a large influence on the community structure overall. Further research will be needed to understand the main sources of the nonfecal component of sewage influent.
Bacteroidetes and Firmicutes are the primary bacterial members in human fecal samples (27, 28) but were much less prevalent than Proteobacteria in our geographically dispersed sewage samples. Even under a broad classification scheme, these data suggest that only a small portion of the untreated sewage microbial community consists of feces-derived bacteria. This notion was solidified by our SourceTracker-based classification of OTUs, which identified only 4.3 to 28.7% of the sequences in a sample as being feces derived. These data, combined with the time series sewage influent data from Milwaukee, WI (6, 7), provide strong evidence that the bacterial community of sewage influent arriving at U.S. treatment plants is primarily of nonfecal origin.
Activated sludge samples collected from wastewater facilities show a trend similar to that of our sewage influent samples, where phylotypes related to nonfecal sources numerically dominate over human fecal phylotypes (2). Human fecal microorganisms, being primarily anaerobes, are not likely to have high survival rates after being discharged into a subterranean sewage line environment. The lower levels of fecal taxa in sewage influent may represent these persistence traits and reflect selective pressures in pipe infrastructure that do not favor anaerobic fecal microorganisms (29). It is apparent that the selective pressures within sewage lines and the continuous mixing of fecal and nonfecal bacterial communities are forces that lead to a novel sewage microbial community structure that does not resemble the human fecal community.
Core taxa in the untreated sewage microbial community.
Approximately 70% of all pyrotags grouped into shared OTUs across the 13 untreated sewage samples. This illustrates the high degree of bacterial conservation across sites and, given the relatively low number of unique OTUs (n = 153; comprising 1.7% of all OTUs) making up this 70%, demonstrates that the numerically dominant community members are consistently dominant across sites. It is likely many other lower abundance OTUs were shared across all 13 WWTPs, but because of the community sampling depth, were not captured in some of the communities. However, given the moderate sequencing depth of this effort, these data are likely a good representation of the overall community structure.
The fecal-classified pyrotags exhibited a high degree of similarity across samples (73.7% Morisita-Horn), with many OTUs being shared across all 13 WWTPs (Table 4). This result may seem surprising considering the growing body of evidence that human fecal microbial communities can vary greatly from one individual to another (11, 28, 30, 31). However, the existence of a core fecal community implies that the blending of fecal material from thousands of individuals has a normalizing effect and may represent a core human fecal microbiome. A closer examination of members of the family Lachnospiraceae within this same data set supported this hypothesis, where the most common, but not necessarily the most abundant sequences in individual human samples were the most dominant Lachnospiraceae sequences in WWTP influent across the 13 cities. This same pattern has been reported in a survey of fecal indicator genetic markers measured by quantitative real-time PCR commonly used to identify fecal pollution in recreational waters, where the distribution of a particular marker remained very consistent in 54 untreated wastewater samples collected from 39 different locations across the United States (32, 33).
A lower percentage of infrastructure-classified OTUs, compared to the fecal-classified OTUs, were conserved across all samples; however, the sequences from these conserved OTUs represented 75% of all sequences present in the samples (Table 4). Among the dominant OTUs in this group were those classified as Acinetobacter, Aeromonas, Trichococcus, Arcobacter, and Pseudomonas, which were reported previously as consistent members of sewage influent in Milwaukee, WI, samples spanning 3 years and hypothesized to be residents of the sewer infrastructure (8). The consistency of the dominant OTUs is especially surprising given the wide geographic variety and therefore ambient environmental sources, climate, and sewer system configurations across our sample sites. Although many of these sewage infrastructure core taxa have been isolated from natural soil and water environments (7, 34–36), they are rarely detected in large-scale classifications of these communities (37–39). Sewer infrastructure is a relatively new environment compared to soil and water. Exploration of community structure, selection, and dynamics in this built environment would be of interest given the consistencies we have observed across all 13 cities.
Latitude as a predictor of untreated sewage microbial community structure.
In the present study, we illustrated that the majority of bacterial sequences from sewage influent represent a shared or core sewage community. Despite this unexpected similarity, differences in the distribution of OTUs across samples were apparent. We hypothesized that the differences among samples would correlate with variations in the nonfecal community members since the local ambient environment and climate would influence both source microorganisms entering the system and resident microorganisms in the sewer system. Network analysis and community similarity correlations suggested that this was the case. The distribution of fecal OTUs was more consistent than that of the sewage infrastructure portion of the community, whose distribution correlated with a latitude gradient of the sample locations.
A closer examination of the OTUs contributing to the observed north-south community separation for the infrastructure community revealed that Acinetobacter assigned sequences contributed two OTUs to the top 10 distinguishing OTUs group, and the OTUs showed opposing geographic trends. A previous study by our laboratory noted that two Acinetobacter V6 16S rRNA sequences exhibited opposing temporal abundance patterns associated with seasonal trends in a single sewage system (8). Cloacibacterium also contributed two OTUs to the top 10 distinguishing group, but in contrast to Acinetobacter, both were more prevalent in southern sewage systems. Little is known about Cloacibacterium. The genus, described in 2006, was isolated from untreated wastewater in Norman, OK (latitude 35.223), but despite attempts, the investigators were not able to isolate it from human feces (40). Together, these results highlight our general lack of knowledge of sewage microbial communities, suggest the most abundant organisms in sewer systems exhibit both spatial and temporal dynamics, and beg the question of what forces drive these sewage community and population dynamics.
Implications for wastewater management and water quality applications.
Emerging molecular technologies such as high-throughput DNA sequencing will soon provide water quality managers with new tools to identify sewage pollution in recreational waters (6, 7). The comprehensive profiles of untreated sewage bacterial communities generated in the present study will serve as an important reference database to test currently available methods, as well as design novel alternative approaches. In order for any of these methods to be effective, target DNA sequences must not only be abundant in sewage but also be detectable across a broad geographic range. The results presented here indicate that the fecal portion of the untreated sewage community remains relatively stable across a wide range of locations, warranting the future testing of these methods on a larger scale.
Novel information about the sewage infrastructure portion of the untreated sewage community will also benefit future water quality applications. Even though the sewage infrastructure group can vary in diversity and composition across a latitudinal gradient, data indicate that ca. 60% of all sewage influent pyrotags were both assigned to the sewage infrastructure group and shared across all samples (Table 4). The predictable nature of this infrastructure-derived portion of the community and its striking difference from the community composition typically found in ambient water and soil communities could serve as the basis for the development of sewer infrastructure indicators that could serve as adjunct indicators to fecal organisms. Multiple indicators, particularly ones that target dominant community members, could improve sensitivity and reliability of investigations for sewage releases into the environment.
The combination of high-throughput DNA sequencing with informatics analysis allowed for the characterization of feces- and sewage infrastructure-derived microorganisms in untreated sewage samples across a latitudinal gradient. The findings presented here have important implications for future wastewater management and water quality applications. However, additional research is needed to determine whether trends identified in the present study remain consistent over time, among a larger and international group of wastewater treatment systems, throughout the wastewater treatment process, as well as after discharge into local water bodies.
ACKNOWLEDGMENTS
Information has been subjected to the U.S. Environmental Protection Agency (USEPA)'s peer and administrative review and has been approved for external publication. Any opinions expressed here are those of the author(s) and do not necessarily reflect the official positions and policies of the USEPA. Any mention of trade names or commercial products does not constitute endorsement or recommendation for use.
Funding for this project was provided by National Institutes of Health grants 1 R21 AI076970-02 and 1 R21 AI076970-S to S.L.M.
Footnotes
Published ahead of print 22 February 2013
REFERENCES
- 1. US Environmental Protection Agency 2004. Report to Congress: impacts and control of CSOs and SSOs EPA 833 R-04–001. US Environmental Protection Agency, Washington, DC [Google Scholar]
- 2. Sanapareddy N, Hamp TJ, Gonzalez LC, Hilger HA, Fodor AA, Clinton SM. 2009. Molecular diversity of a North Carolina wastewater treatment plant as revealed by pyrosequencing. Appl. Environ. Microbiol. 75:1688–1696 [DOI] [PMC free article] [PubMed] [Google Scholar]
- 3. Wang X, Hu M, Xia Y, Wen X, Ding K. 2012. Pyrosequencing analysis of bacterial diversity in 14 wastewater treatment systems in China. Appl. Environ. Microbiol. 78:7042–7047 [DOI] [PMC free article] [PubMed] [Google Scholar]
- 4. Xia SQ, Duan LA, Song YH, Li JX, Piceno YM, Andersen GL, Alvarez-Cohen L, Moreno-Andrade I, Huang CL, Hermanowicz SW. 2010. Bacterial community structure in geographically distributed biological wastewater treatment reactors. Environ. Sci. Technol. 44:7391–7396 [DOI] [PubMed] [Google Scholar]
- 5. Ye GB, Wang SF, Jiang LJ, Xiao X, Wang FP, Noakes J, Zhang CL. 2009. Distribution and diversity of Bacteria and Archaea in marine sediments affected by gas hydrates at Mississippi Canyon in the Gulf of Mexico. Geomicrobiol. J. 26:370–381 [Google Scholar]
- 6. Dubinsky EA, Esmaili L, Hulls JR, Cao Y, Griffith JF, Andersen GL. 2012. Application of phylogenetic microarray analysis to discriminate sources of fecal pollution. Environ. Sci. Technol. 46:4340–4347 [DOI] [PubMed] [Google Scholar]
- 7. McLellan SL, Huse SM, Mueller-Spitz SR, Andreishcheva EN, Sogin ML. 2010. Diversity and population structure of sewage-derived microorganisms in wastewater treatment plant influent. Environ. Microbiol. 12:378–392 [DOI] [PMC free article] [PubMed] [Google Scholar]
- 8. VandeWalle JL, Goetz GW, Huse SM, Andreischcheva EN, Sogin ML, Hoffmann RG, Yan K, McLellan SL. 2012. Acinetobacter, Aeromonas, and Trichococcus dominate the microbial community within urban sewer infrastructure. Environ. Microbiol. 14:2538–2552. [DOI] [PMC free article] [PubMed] [Google Scholar]
- 9. Lozupone CA, Knight R. 2007. Global patterns in bacterial diversity. Proc. Natl. Acad. Sci. U. S. A. 104:11436–11440 [DOI] [PMC free article] [PubMed] [Google Scholar]
- 10. Sogin ML, Morrison HG, Huber JA, Welch DM, Huse SM, Neal PR, Arrieta JM, Herndl GJ. 2006. Microbial diversity in the deep sea and the underexplored “rare biosphere.” Proc. Natl. Acad. Sci. U. S. A. 103:12115–12120 [DOI] [PMC free article] [PubMed] [Google Scholar]
- 11. Turnbaugh PJ, Hamady M, Yatsunenko T, Cantarel BL, Duncan A, Ley RE, Sogin ML, Jones WJ, Roe BA, Affourtit JP, Egholm M, Henrissat B, Heath AC, Knight R, Gordon JI. 2009. A core gut microbiome in obese and lean twins. Nature 457:480–485 [DOI] [PMC free article] [PubMed] [Google Scholar]
- 12. Huber JA, Welch DBM, Morrison HG, Huse SM, Neal PR, Butterfield PR, Sogin ML. 2007. Microbial population structures in the deep marine biosphere. Science 318:97–100 [DOI] [PubMed] [Google Scholar]
- 13. Huse SM, Huse SM, Morrison HG, Sogin ML, Welch DM. 2007. Accuracy and quality of massively parallel DNA pyrosequencing. Genome Biol. 8:R143. [DOI] [PMC free article] [PubMed] [Google Scholar]
- 14. Pruesse E, Quast C, Knittel K, Fuchs BM, Ludwig W, Peplies J, Glockner FO. 2007. SILVA: a comprehensive online resource for quality checked and aligned ribosomal RNA sequence data compatible with ARB. Nucleic Acids Res. 35:7188–7196 [DOI] [PMC free article] [PubMed] [Google Scholar]
- 15. Huse SM, Dethlefsen L, Huber JA, Welch DM, Relman DA, Sogin ML. 2008. Exploring microbial diversity and taxonomy using SSU rRNA hypervariable tag sequencing. PLoS Genet. 4:e1000255 doi:10.1371/journal.pgen.1000255 [DOI] [PMC free article] [PubMed] [Google Scholar]
- 16. Huse SM, Welch DM, Morrison HG, Sogin ML. 2010. Ironing out the wrinkles in the rare biosphere. Environ. Microbiol. 12:1889–1898 [DOI] [PMC free article] [PubMed] [Google Scholar]
- 17. Knights D, Kuczynski J, Charlson ES, Zaneveld J, Mozer MC, Collman RG, Bushman FD, Knight R, Kelly ST. 2011. Bayesian community-wide culture-independent microbial source tracking. Nat. Methods 8:761–763 [DOI] [PMC free article] [PubMed] [Google Scholar]
- 18. Dethlefsen L, Huse SM, Sogin ML, Relman DA. 2008. The pervasive effects of an antibiotic on the human gut microbiota, as revealed by deep 16S rRNA sequencing. PLoS Biol. 6:e280 doi:10.1371/journal.pbio.0060280 [DOI] [PMC free article] [PubMed] [Google Scholar]
- 19. Shanks OC, Kelty CA, Archibeque SL, Jenkins M, Newton RJ, McLellan SL, Huse SM, Sogin ML. 2011. Community structures of fecal bacteria in cattle from different animal feeding operations. Appl. Environ. Microbiol. 77:2992–3001 [DOI] [PMC free article] [PubMed] [Google Scholar]
- 20. Shannon P, Markiel A, Ozier O, Baliga NS, Wang JT, Ramage D, Nada A, Schwikowski B, Ideker T. 2010. Cytoscape: a software environment for integrated models of biomolecular interaction networks. Genome Res. 13:2498–2504 [DOI] [PMC free article] [PubMed] [Google Scholar]
- 21. Eades P. 1984. A heuristic for graph drawing. Congressus Numerantium 42:149–160 [Google Scholar]
- 22. Chao A. 1984. Nonparametric estimation of the number of classes in a population. Scand. J. Stat. 11:265–270 [Google Scholar]
- 23. Schloss PD, Westcott SL, Ryabin T, Hall JR, Hartmann M, Hollister EB, Lesniewski RA, Oakley BB, Parks DH, Robinson CJ, Sahl JW, Stres B, Thallinger GG, Van Horn DJ, Weber CF. 2009. Introducing mothur: open-source, platform-independent, community-supported software for describing and comparing microbial communities. Appl. Environ. Microbiol. 75:7537–7541 [DOI] [PMC free article] [PubMed] [Google Scholar]
- 24. Abdersibm MJ. 2001. A new method for non-parametric multivariate analysis of variance. Austral Ecol. 26:32–46 [Google Scholar]
- 25. Clarke KR, Warwick RM. 2001. Change in marine communities: an approach to statistical analysis and interpretation. Plymouth Marine Laboratory, United Kingdom [Google Scholar]
- 26. Chen GH, Leung DH, Hung JC. 2003. Biofilm in the sediment phase of a sanitary gravity sewer. Water Res. 37:2784–2788 [DOI] [PubMed] [Google Scholar]
- 27. Backhed F, Ley RE, Sonnenburg JL, Peterson DA, Gordon JI. 2005. Host-bacterial mutualism in the human intestine. Science 307:1915–1920 [DOI] [PubMed] [Google Scholar]
- 28. Eckburg PB, Bik EM, Bernstein CN, Purdom E, Dethlefsen L, Sargent M, Gill SR, Nelson KE, Relman DA. 2005. Diversity of Human Intestinal Microbial Flora. Science 308:1635–1638 [DOI] [PMC free article] [PubMed] [Google Scholar]
- 29. Franks AH, Harmsen HJM, Raangs GC, Jansen GJ, Schut F, Welling GW. 1998. Variations of bacterial populations in human feces measured by fluorescent in situ hybridization with group-specific 16S rRNA-targeted oligonucleotide probes. Appl. Environ. Microbiol. 64:3336–3345 [DOI] [PMC free article] [PubMed] [Google Scholar]
- 30. Eckburg PB, Relman DA. 2007. The role of microbes in Crohn's disease. Clin. Infect. Dis. 44:256–262 [DOI] [PubMed] [Google Scholar]
- 31. Frank DN, St Amand AL, Feldman RA, Boedecker EC, Harpaz N, Pace NR. 2007. Molecular-phylogenetic characterization of microbial community imbalances in human inflammatory bowel diseases. Proc. Natl. Acad. Sci. U. S. A. 104:13780–13785 [DOI] [PMC free article] [PubMed] [Google Scholar]
- 32. Kelty CA, Varma M, Sivaganesan M, Haugland R, Shanks OC. 2012. Distribution of genetic marker concentrations for fecal indicator bacteria in sewage and animal feces. Appl. Environ. Microbiol. 78:4225–4232 [DOI] [PMC free article] [PubMed] [Google Scholar]
- 33. Shanks OC, White K, Kelty CA, Sivaganesan M, Blannon J, Meckes M, Varma M, Haugland RA. 2010. Performance of PCR-based assays targeting Bacteroidales genetic markers of human fecal pollution in sewage and fecal samples. Environ. Sci. Technol. 44:6281–6288 [DOI] [PubMed] [Google Scholar]
- 34. Facklam R. 2002. What happened to the Streptococci: overview of taxonomic and nomenclature changes. Clin. Microbiol. Rev. 15:613–630 [DOI] [PMC free article] [PubMed] [Google Scholar]
- 35. Liu J, Tanner RS, Schumann P, Weiss N, McKenzie CA, Janssen PH, Seviour EM, Lawson PA, Allen TD, Seviour RJ. 2002. Emended description of the genus Trichococcus, description of Trichococcus collinsii sp. nov., and reclassification of Lactosphaera pasteurii as Trichococcus pasteurii comb. nov. and of Ruminococcus palustris as Trichococcus palustris comb. nov. in the low-G+C gram-positive bacteria. Int. J. Syst. Evol. Microbiol. 52:1113–1126 [DOI] [PubMed] [Google Scholar]
- 36. Willems A, De Ley J, Gillis M, Kersters K. 1991. Comamonadaceae, a new family encompassing the Acidovorans rRNA complex, including Variovorax paradoxus gen. nov., comb. nov., for Alcaligenes paradoxus (Davis 1969). Int. J. Syst. Bacteriol. 41:445–450 [Google Scholar]
- 37. Amaral-Zettler L, Artigas LF, Baross J, Bharathi LPA, Boetius A, Chandramohan D, Herndl G, Kogure K, Neal P, Pedros-Alio C, Rametter A, Schouten S, Stal L, Thessen A, de Leeuw J, Sogin ML. 2010. A global census of marine microbes. Blackwell Publishing, Ltd, London, United Kingdom [Google Scholar]
- 38. Lauber CL, Hamady M, Knight R, Fierer N. 2009. Pyrosequencing-based assessment of soil pH as a predictor of soil bacterial community structure at the continental scale. Appl. Environ. Microbiol. 75:5111–5120 [DOI] [PMC free article] [PubMed] [Google Scholar]
- 39. Newton RJ, Jones JE, Eiler A, McMahon KD, Bertilsson S. 2011. A guide to the natural history of freshwater lake bacteria. Microbiol. Mol. Biol. Rev. 75:14–47 [DOI] [PMC free article] [PubMed] [Google Scholar]
- 40. Allen TD, Lawson PA, Collins MD, Falsen E, Tanner RS. 2006. Cloacibacterium normanense gen. nov., sp. nov., a novel bacterium in the family Flavobacteriaceae isolated from municipal waste. Int. J. Syst. Evol. Microbiol. 56:1311–1316 [DOI] [PubMed] [Google Scholar]