

Abstract
The aim of the study was to compare the compositions of the fecal microbiotas of infants fed goat milk formula to those of infants fed cow milk formula or breast milk as the gold standard. Pyrosequencing of 16S rRNA gene sequences was used in the analysis of the microbiotas in stool samples collected from 90 Australian babies (30 in each group) at 2 months of age. Beta-diversity analysis of total microbiota sequences and Lachnospiraceae sequences revealed that they were more similar in breast milk/goat milk comparisons than in breast milk/cow milk comparisons. The Lachnospiraceae were mostly restricted to a single species (Ruminococcus gnavus) in breast milk-fed and goat milk-fed babies compared to a more diverse collection in cow milk-fed babies. Bifidobacteriaceae were abundant in the microbiotas of infants in all three groups. Bifidobacterium longum, Bifidobacterium breve, and Bifidobacterium bifidum were the most commonly detected bifidobacterial species. A semiquantitative PCR method was devised to differentiate between B. longum subsp. longum and B. longum subsp. infantis and was used to test stool samples. B. longum subsp. infantis was seldom present in stools, even of breast milk-fed babies. The presence of B. bifidum in the stools of breast milk-fed infants at abundances greater than 10% of the total microbiota was associated with the highest total abundances of Bifidobacteriaceae. When Bifidobacteriaceae abundance was low, Lachnospiraceae abundances were greater. New information about the composition of the fecal microbiota when goat milk formula is used in infant nutrition was thus obtained.
INTRODUCTION
Natural microbial communities such as those that inhabit the human bowel carry out diverse and complex biochemical processes (1, 2). Investigations of factors involved in community structure and function require an understanding of the trophic requirements of the microbial members. Optimally, this requires laboratory experiments with cultured bacteria. However, the first step in ecological research is to determine the phylogenetic composition of the microbial community of interest.
Most infant formulas are manufactured using cow milk as a base. Goat milk provides an alternative basis for the production of infant formula. Like cow milk, goat milk needs to be fortified to provide optimal nutrition for infants (3). The amount of lactose in cow and goat milk is about the same, but there are other compositional differences (4). Alpha-s1 casein is present in ruminant milk but not in breast milk. Compared to cow milk, goat milk contains much lower concentrations of alpha-s1 casein and higher concentrations of nucleotides and polyamines as well as some of the essential amino acids. Breast milk differs from ruminant milks in that sialylated and fucosylated oligosaccharides (human milk oligosaccharides [HMO]) are the third largest component (5). The HMO are utilized for growth by bifidobacteria, and their presence in breast milk is the likely explanation as to why there is generally a greater abundance of these bacteria in the feces of breast milk-fed babies (6). There is a paucity of oligosaccharides other than lactose in the milk of other animals (7).
We hypothesized that the differing compositions of goat milk formula and cow milk formula might result in microbiotas of different compositions. Differences in the compositions of stool microbiotas of infants occur between geographical regions, sometimes quite closely situated (8, 9). Therefore, the effects of consumption of specific formulas by infants in particular locations, as we report here for goat milk and Australian infants, are prerequisite to physiological studies of specific members of the fecal microbiota of infants.
MATERIALS AND METHODS
Subjects and study design.
The infants included in this study were part of a larger study (Australian New Zealand Clinical Trials Registry ACTRN12608000047392) in South Australia, comparing growth and nutritional status of infants fed either goat milk-based infant formula or cow milk-based infant formula (Dairy Goat Cooperative [NZ] Ltd., Hamilton, New Zealand). Healthy term infants, with gestational ages of 37 to 42 weeks and birth weights between 2.5 and 4.75 kg, were recruited to a multicenter, double-blind, controlled feeding trial. Infants were then randomly allocated (stratified by sex and study center) to receive either goat milk or cow milk formula before they were 2 weeks of age (Table 1). Nine of the goat milk-fed infants were breast fed for an average of 2.33 days (standard deviation [SD], 1.32 days) during the first 2 weeks of life, as had 6 cow milk-fed infants (average, 3.67 days; SD, 3.20 days). However, all of the infants in the formula groups had been fed cow milk formula (but not study formula) prior to starting the test formulas. Parents and caregivers of formula-fed infants were instructed to exclusively feed their infants the allocated study formula from enrolment to at least 4 months of age. Infants were exclusively fed the study formulas (with no other liquids or solids except for water, vitamin or mineral supplements, or medicines). A parallel group of exclusively breast milk-fed infants was included as a reference group. Exclusivity and compliance were based on the criteria used by the WHO Multicenter Growth Reference Study Group (10). The study was approved by the relevant Human Research Ethics Committees at all three study centers. All families provided written, informed consent. Information concerning the growth and nutritional status of the infants will be reported elsewhere.
Table 1.
Details of infants (n = 30 per group)
| Group | % female | % vaginal delivery | Mean no. of days of age (SD) at study entry | Mean no. of days of age (SD) at sample collection |
|---|---|---|---|---|
| Goat milk formula | 60 | 70 | 5.23 (3.30) | 60.5 (6.9) |
| Cow milk formula | 56 | 70 | 6.00 (3.54) | 61.4 (7.61) |
| Breast milk | 56 | 76 | 6.00 (3.64) | 61.0 (6.09) |
Composition of formulas.
Full details of the milk formulas are given in Table 2. A notable difference was the inclusion of milk fat in the goat milk formula but vegetable fat in the cow milk formula. In summary, the ingredients for the goat milk formula were pasteurized goat milk solids (43%), lactose, vegetable oils, minerals, vitamins, acidity regulator (citric acid), choline chloride, l-tryptophan, l-isoleucine, taurine, and l-carnitine. The whey-to-casein ratio was approximately 20:80, and a proportion of the fat (60%) was goat milk fat. The ingredients for the cow milk formula were cow milk solids (demineralized whey, lactose, skim milk solids, whey solids, whey protein concentrate), vegetable oils, soy lecithin, minerals, vitamins, acidity regulator (citric acid and/or calcium hydroxide), choline chloride, l-tryptophan, taurine, and l-tyrosine. The whey-to-casein ratio was approximately 60:40, and cow fat was not included.
Table 2.
Milk formula compositionsa
| Nutrient | Unit | Amount per 100 kcalb |
|
|---|---|---|---|
| Goat milk infant formula | Cow milk infant formula (per 100 ml) | ||
| Energy | kcal | 65.6 (per 100 ml) | 64.8 (per 100 ml) |
| kJ | 274.0 (per 100 ml) | 271.0 (per 100 ml) | |
| Protein | g | 2.0 | 2.1 |
| Fat | g | 5.3 | 5.2 |
| Linoleic acid omega-6 | g | 0.6 | 0.9 |
| α-Linolenic acid omega-3 | g | 0.1 | 0.1 |
| Carbohydrate | g | 11.0 | 11.0 |
| Vitamins | |||
| Vitamin A (RE) | μg | 141.0 | 87.0 |
| Vitamin D3 | μg | 1.8 | 2.1 |
| Vitamin E (TE) | mg | 2.6 | 1.1 |
| Vitamin K1 | μg | 12.0 | 8.8 |
| Vitamin C | mg | 20.0 | 12.0 |
| Thiamine | μg | 118.0 | 58.0 |
| Riboflavin | μg | 226.0 | 250.0 |
| Niacin | mg | 1.3 | 0.8 |
| Vitamin B6 | μg | 80.0 | 65.0 |
| Folic acid | μg | 12.0 | 21.0 |
| Pantothenic acid | mg | 0.6 | 1.2 |
| Vitamin B12 | μg | 0.3 | 0.5 |
| Biotin | μg | 3.8 | 4.7 |
| Minerals | |||
| Calcium | mg | 98.0 | 81.0 |
| Phosphorus | mg | 73.0 | 53.0 |
| Sodium | mg | 31.0 | 31.0 |
| Potassium | mg | 133.0 | 116.0 |
| Chloride | mg | 116.0 | 71.0 |
| Magnesium | mg | 10.0 | 10.0 |
| Iron | mg | 1.0 | 1.3 |
| Zinc | mg | 0.9 | 0.7 |
| Iodine | μg | 15.0 | 17.0 |
| Copper | μg | 76.0 | 70.0 |
| Manganese | μg | 16.0 | 12.0 |
| Selenium | μg | 1.9 | 3.7 |
| Inositol | mg | 6.8 | 5.1 |
| Choline | mg | 27.0 | 19.0 |
| Taurine | mg | 8.9 | 6.6 |
| Carnitine | mg | 1.2 | 3.3 |
The energy content was calculated based on the reconstitution of 14 g powder added to 100 ml water.
Values are per 100 kcal unless stated otherwise.
Stool samples.
A fecal sample was obtained from the infants when 2 months of age during the period of June 2008 to June 2009. The samples were immediately frozen at −20°C following collection, held for less than 12 months at this temperature, and shipped on dry ice to New Zealand for further storage at −80°C and analysis in 2009. A single sample from 30 infants per dietary group was investigated bacteriologically. Samples collected at 2 months of age were examined because a predictable biological succession proceeds following birth in which, within 3 months of age, members of the genus Bifidobacterium become the most abundant population in the feces (11–13). Bifidobacterial abundance is generally found to be greater in the feces of breast milk-fed babies and, since Mother Nature knows best, has been considered the bacteriological gold standard for the infant bowel for more than 100 years (14). The infants were compliant with feeding and had not received antibiotic treatment up to 2 months of age. There was an even distribution of sex and delivery mode across the dietary groups. Further details are given in Table 1.
DNA extraction from stools.
A one-tenth (wt/vol) fecal homogenate was prepared in sterile phosphate-buffered saline (pH 7.0). A 500-μl aliquot of homogenate was brought to 1.0 ml with sterile phosphate-buffered saline and centrifuged at 150 × g for 5 min at 5°C. The supernatant was transferred to a microcentrifuge tube and centrifuged at 5,000 × g for 5 min at 5°C. The pellet was suspended in 200 μl of lysis buffer (20 mg lysozyme, 80 μl 10 mM Tris-HCl-10 mM EDTA) and incubated at room temperature for 30 min. Fifty microliters of 20% (wt/vol) sodium dodecyl sulfate (SDS) solution was added together with 300 μl of 50 mM sodium acetate-10 mM EDTA (pH 5.1) solution. The preparation was transferred to a beadbeater tube, and 300 μl of phenol saturated with 50 mM sodium acetate-10 mM EDTA buffer (pH 5.1) was added to the tubes. The sample was shaken at 5,000 rpm for 2 min in a beadbeater. After centrifugation at 14,000 × g for 10 min at 4°C, the supernatant was transferred to a microcentrifuge tube, and 600 μl of phenol saturated with sodium acetate-EDTA buffer (pH 5.1) was added. Samples were mixed by vortexing for 1 min and centrifuged under the conditions described above. Then, 600 μl of phenol-chloroform-isoamyl alcohol (25:24:1) was added to the supernatant, and the mixture was vortexed for 1 min and centrifuged. This step was repeated once. Then, 600 μl of chloroform-isoamyl alcohol (24:1) was added to the supernatants, which were vortexed for 1 min and centrifuged for 5 min at 14,000 × g. This step was repeated once. Nucleic acids were precipitated in 1 ml of isopropanol overnight at −20°C. The precipitated nucleic acids were obtained by centrifugation at 14,000 × g for 20 min at 4°C. They were washed with 1 ml of 80% ethanol and centrifuged at 14,000 × g for 10 min, the supernatant was discarded, and the pellet was dried in air at 37°C. Further purification of DNA was achieved using the Qiagen-AllPrep DNA/RNA minikit.
Analysis of microbiota composition by pyrosequencing 16S rRNA genes.
Pyrosequencing 16S rRNA genes amplified from stool DNA provided a comprehensive analysis of the phylogenetic composition of fecal microbiotas. A region comprising the V1 to V3 regions of the bacterial 16S rRNA gene was amplified using a two-step protocol similar to that described by Dowd et al. (15). First-round PCR was carried out for 15 cycles using the 8fAll/HDA2 primer set (Table 3). Primer 8fAll was modified, by the inclusion of degenerate bases, from primer 8f described by Palmer and colleagues (19). Sequences encompassing the first 50 bases of the 16S rRNA gene of all available type strains were downloaded from the RDP. These sequences were aligned, and a consensus of the region targeted by the 8f primer was generated. Where this consensus differed from the original 8f primer, degenerate bases were incorporated. The newly designed 8fAll primer was searched against the RDP database using the online ProbeMatch tool and was shown to target all type strains of Bifidobacterium species. Bifidobacterial DNA spiking of fecal DNA from an infant whose feces did not contain bifidobacteria and use of primer set 8fAll/HDA2 showed detection of bifidobacterial targets. In contrast, use of 8F/HDA2 did not (see Fig. S1 in the supplemental material).
Table 3.
PCR primers
| Target | Primer | Sequence 5′–3′ | Reference |
|---|---|---|---|
| Bacteria | 8F_All | GRGTTYGATYMTGGCTCAG | This study |
| 340R | ACTGCTGCCTCCCGTAGGAGT | ||
| HDA2 | GTATTACCGCGGCTGCTGGCAC | ||
| Bifidobacteria | g-Bif_F | CTCCTGGAAACGGGTGG | 16 |
| g-Bif_R1 | GGTGTTCTTCCCGATATCTACA | ||
| B. bifidum | Bbif_F | CCACATGATCGCATGTGATTG | 16 |
| Bbif_R | CCGAAGGCTTGCTCCCAAA | ||
| B. breve | Bbrev_F | CCGGATGCTCCATCACAC | 16 |
| Bbrev_R | ACAAAGTGCCTTGCTCCCT | ||
| B. catenulatum groupa | BcatG_F | CGGATGCTCCGACTCCT | 16 |
| BcatG_R | CGAAGGCTTGCTCCCGAT | ||
| B. longum subsp. longum | Blong_F | GTTCCCGACGGTCGTAGAG | 17 |
| Blong_R | GTGAGTTCCCGGCAYAATCC | ||
| B. animalis | Banim_F | ACCAACCTGCCCTGTGCACCG | 34 |
| Banim_R | CCATCACCCCGCCAACAAGCT | ||
| B. longum subsp. infantis | Binf F | CCATCTCTGGGATCGTCGG | 18 |
| Binf R | TATCGGGGAGCAAGCGTGA |
Targets B. catenulatum and B. pseudocatenulatum.
The following conditions were used to amplify 16S rRNA sequences for pyrosequencing: 94°C for 1 min, 57°C for 1 min, 72°C for 1 min, with a final extension step of 72°C for 5 min. This product was diluted 1:5 with PCR-grade water, and 1 μl was used as the template in a 20-μl secondary PCR mixture. The secondary PCR was carried out for 30 cycles using the 8fAll primer with the 454 sequencing Lib-A adapter sequence A (CGTATCGCCTCCCTCGCGCCATCAGGRGTTYGATYMTGGCTCAG) and the HDA2 primer with the 454 sequencing Lib-A adapter sequence B plus a 10-base barcode, shown as Ns, (CTATGCGCCTTGCCAGCCCGCTCAGNNNNNNNNNNGTATTACCGCGGCTGCTGGCAC) using conditions identical to those of the primary PCR. Products were cleaned using Qiagen PCR cleanup columns (Qiagen, Hilden, Germany) and quantified using a NanoDrop 1000 spectrometer. Equivalent quantities of PCR product from each sample were pooled, and the pooled DNA was recleaned through a Qiagen PCR cleanup column, quantified, and sent to Macrogen (Korea) for unidirectional sequencing from the reverse primer using the Roche-454 genome sequencer with titanium chemistry. Sequences were processed using a combination of methods from both the QIIME version 1.2.1 and RDP pyrosequencing pipeline packages (20). Sequences were excluded from analysis if they were <250 or >550 bases in length, had an average quality score of <25, contained one or more ambiguous bases, had >1 mismatch with the sequencing primer, or had a homopolymer run of >6. Following splitting into barcoded samples and initial quality filtering, the sequences were passed through the QIIME pipeline using default parameters, including chimera checking. After quality screening, an average of 3,745 (range, 2,051 to 5,782) sequences per barcoded sample were recovered for downstream analysis. Thus, a total of 99,587 sequences were obtained from breast milk-fed infants for phylogenetic analysis, 119,933 sequences from goat milk-fed infants, and 117,548 sequences from cow milk-fed infants. Species-level taxonomy was obtained by filtering operational taxonomic unit (OTU) tables, containing taxonomic data generated using the RDP classifier, at a genus level; extracting representative sequences; and using BLAST to identify species-level matches within the NCBI database. Biplots, showing principle coordinate clustering of samples alongside weighted taxonomic group data, were generated as part of the beta-diversity analysis in QIIME using family-level summarized OTU tables. Statistical analyses, including tests for normalcy, Mann-Whitney, and Kruskal-Wallis nonparametric tests, were carried out on high-throughput sequence data normalized to all sequence counts. Pearson correlation tests were carried out when comparing quantitative PCR (qPCR) and HTS data. All analyses were carried out using GraphPad Prism version 5.0a (GraphPad Software, Inc., La Jolla, CA).
Quantification of bifidobacterial populations by qPCR.
Measurement of abundances of total bifidobacteria and bifidobacterial species in feces by qPCR may be used in future studies aimed at understanding ecological regulatory factors in the infant bowel. Therefore, we compared values obtained using qPCR with abundances generated by pyrosequencing. Real-time quantitative PCR was carried out using an ABI 7500 Fast system in MicroAmp Fast optical 96-well plates with optical adhesive film (Applied Biosystems, Foster City, CA). Primers targeting the 16S rRNA genes from bifidobacterial species are described in Table 3 and were purchased from Invitrogen. All reactions were carried out in a final volume of 20 μl containing 1× Fast SYBR green PCR mastermix (Applied Biosystems) and 300 nM each primer. Template DNA was diluted to 10 ng/μl, and 20 ng was added to each reaction. The thermocycling profile consisted of an initial activation of the polymerase at 95°C for 30 s, followed by 40 cycles of 95°C for 10 s and 60°C for 30 s. Fluorescence levels were measured after the 60°C annealing/extension step. A melt curve was generated to analyze product specificity. Standard curves were generated using genomic DNA extracted from bifidobacterial strains Bifidobacterium breve (ATCC 15700T), Bifidobacterium bifidum (DSM 20456T), Bifidobacterium longum (ATCC 15707T), Bifidobacterium pseudocatenulatum (DSM 20438T), and Bifidobacterium animalis subsp. lactis (DSM 10140T) using the Qiagen DNeasy blood and tissue kit and following the Gram-positive bacteria protocol. The standard DNA was quantified spectrophotometrically using a NanoDrop 1000 spectrophotometer (Thermo Scientific) and diluted in 10-fold steps from 5 × 10⁶ to 5 × 101 genomes/reaction, calculated using target gene copies per genome obtained from genome sequence information (NCBI). All reactions were carried out in duplicate and were run twice on separate plates. No-template controls were also included on each plate.
Differentiation of B. longum subsp. longum from B. longum subsp. infantis using qPCR.
B. longum subsp. longum and infantis cannot be differentiated by BLAST (NCBI) alignments of their 16S rRNA gene sequences. PCR primer sets for the two subspecies have been designed (Table 3), and, although they are not totally subspecies specific, amplification is biased toward the target subspecies. To circumvent the lack of absolute specificity of the primers, we used qPCR to discriminate between the two B. longum subspecies. Each sample was used as the template in a 20-μl final volume PCR mixture containing either the Blong F/R or Binf F/R primers. DNA (extracted as described above) from B. longum subsp. longum (ATCC 15707T) and B. longum subsp. infantis (DSM 20088T) were used as controls. PCR conditions were as described in the previous section. Cycle threshold (CT) values for the two different primer sets were compared for each DNA sample. When a sample had a smaller CT value for the Blong F/R primer set, it was deemed to contain B. longum subsp. longum, but if the CT value was smaller when using the Binf F/R primer set, the sample contained B. longum subsp. infantis. The differential assay is hence semiquantitative. The method was validated using pure DNA and mixtures of DNA, extracted from the type cultures of the two subspecies. Additional strains were also tested: B. longum subsp. infantis ATCC 15702 and 9 laboratory isolates with 16S rRNA gene sequences >97% similar to B. longum. Eight did not ferment arabinose (characteristic of B. longum subsp. longum), while the remaining isolate fermented arabinose (characteristic of B. longum subsp. infantis) (21). Mixtures of DNA from the two subspecies were also used to spike fecal DNA from an infant without detectable bifidobacteria as part of the validation of primers. B. longum was detected in pyrosequencing data from 22 breast milk-, 18 goat milk-, and 16 cow milk-fed babies. These samples were tested using the differential qPCR method.
RESULTS
Comparison of total Bifidobacteriaceae populations.
Analysis of 16S rRNA gene sequences showed that total Bifidobacteriaceae abundance was greater in the feces of breast milk-fed infants than in those receiving formulas (Fig. 1A). Babies delivered vaginally had greater abundances of Bifidobacteriaceae than those delivered by caesarean section (Fig. 1B). Bifidobacteriaceae did not differ in abundance between male and female infants (Fig. 1C).
Fig 1.
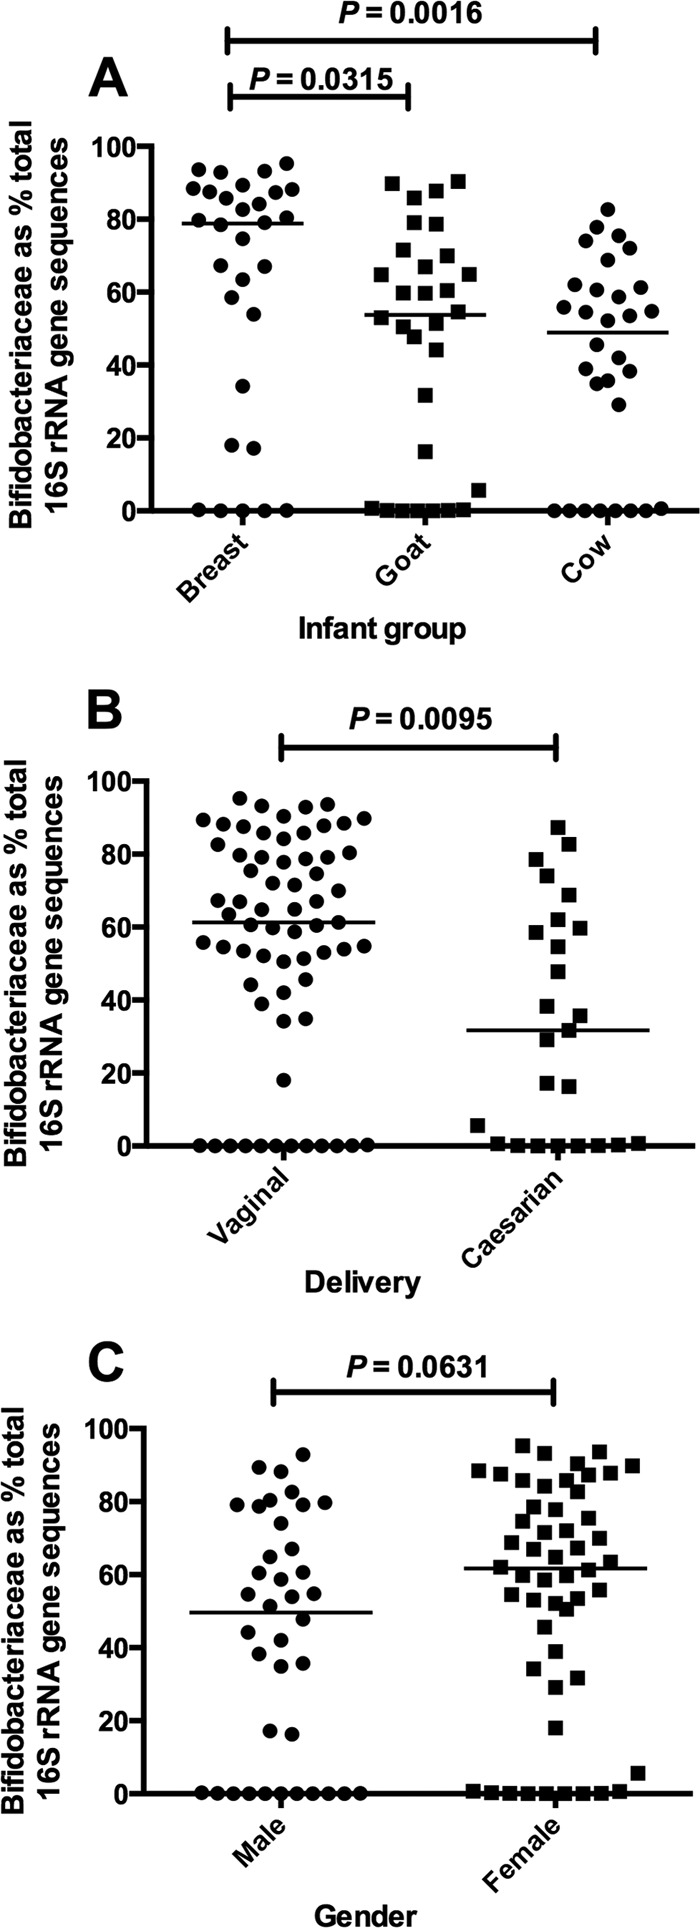
Scatter plots showing the proportions of Bifidobacteriaceae sequences with respect to total sequences obtained from pyrosequencing 16S rRNA genes associated with dietary groups (A), delivery method (B), and gender (C). Median values (horizontal lines) and significance values (P, Mann-Whitney) are shown. Thirty infants per goat, cow, and breast milk groups.
Comparison of bifidobacterial species in stool microbiotas.
Analysis of 16S rRNA gene sequences showed that three species were most prevalent in infant stool: B. longum, B. breve, and B. bifidum. However, the abundance of B. breve was greater in the feces of breast milk-fed infants than in the formula-fed infants (Table 4). Values obtained by qPCR assay were highly correlated with those obtained by pyrosequencing and could therefore be used with confidence in future studies (see Table S1 in the supplemental material).
Table 4.
Abundances of 16S rRNA genes originating in the 10 most highly represented bifidobacterial species (normalized by total 16S rRNA genes; 30 infants per group)
| Bifidobacterium species | Mean % (SEM) |
||
|---|---|---|---|
| Breast | Goat | Cow | |
| B. longum | 26.14 (5.36) | 16.72 (4.30) | 19.22 (4.46) |
| B. brevea | 19.56 (5.97) | 7.08 (3.79) | 9.97 (3.68) |
| B. bifidum | 6.92 (1.96) | 9.25 (3.25) | 1.95 (0.88) |
| B. pseudocatenulatum | 2.91 (2.06) | 6.10 (2.65) | 1.86 (1.33) |
| B. dentium | 4.76 (3.06) | 2.06 (1.58) | 1.77 (1.75) |
| B. adolescentis | 0.38 (0.33) | 1.86 (1.34) | 3.51 (2.46) |
| B. animalis | 0.00 (0.00) | 0.66 (0.50) | 1.84 (1.35) |
| B. catenulatum | 0.02 (0.01) | 1.68 (1.65) | 0.23 (0.22) |
| B. kashiwanohense | 0.13 (0.06) | 0.22 (0.16) | 0.05 (0.04) |
| B. scardovii | 0.01 (0.01) | 0.01 (0.01) | 0.11 (0.07) |
Breast versus cow and goat, P < 0.05.
Analysis of species abundance in breast milk-fed infants showed that the presence of B. bifidum at greater than 10% of the total microbiota was associated with the highest abundances of total bifidobacteria (Fig. 2).
Fig 2.
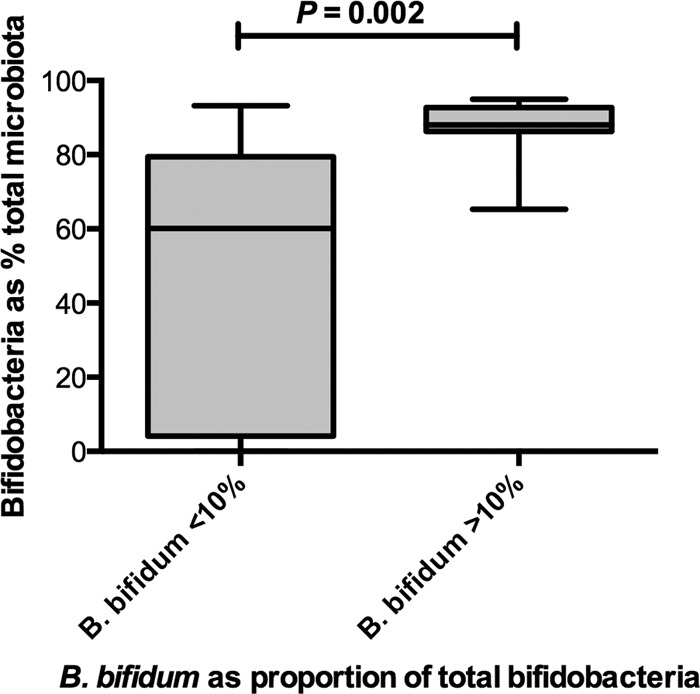
Comparisons of Bifidobacteriaceae abundances in stools from breast milk-fed infants where B. bifidum was less than (n = 20 infants) or greater than (n = 10 infants) 10% of the total bifidobacterial population. The greatest abundances of Bifidobacteriaceae occurred in stools with greater than 10% B. bifidum. Box plots showing horizontal line, median; box, 25 to 75% confidence limits; vertical bars, ranges.
B. longum subsp. longum and B. longum subsp. infantis could be differentiated on the basis of relative CT values with PCR primers targeting subspecies as shown in Fig. 3. Use of the method with stool DNA from babies in the study showed that when B. longum was present, it was usually B. longum subsp. longum. B. longum subsp. infantis was rarely detected (in only two breast milk-, one goat milk-, and zero cow milk-fed infants).
Fig 3.

Differentiation between B. longum subsp. longum and B. longum subsp. infantis using qPCR. Amplification curves (for clarity of reproduction, data generated by ABI software were used to prepare Prism graphs) for target 16S rRNA sequences. (A) DNA template from B. longum subsp. longum ATCC 15707T; (B) DNA template from B. longum subsp. infantis DSM 20088T; (C and D) templates from B. longum subsp. longum and infantis tested in the presence of stool DNA from an infant without bifidobacteria; (E) mixed templates (1:1 ratio); (F) the mixed templates in the presence of stool DNA. Note that the results in panels A and C, B and D, and E and F are highly similar, indicating that the presence of fecal DNA does not alter the amplification kinetics.
Similarity comparisons of microbiotas.
Alpha-diversity (rarefaction) analysis showed that fecal microbiota compositions were less diverse in breast milk-fed children than in formula-fed babies (Fig. 4A). Beta-diversity (UniFrac) distances revealed that the microbiotas of goat milk-fed babies were more similar to those of breast milk-fed infants than were those of cow milk-fed infants (Fig. 4B).
Fig 4.
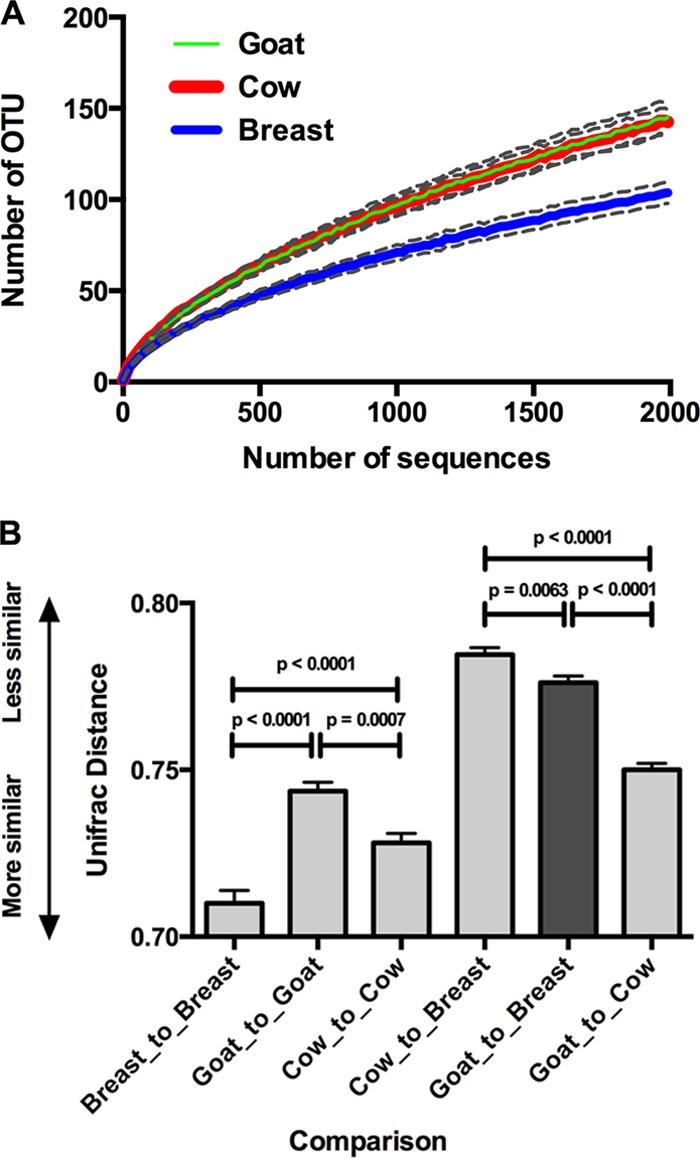
Similarity comparisons. (A) Alpha-diversity as measured by OTU accumulation with respect to sequence accumulation for the three dietary groups. Dashed lines indicate 95% confidence intervals. (B) Beta-diversity measures shown as unweighted UniFrac distances. Dietary groups were compared with themselves and with other diets. Mean values with SEM are shown. Significance values (P, Kruskal-Wallis) are also shown. Data from 30 infants per group were compared.
Comparisons of bacterial families.
Comparisons of the abundances of bacterial families comprising the fecal microbiotas showed that differences occurred between breast milk-fed and formula-fed babies (Table 5). In particular, Lachnospiraceae and Erysipelotrichaceae were less abundant in breast milk-fed infant microbiotas, whereas Bacteroidaceae were more abundant. Clustering of Bacteroidaceae with breast milk-fed infant microbiotas was also apparent in biplot diagrams (Fig. 5). Bacteroides vulgatus, Bacteroides fragilis, and Bacteroides thetaiotaomicron were the most abundant species (Table 6). The coabundance of Bifidobacteriaceae and Bacteroidaceae in the microbiota of breast milk-fed babies is probably due to the availability of HMO. Bacteroides thetaiotaomicron and Bacteroides fragilis have been shown to induce the same genes during HMO utilization that they use to harvest host mucus glycans which are structurally similar to HMO (22).
Table 5.
Comparison of abundances of 16S rRNA gene sequences originating in the 13 most highly represented families (30 infants per group)
| Bacterial family | Mean % abundance (SEM) |
||
|---|---|---|---|
| Breast | Goat | Cow | |
| Bifidobacteriaceaea,b | 61.36 (6.28) | 46.19 (5.86) | 40.99 (5.16) |
| Lachnospiraceaea,b | 4.22 (2.65) | 12.53 (2.85) | 22.11 (4.52) |
| Erysipelotrichaceaea,b | 0.21 (0.15) | 13.63 (2.9) | 7.99 (2.34) |
| Enterobacteriaceae | 8.22 (2.40) | 5.12 (1.33) | 4.42 (1.14) |
| Coriobacteriaceae | 6.10 (2.67) | 5.38 (1.76) | 4.59 (2.20) |
| Streptococcaceaea | 4.12 (2.81) | 4.49 (2.01) | 4.04 (1.46) |
| Clostridiaceaea | 2.67 (1.33) | 1.69 (0.73) | 6.23 (2.80) |
| Enterococcaceaea,b | 0.88 (0.38) | 4.99 (1.04) | 3.80 (0.83) |
| Bacteroidaceaea,b | 4.93 (1.99) | 0.35 (0.31) | 0.03 (0.02) |
| Lactobacillaceaea,b | 1.75 (0.69) | 0.89 (0.77) | 0.07 (0.03) |
| Veillonellaceae | 1.59 (0.81) | 0.42 (0.16) | 0.26 (0.12) |
| Peptostreptococcaceaea,b | 0.19 (0.10) | 0.65 (0.21) | 0.94 (0.56) |
| Ruminococcaceae | 0.35 (0.24) | 0.08 (0.04) | 0.64 (0.42) |
Breast versus cow, P < 0.05.
Breast versus goat, P < 0.05.
Fig 5.

Biplot representation of principle coordinates of unweighted, pairwise UniFrac distances showing clustering of bacterial groups with stool samples. Stools from breast milk-fed infants, blue spheres; goat milk formula-fed infants, green spheres; cow milk formula-fed infants, red spheres. Taxon positions (gray spheres) are weighted (relative abundance) averages of the coordinates of all samples. Note association of Bacteroidaceae with breast milk-fed infant stool. Data from 30 infants per group were analyzed.
Table 6.
Abundances of the most commonly represented Bacteroides species in feces of infants (30 infants per group)
| Species | Mean % abundance (SEM)a |
||
|---|---|---|---|
| Breast | Goat | Cow | |
| B. vulgatus | 1.98 (1.70) | 0.07 (0.06) | 0.00 (0.00) |
| B. fragilis | 1.73 (0.71) | 0.19 (0.18) | 0.00 (0.00) |
| B. thetaiotaomicron | 0.45 (0.38) | 0.04 (0.04) | 0.00 (0.00) |
| Bacteroides dorei | 0.17 (0.14) | 0.00 (0.00) | 0.00 (0.00) |
| Bacteroides sp. Smarlab 3301643 | 0.15 (0.11) | 0.00 (0.00) | 0.00 (0.00) |
| Bacteriodes uniformis | 0.14 (0.07) | 0.00 (0.00) | 0.00 (0.00) |
| Bifidobacterium stercoris | 0.09 (0.09) | 0.00 (0.00) | 0.00 (0.00) |
| Bacteroides ovatus | 0.05 (0.03) | 0.00 (0.00) | 0.00 (0.00) |
| Bacteroides acidofaciens | 0.01 (0.01) | 0.00 (0.00) | 0.00 (0.00) |
| Bacteroides faecis | 0.00 (0.00) | 0.02 (0.02) | 0.02 (0.02) |
Normalized to total sequences.
Beta-diversity analysis showed that Lachnospiraceae compositions of the feces of goat milk-fed babies were more similar to those of breast milk-fed infants than were those of cow milk-fed infants (Fig. 6). This was the consequence of the simpler composition of the Lachnospiraceae population in the feces of goat milk-fed infants than that in the feces of cow milk-fed infants (Table 7). Breast milk- and goat milk-fed babies had predominantly Ruminococcus gnavus, whereas a diversity of other species was detected in cow milk-fed babies.
Fig 6.
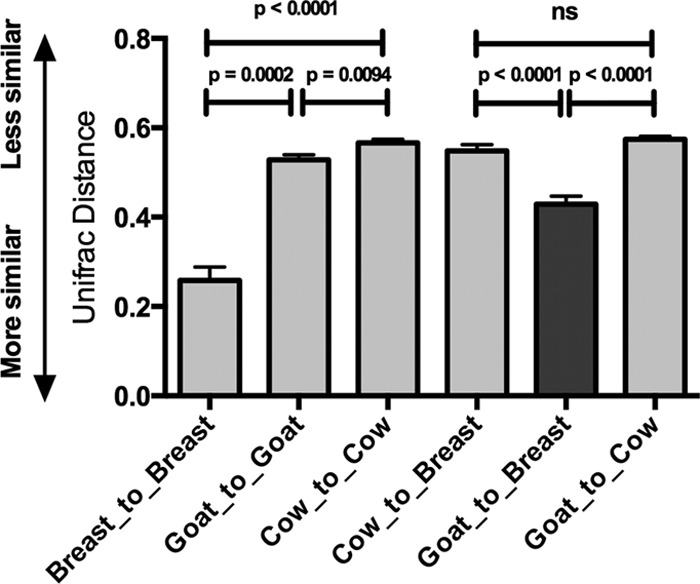
Similarity comparisons. Beta-diversity measures shown as unweighted, pairwise UniFrac distances applied to sequences originating in members of the family Lachnospiraceae, showing comparisons of dietary groups with themselves and with other groups. Mean values and SEM are shown. Significance values (P, Kruskal-Wallis) are also shown. Data from 30 infants per group were compared.
Table 7.
Comparison of abundances of 16S rRNA genes originating from Lachnospiraceae (30 infants per group)
| Species | Mean % abundance (SEM) |
||
|---|---|---|---|
| Breast | Goat | Cow | |
| Ruminococcus gnavusa,b | 4.10 (2.67) | 9.77 (2.95) | 8.04 (3.11) |
| Blautia productaa,b | 0.00 (0.00) | 0.12 (0.10) | 3.40 (1.49) |
| Blautia glucerasea | 0.00 (0.00) | 0.34 (0.34) | 2.27 (1.87) |
| Ruminococcus obeum | 0.00 (0.00) | 0.03 (0.03) | 2.44 (2.44) |
| Robinsoniella peoriensisa,c | 0.00 (0.00) | 0.00 (0.00) | 1.65 (0.57) |
| Lachnospiraceaea,b,c,d | 0.10 (0.06) | 0.43 (0.09) | 0.83 (0.15) |
| Lachnospiraceae incertae sedisa,b | 0.04 (0.02) | 0.75 (0.29) | 0.38 (0.12) |
| Anaerostipesd | 0.04 (0.03) | 0.12 (0.07) | 0.60 (0.47) |
| Ruminococcus torques | 0.00 (0.00) | 0.00 (0.00) | 0.63 (0.57) |
| Ruminococcus sp. WAL 17306 | 0.00 (0.00) | 0.00 (0.00) | 0.55 (0.43) |
| Ruminococcus sp. CO12 | 0.00 (0.00) | 0.14 (0.13) | 0.31 (0.31) |
| Eubacterium fissicatena | 0.00 (0.00) | 0.00 (0.00) | 0.19 (0.14) |
| Roseburiad | 0.00 (0.00) | 0.15 (0.15) | 0.00 (0.00) |
| Ruminococcus sp. K-1 | 0.00 (0.00) | 0.00 (0.00) | 0.12 (0.12) |
Breast versus cow, P < 0.05.
Breast versus goat, P < 0.05.
Cow versus goat, P < 0.05.
Taxonomic information not available to species level.
Species of the family Erysipelotrichaceae were present rarely and at low levels in breast milk-fed babies (Table 5). Several species were represented in both the cow milk- and goat milk-fed babies, but Clostridium ramosum (goat, 10.84% [standard error of the mean (SEM), 3.28%]; cow, 4.71% [SEM, 2.19%]) and Clostridium innocuum (goat, 2.78% [SEM, 0.87%]; cow, 2.96% [SEM, 1.09%]) were the most common.
Microbiota composition in the absence of Bifidobacteriaceae.
Some babies in each dietary group had microbiotas that lacked or had very low abundances of Bifidobacteriaceae. Analysis of the compositions of these microbiotas showed that when Bifidobacteriaceae abundance was low, Lachnospiraceae abundances tended to be greater in babies in all three dietary groups (Fig. 7). There was also a tendency for Erysipelotrichaceae abundances to be greater in formula-fed babies with low bifidobacterial abundances, being much more evident in the case of goat milk-fed babies.
Fig 7.
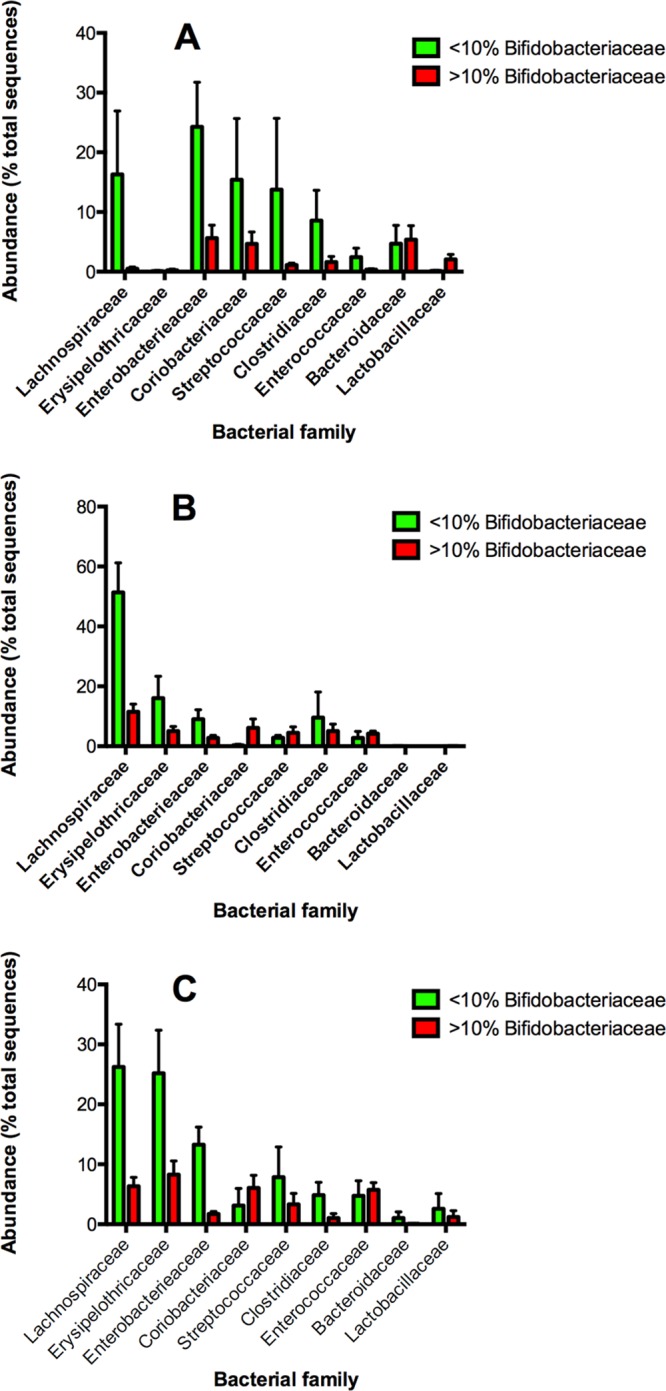
Relative abundances of nine bacterial families in infant stools where sequences representing Bifidobacteriaceae were less than 10% relative abundance (green bars) or greater than 10% relative abundance (red bars) in breast milk-fed (A), cow milk formula-fed (B), and goat milk formula-fed (C) infants. Means and SEM are shown. Data from 30 infants per group were compared.
DISCUSSION
Our hypothesis that there might be differences in microbiota compositions of babies fed goat rather than cow milk formula was supported. Beta-diversity analysis of total microbiotas and Lachnospiraceae populations revealed that they were more similar in breast milk/goat milk comparisons than in breast milk/cow milk comparisons. The basis for this similarity appeared to be the predominance of Ruminococcus gnavus among the Lachnospiraceae in the breast milk/goat milk-fed microbiotas, with only very low abundances of other types. Lachnospiraceae do not seem to have been studied in any detail in relation to their ecological roles in the human bowel. They are among the key players in biohydrogenation (unsaturated to saturated fatty acids) in the rumen (23). Their greater abundance in the microbiotas of formula-fed babies may reflect the accompanying lower abundance of Bifidobacteriaceae, or to the vegetable or ruminant lipids present in the different formulas. Some babies in all dietary groups did not harbor Bifidobacteriaceae at all or had very low abundances of these bacteria. These infants tended to have greater proportions of Lachnospiraceae, suggesting that an interaction, possibly metabolically competitive, exists between these groups.
The predominance of Bifidobacteriaceae among the bacterial inhabitants of the infant bowel during the first months of life has been noted especially with breast milk-fed infants (11, 18, 24, 25). Even so, Bifidobacteriaceae formed a large proportion (on average about 43%) of the total microbiota of goat and cow milk formula-fed infants. There is clearly scope to investigate the growth kinetics of bifidobacteria in the absence of HMO. These studies might focus on residual lactose, glycoproteins, or glycolipids in milk reaching the large bowel of infants (26, 27).
Bifidobacterial species compositions were similar between formula milk- and breast milk-fed babies in that B. longum predominated in all groups, usually accompanied by B. breve and B. bifidum. The physiological basis for this coabundance of particular species is apparently not known nor has the reason for greater abundance of B. breve in the stool of breast milk-fed babies been explained. The association between highest abundance of total bifidobacteria with appreciable B. bifidum populations in the stools of breast milk-fed babies was noteworthy. No such association was detected in formula-fed babies, indicating that HMO may have a role in determining the association.
Pyrosequencing and qPCR measurements of bifidobacteria were highly correlated, indicating the suitability of the latter technique in future focused studies. Importantly, qPCR also provided a means of differentiating between B. longum subsp. longum and B. longum subsp. infantis. Application of the method to stool DNA showed that B. longum subsp. infantis was seldom present, even in stools collected from breast milk-fed babies. Other reports have described a paucity of B. longum subsp. infantis in the stool of infants born in New Zealand, United Kingdom, and Italy but its abundance in stool of African (Ghana), Indian, and Japanese babies (28–30). Data from the United Kingdom is, however, contradictory (31) but could depend on the identification method used. Differentiation of the two subspecies has not always been made in studies of bifidobacterial diversity (32). B. longum subsp. infantis is probably the most intensively studied of the bifidobacteria with respect to biochemistry (33), but it may be an endangered species in western countries. Further international prevalence studies using a single validated identification method are desirable. This is because differential responses by dendritic cells to B. longum subsp. infantis compared to other bifidobacterial species have been reported (30). It can be speculated that the metabolic activity of the microbiota might also be different in the absence or presence of B. longum subsp. infantis, because this species is particularly well adapted among the bifidobacteria to the utilization of HMO (33).
Overall, the new information that we have obtained about the composition of the fecal microbiota when goat milk formula is used in infant nutrition points to a need to understand bifidobacterial and lachnospiral growth in the absence of HMO. Such research is likely to reveal the trophic levels underpinning the community structure that we report for goat milk formula-fed babies.
Footnotes
Published ahead of print 1 March 2013
Supplemental material for this article may be found at http://dx.doi.org/10.1128/AEM.03910-12.
REFERENCES
- 1. Flint HJ, Bayer EA, Rincon MT, Lamed R, White BA. 2008. Polysaccharide utilization by gut bacteria: potential for new insights from genomic analysis. Nat. Rev. Microbiol. 6: 121– 131 [DOI] [PubMed] [Google Scholar]
- 2. Ley RE, Lozupone CA, Hamady M, Knight R, Gordon JI. 2008. Worlds within worlds: evolution of the vertebrate gut microbiota. Nat. Rev. Microbiol. 6: 776– 788 [DOI] [PMC free article] [PubMed] [Google Scholar]
- 3. EFSA Panel on Dietetic Products, Nutrition and Allergies 2012. Scientific opinion on the suitability of goat milk protein as a source of protein in infant formulae and in follow-on formulae. EFSA J. 10: 2603 [Google Scholar]
- 4. Ceballos LS, Morales ER, Torre Adarve DIG. 2009. Composition of goat and cow milk produced under similar conditions and analysed by identical methodology. J. Food Comp. Anal. 22:322– 329 [Google Scholar]
- 5. Marcobal A, Sonnenburg JL. 2012. Human milk oligosaccharide consumption by intestinal microbiota. Clin. Microbiol. Infect. 18(Suppl 4):12–15 [DOI] [PMC free article] [PubMed] [Google Scholar]
- 6. Coppa GV, Gabrielli O, Zampini L, Galeazzi T, Ficcadenti A, Padella L, Santoro L, Soldi S, Carlucci A, Bertino E, Morelli L. 2011. Oligosaccharides in 4 different milk groups, Bifidobacteria and Ruminococcus obeum. J. Pediatr. Gastroenterol. Nutr. 53: 80– 87 [DOI] [PubMed] [Google Scholar]
- 7. Gopal PK, Gill HS. 2000. Oligosaccharides and glycoconjugates in bovine milk and colostrum. Br. J. Nutr. 84(Suppl 1):S69–S74 [DOI] [PubMed] [Google Scholar]
- 8. Fallani M, Young D, Scott J, Norin E, Amarri S, Adam R, Aquilera M, Khanna S, Gil A, Edwards CA, Dore J, INFABIO team. 2010. Intestinal microbiota of 6-week-old infants across Europe: geographic influence beyond delivery mode, breast-feeding, and antibiotics. J. Pediatr. Gastroenterol. Nutr. 51: 77– 84 [DOI] [PubMed] [Google Scholar]
- 9. Yatsunenko T, Rey FE, Manary MJ, Trehan I, Dominguez-Bello MG, Contreras M, Magris M, Hidalgo G, Baldassano RN, Anokhin AP, Heath AC, Warner B, Reeder J, Kuczynski J, Caporaso JG, Lozupone CA, Lauber C, Clemente JC, Knights D, Knight R, Gordon JI. 2012. Human gut microbiome viewed across age and geography. Nature 486: 222– 227 [DOI] [PMC free article] [PubMed] [Google Scholar]
- 10. WHO Multicentre Growth Reference Study Group 2006. Breastfeeding in the WHO Multicentre Growth Reference Study. Acta Paediatr. Suppl. 450: 16– 26 [DOI] [PubMed] [Google Scholar]
- 11. Favier CF, Vaughan EE, De Vos WM, Akkermans ADL. 2002. Molecular monitoring of succession of bacterial communities in human neonates. Appl. Environ. Microbiol. 68: 219– 226 [DOI] [PMC free article] [PubMed] [Google Scholar]
- 12. Koenig JE, Spor A, Scalfone N, Fricker AD, Stombaugh J, Knight R, Angenent LT, Ley RE. 2011. Succession of microbial consortia in the developing infant gut microbiome. Proc. Natl. Acad., Sci. U. S. A. 108(Suppl 1):4578–4585 [DOI] [PMC free article] [PubMed] [Google Scholar]
- 13. Mah KW, Chin VI, Wong WS, Lay C, Tannock GW, Shek LP, Aw MM, Chua KY, Wong HB, Panchalingham A, Lee BW. 2007. Effect of a milk formula containing probiotics on the fecal microbiota of Asian infants at risk of atopic diseases. Pediatr. Res. 62: 674– 679 [DOI] [PubMed] [Google Scholar]
- 14. Tissier H. 1905. Repartition des microbes dans l'intestin du nourrisson. Ann. Institut Pasteur (Paris) 19: 109– 123 [Google Scholar]
- 15. Dowd SE, Callaway TR, Wolcott RD, Sun Y, McKeehan T, Hagevoort RG, Edrington TS. 2008. Evaluation of the bacterial diversity in the feces of cattle using 16S rDNA bacterial tag-encoded FLX amplicon pyrosequencing (bTEFAP). BMC Microbiol. 8: 125– 132 [DOI] [PMC free article] [PubMed] [Google Scholar]
- 16. Matsuki T, Watanabe K, Fujimoto J, Kado Y, Takada T, Matsumoto K, Tanaka R. 2004. Quantitative PCR with 16S rRNA-gene-targeted species-specific primers for analysis of human intestinal bifidobacteria. Appl. Environ. Microbiol. 70: 167– 173 [DOI] [PMC free article] [PubMed] [Google Scholar]
- 17. Wang R, Cao W, Cerniglia C. 1996. PCR detection and quantitation of predominant anaerobic bacteria in human and animal fecal samples. Appl. Environ. Microbiol. 62: 1242– 1247 [DOI] [PMC free article] [PubMed] [Google Scholar]
- 18. Roy D, Ward P, Champagne G. 1996. Differentiation of bifidobacteria by use of pulsed-field gel electrophoresis and polymerase chain reaction. Int. J. Food Microbiol. 29: 11– 29 [DOI] [PubMed] [Google Scholar]
- 19. Palmer C, Bik EM, DiGiulio DB, Relman DA, Brown PO. 2007. Development of the human infant intestinal microbiota. PLoS Biol. 5: e177 doi:10.1371/journal.pbio [DOI] [PMC free article] [PubMed] [Google Scholar]
- 20. Caporaso JG, Kuczynski J, Stombaugh J, Bittinger K, Bushman FD, Costello EK, Fierer N, Pena AG, Goodrich JK, Gordon JI, Huttley GA, Kelley ST, Knights D, Koenig JE, Ley RE, Lozupone CA, McDonald D, Muegge BD, Pirrung M, Reeder J, Sevinsky JR, Turnbaugh PJ, Walters WA, Widmann J, Yatsunenko T, Zaneveld J, Knight R. 2010. QIIME allows analysis of high-throughput community sequencing data. Nat. Methods 7:335– 336 [DOI] [PMC free article] [PubMed] [Google Scholar]
- 21. Sgorbati B, Biavati B, Palenzona D. 1995. The genus Bifidobacterium, p 279–306 In Wood BJB, Holzapfel WH. (ed), The lactic acid bacteria, vol 2. The genera of lactic acid bacteria. Blackie Academic and Professional, London, United Kingdom [Google Scholar]
- 22. Marcobal A, Barboza M, Sonnenburg ED, Pudlo N, Martens EC, Desai P, Lebrilla CB, Weimer BC, Mills DA, German JB, Sonnenburg JL. 2011. Bacteroides in the infant gut consume milk oligosaccharides via mucus-utilization pathways. Cell Host Microbe 10: 507– 514 [DOI] [PMC free article] [PubMed] [Google Scholar]
- 23. Toral PG, Belenguer A, Shinfield KJ, Hervas G, Toivonen V, Frutos P. 2012. Fatty acid composition and bacterial community changes in the rumen fluid of lactating sheep fed sunflower oil plus incremental levels of marine algae. J. Dairy Sci. 95: 794– 806 [DOI] [PubMed] [Google Scholar]
- 24. Harmsen HJM, Wildeboer-Veloo AC, Raangs GC, Wagendorp AA, Klijn N, Bindels JG, Welling GW. 2000. Analysis of intestinal flora development in breast-fed and formula-fed infants by using molecular identification and detection methods. J. Pediatr. Gastroenterol. Nutr. 30: 61–67. [DOI] [PubMed] [Google Scholar]
- 25. Hopkins MJ, Macfarlane GT, Furrie E, Fite A, Macfarlane S. 2005. Characterisation of intestinal bacteria in infant stools using real-time PCR and Northern hybridisation analyses. FEMS Microbiol. Ecol. 54:77– 85 [DOI] [PubMed] [Google Scholar]
- 26. Lee H, An HJ, Lerno LA, German JB, Lebrilla CB. 2011. Rapid profiling of bovine and human milk gangliosides by matrix-assisted laser desorption/ionization Fourier transform ion cyclonic resonance mass spectrometry. Int. J. Mass Spectrom. 305: 138– 150 [DOI] [PMC free article] [PubMed] [Google Scholar]
- 27. Wongtrakul-Kish K, Kolarich D, Pascovici D, Joss JL, Deane E, Packer NH. 10 October 2012. Characterization of N- and O-linked glycosylation changes in milk of the tammar wallaby (Macropus eugenii) over lactation. Glycoconj. J. [Epub ahead of print.] doi:10.1007/s10719-012-9452-8 [DOI] [PubMed] [Google Scholar]
- 28. Balamurugan R, Magne F, Balakrishnan D, Suau A, Ramani S, Kang G, Ramakrishna BS. 2010. Fecal bifidobacteria in Indian neonates and the effect of asymptomatic rotavirus infection during the first month of life. Indian J. Med. Res. 132: 721– 727 [PMC free article] [PubMed] [Google Scholar]
- 29. Tsuji H, Oozeer R, Matsuda K, Matsuki T, Ohta T, Nomoto K, Tanaka R, Kawashima M, Kawashima K, Nagata S, Yamashiro Y. 2012. Molecular monitoring of the development of intestinal microbiota in Japanese infants. Benef. Microbes 3: 113– 125 [DOI] [PubMed] [Google Scholar]
- 30. Young SL, Simon MA, Baird MA, Tannock GW, Bibiloni R, Spencely K, Lane JM, Fitzharris P, Crane J, Town I, Addo-Yobo E, Murray CS, Woodcock A. 2004. Bifidobacterial species differentially affect expression of cell surface markers and cytokines of dendritic cells harvested from cord blood. Clin. Diagn. Lab. Immunol. 11: 686– 690 [DOI] [PMC free article] [PubMed] [Google Scholar]
- 31. Roger LC, Costabile A, Holland DT, Hoyles L, McCartney AL. 2010. Examination of fecal Bifidobacterium populations in breast- and formula-fed infants during the first 18 months of life. Microbiology 156: 3329– 3341 [DOI] [PubMed] [Google Scholar]
- 32. Turroni F, Peano C, Pass DA, Foroni E, Severgnini M, Claesson MJ, Kerr C, Hourihane J, Murray D, Fuligni F, Gueimonde M, Margolles A, De Bellis G, O'Toole PW, Van Sinderen D, Marchesi JR, Ventura M. 2012. Diversity of bifidobacteria within the infant gut microbiota. PLoS One 7(5):e36957 doi:10.1371/journal.pone.0036957 [DOI] [PMC free article] [PubMed] [Google Scholar]
- 33. LoCascio RG, Desai P, Sela DA, Weimer B, Mills DA. 2010. Broad conservation of milk utilization genes in Bifidobacterium longum subsp. infantis as revealed by comparative genomic hybridization. Appl. Environ. Microbiol. 76: 7373– 7381 [DOI] [PMC free article] [PubMed] [Google Scholar]
- 34. Rinne M, Gueimonde M, Kalliomaki M, Hoppu U, Salminen S, Isolauri E. 2005. Similar bifidogenic effects of prebiotic-supplemented partially hydrolyzed infant formula and breastfeeding on infant gut microbiota. FEMS Immunol. Med. Microbiol. 43: 59– 65 [DOI] [PubMed] [Google Scholar]