

SUMMARY
Patterns of dementia are known to fall into dissociated but dispersed brain networks, suggesting that the disease is transmitted along neuronal pathways rather than by proximity. This view is supported by neuropathological evidence for “prion-like” transsynaptic transmission of disease agents like misfolded tau and beta amyloid. We mathematically model this transmission by a diffusive mechanism mediated by the brain’s connectivity network obtained from tractography of 14 healthy-brain MRIs. Subsequent graph theoretic analysis provides a fully quantitative, testable, predictive model of dementia. Specifically, we predict spatially distinct “persistent modes,” which, we found, recapitulate known patterns of dementia and match recent reports of selectively vulnerable dissociated brain networks. Model predictions also closely match T1-weighted MRI volumetrics of 18 Alzheimer’s and 18 frontotemporal dementia subjects. Prevalence rates predicted by the model strongly agree with published data. This work has many important implications, including dimensionality reduction, differential diagnosis, and especially prediction of future atrophy using baseline MRI morphometrics.
INTRODUCTION
Dementia is estimated to affect 25 million people worldwide, of whom 30%–70% have Alzheimer’s disease (AD) and 10% frontotemporal dementia (FTD). Neuropathological evidence points to a neuronal/synaptic poliencephalopathy (Braak et al., 2000), with the disease beginning in the gray matter with accumulation of misfolded beta amyloid and/or tau protein and progressing along extant fiber pathways via secondary Wallerian degeneration, disconnection, and loss of signaling, axonal reaction, and postsynaptic dendrite retraction (Seeley et al., 2009). Atrophy patterns captured from longitudinal magnetic resonance imaging (MRI) (Apostolova et al., 2007; Thompson et al., 2003) via segmentation, atlas-based parcellation (Wu et al., 2007), and volumetric analysis (e.g., FreeSurfer [Fischl et al., 2002], FMRIB Software Library [FSL] [Smith et al., 2004], and statistical parametric mapping [SPM] [Klauschen et al., 2009]) indicate that progression occurs along vulnerable fiber pathways rather than by proximity (Villain et al., 2008; Englund et al., 1988; Kuczynski et al., 2010). This view is supported by recent studies showing alterations in brain networks due to neurodegeneration (He et al., 2008; Lo et al., 2010). Amyloid deposition, metabolism, and atrophy in AD show spatially distinct involvement of the posterior temporal heteromodal network (Buckner et al., 2005; Acosta-Cabronero et al., 2010), while the frontal (behavioral) variant of FTD (bvFTD) appears restricted to the orbitofrontal network. These findings led to the network-degeneration view that various dementias selectively target distinct intrinsic brain networks (Seeley et al., 2009; Zhou et al., 2010; Buckner et al., 2005; Du et al., 2007).
This view is strongly supported by new neuropathological evidence that numerous disease proteins, including alpha-synuclein, beta-amyloid, and TDP-43, have the capacity to misfold and march throughout local and then long-range circuits via transsynaptic spread (Palop and Mucke, 2010; Frost et al., 2009b). Misfolded proteins can trigger misfolding of adjacent same-species proteins, which in turn cascade along neuronal pathways. Pathological tau conformers can induce nonfolded tau to adopt pathological conformations (Frost et al., 2009b). Tau misfolding could propagate from the exterior to the interior of a cell (Frost et al., 2009a). These findings suggest a “prion-like” mechanism of transmission underlying all dementias (Frost and Diamond, 2010). However, both the network-degeneration view and supporting pathological data are descriptive rather than explicative, qualitative rather than model-based.
In this paper, we ask (1) what biophysical model might capture the microscopic properties of prion-like disease progression and (2) what are its macroscopic consequences? To answer the first question we propose a diffusive mechanism, a classic model of random dispersion driven by concentration gradients with wide physiological applicability, for instance in modeling neuronal apoptosis dynamics via diffusible “death factors” (Lomasko and Lumsden, 2009) and neuronal transport and transsynaptic movement of neurotransmitters (Barreda and Zhou, 2011). Diffusive spread is an excellent model for any disease-causing agent (e.g., tau, amyloid, or synuclein) whose interneuronal advance fulfills the criterion that the rate of propagation is proportional to concentration-level differentials—see, for instance, Hardy (2005). In this paper, we derive the behavior of this diffusive prion-like propagation on whole-brain structural connectivity networks, obtained from whole-brain tractography of diffusion MRI scans.
To answer the second question, of the macroscopic consequences of prion-like diffusive progression, we restrict this diffusive progression to follow the fiber pathways defined by the brain connectivity network and mathematically derive the resulting macroscopic dynamics of this progression. The main objective of this study was to determine whether the macroscopic consequences of this kind of diffusive prion-like propagation on the whole-brain healthy network (henceforth called the “network diffusion model”) are consistent with, or predictive of, the large-scale patterns of disease seen in various dementias. First, we show that the network diffusion model implies the presence of “eigenmodes” representing distinct spatial patterns that bear a strong resemblance to known patterns of various dementias. Using statistical correlation analysis, we found strong evidence that there is a one-to-one correspondence between the healthy network’s eigenmodes and atrophy patterns of normal aging, AD, and bvFTD. Interestingly, these eigenmodes also recapitulate recent findings of dissociated brain networks selectively targeted by different dementias (Seeley et al., 2009; Zhou et al., 2010; Buckner et al., 2005; Du et al., 2007). This may help provide a systemic explanation for the network degeneration theory, hitherto unexplained, as a simple consequence of network dynamics. The network diffusion model can accurately infer the population-wide prevalence rates of various dementias and can explain, why bvFTD has higher prevalence than AD in early stages, and why it subsequently becomes much less prevalent than AD.
There is no need to invoke region-specific neuropathy, e.g., mesial temporal origin (Braak et al., 2000), or selective vulnerability within dissociated functional networks (Seeley et al., 2009). This implies that all dementias, hitherto considered pathophysiologically and etiologically distinct, might share a common progression mechanism. We demonstrate the role of network eigenmodes as biomarkers and as highly effective basis functions for dimensionality reduction, classification, and automated differential diagnosis. This might be especially advantageous for heterogeneous and mixed dementia, which are poorly served by classically described clinical phenotypes. Most important, the model provides a clear path for predicting future atrophy in individuals starting from baseline scans.
RESULTS
Visual Correspondence between Eigenmodes and Dementias
Figure 1 provides an overview of the datasets and processing steps, with network analysis using 14 healthy young subjects (left panel) and volumetric analysis of T1-weighted MRI scans of 18 AD, 18 bvFTD, and 19 age-matched normal subjects (right panel). The t-statistic of cortical volumes of AD and bvFTD patients, normalized by young healthy controls, are shown in Figures 2 and 3 as wire-and-ball plots, along with the values of two eigenmodes of the healthy network evaluated at the same brain regions. The wires denote network connections, the size of each ball is proportional to the atrophy level in that region of interest (ROI) (normalized by ROI size), and the color denotes lobar membership. ROIs showing negative atrophy are considered statistical noise and are not shown. T-scores of cortical atrophy as well as eigenmodes are shown in Figure 4 mapped on the cortical surface of the 90-region cerebral atlas. Extreme levels (±2 SD from mean values) were capped to aid visualization. Since the colors are uniform within each ROI, the apparent spatial resolution of these surface renderings may be somewhat deceptive. Note that the ball-wire plots are not directly comparable due to the above color scaling and absence of subcortical structures in the surface maps. The crucial observation is that persistent eigenmodes of network diffusion appear homologous to characteristic atrophy patterns observed in various dementias.
Figure 1. Process Diagram Depicting Our Methodology.

(Left) Structural healthy brain networks were obtained from diffusion MRI scans of 14 young healthy volunteers, followed by whole brain tractography. The nodes of this network correspond to cortical and subcortical gray matter regions obtained from a labeled T1-weighted brain atlas, and the edges of this network are proportional to the number and strength of the fiber tracts that connect the nodes. Proposed network diffusion model and its eigenmodes are derived from this healthy network. The first three eigenmodes, which we have hypothesized to be predictive of dementia atrophy patterns, are then tabulated and plotted.
(Right) We then compare the predicted patterns with measured atrophy of dementia patients (AD, bvFTD, and age-matched normal subjects), obtained via a completely separate processing pipeline, available in the SPM Matlab toolbox. T1-weighted images of each subject were coregistered with the same atlas as in the left panel, and gray-matter regions were parcellated using the prelabeled atlas information. Volume of each cortical and subcortical gray-matter region was measured. The atrophy of each region was obtained in terms of a t-statistic between the diseased and age-matched normal groups. Finally, the predicted and measured atrophy patterns were statistically compared using correlation analysis.
Figure 2. Visual Correspondence between Theoretical Prediction and Measured Alzheimer’s Atrophy Pattern.

Theoretical prediction is based on the second eigenmode of the young healthy brain network’s Laplacian matrix H. Measured Alzheimer’s atrophy pattern is based on t-scores of gray-matter volumes in 18 Alzheimer’s subjects). We have depicted whole-brain atrophy patterns using a wire-and-ball mesh plot, where each parcellated GM region in the brain is represented by a node in the network, depicted as a ball. The connectivity between two regions is depicted by a wire whose thickness denotes connection strength. Note that the network depicted here was separately obtained from the young healthy cohort, and is identical in all panels.
(Top) Predicted distribution, where the value of the second eigenmode at each node is denoted by the size of the corresponding ball.
(Bottom) Measured atrophy (t-statistic) of all 18 AD subjects in our study. Again the size of the ball represents the amount of atrophy measured in the corresponding GM region. The regions are color coded by lobe (blue, frontal lobe structures; purple, parietal lobe; green, occipital lobe, red, temporal lobe, and cyan, subcortical). A close homology is observed between predicted and measured atrophy patterns.
See also Figures S1–S3 and S5.
Figure 3. Visual Correspondence between Theoretical Prediction and Measured Atrophy Patterns.

(Top) The third eigenmode of young healthy whole brain connectivity network’s Laplacian matrix.
(Bottom) Measured atrophy (t-statistic) in our 18 bvFTD subjects. A close homology is observed between the theoretical and measured atrophy patterns.
See also Figures S2 and S3.
Figure 4. Cortical Atrophy of AD and bvFTD, and the Second and Third Eigenmodes Atrophy Scores Are Mapped onto the Cortical Surface Using the 90 Region AAL Cerebral Atlas.

Atrophy, as well as eigenmode values, were converted into z-scores and mapped to the range shown by the colorbar. Extreme levels (±2 SD from mean value) were assigned the maximum/minimum color. Although there are areas of disagreement with our volumetric data, the eigenmodes roughly resemble the classic atrophy patterns seen in each disease.
The first (steady-state) eigenmode, whose eigenvalue is zero, is not shown here, because it is relatively uninteresting, varying simply according to region size, in rough correspondence to atrophy seen in normal aging. In order to ensure that these results are not due to a specific choice of volumetric algorithm or choice of anatomic atlas, we repeated the same study using volumetric data obtained by the FreeSurfer software (Fischl et al., 2002) and a different 86-region atlas (Figure 5). Measured atrophy patterns generally match the cortical atrophy seen using the automated anatomic labeling (AAL) atlas (Figure 4), but exact match is not to be expected due to both methodological as well as ROI size and shape differences. It is important to note, however, that the visual correspondence between eigenmodes and atrophy remains intact, and the former generally agree with classic AD/bvFTD pathology, which implies that these results are not methodology-specific. We show later (Figures S5 and S6 available online) that our results are also insensitive to inter-subject variability.
Figure 5. Cortical Atrophy and Eigenmodes Mapped onto the Cortical Surface using a Different Atlas.

Scores are mapped onto the cortical surface using the 86-region FreeSurfer atlas. Volumetric data were obtained by the FreeSurfer software and the brain network was also recomputed under this new parcellation. Measured atrophy patterns generally match the cortical atrophy seen using the AAL atlas (Figure 4), but exact match is not to be expected due to both methodological and ROI size and shape differences. It is important to note, however, that measured atrophy is still roughly in accordance with the eigenmodes, which remain consistent with classic AD/bvFTD pathology.
Comparison of Eigenmodes with Measured and Published Atrophy Findings
The second-most persistent mode (Figures 2 and 4, top rows) closely resembles typical Alzheimer’s atrophy in mesial temporal, posterior cingulate, and limbic structures, as well as lateral temporal and dorsolateral frontal cortex (Apostolova et al., 2007; Thompson et al., 2003). This eigenmode shows strong involvement of the medial and lateral temporal lobes, which are involved in memory, and the dorsolateral prefrontal cortex, implicated in working memory (Curtis and D’Esposito, 2003). The main fibers connecting these regions are the superior longitudinal fasciculus (SLF), the splenium of corpus callosum, and the cingulum bundle. While agreement is good with our own volumetric findings (Figures 2 and 4, bottom rows) and excellent with the published literature (see, for instance, Apostolova et al., 2007; Thompson et al., 2003; Seeley et al., 2009), there were some areas of disagreement with our volumetric findings in the parietal, frontolateral, and frontoinsular areas. We attribute these differences to small sample size and technical limitations of tractography, co-registration, and volumetrics.
The third persistent eigenmode (Figures 3 and 5, top rows) is in good agreement with our bvFTD data (Figures 3 and 5, bottom rows) and published findings (Du et al., 2007; Boxer and Miller, 2005; Seeley et al., 2009), which indicate prominent atrophy in the orbitofrontal and anterior cingulate regions. This eigenmode is particularly strong in the lateral temporal lobe and the superior frontal, dorsolateral, and orbital cortices— areas that deal with executive function, decision making, expectation, balancing risk versus reward, and inhibition. Degeneration of the orbito-frontal cortex was linked to disinhibited behavior, and the superior frontal gyrus has been associated with self-awareness (Goldberg et al., 2006). The main fiber bundles connecting these regions are the SLF, genu of corpus callosum, and uncinate fasciculus.
The clear temporal and frontal involvement predicted by our model is, if anything, closer to the classic bvFTD patterns than is shown by our bvFTD patients (Seeley et al., 2008; Broe et al., 2003). We attribute these discrepancies to clinical heterogeneity in our bvFTD cohort, whose risk of misdiagnosis based purely on clinical presentation (Neary et al., 1998) is high, around 20%–30% (Rabinovici and Jagust, 2009), and to pathological heterogeneity (Gorno-Tempini et al., 2004; Pereira et al., 2009). Temporal atrophy commonly attributed to bvFTD might represent a different disease altogether (Gorno-Tempini et al., 2004). Finally, early bvFTD is known to affect frontal regions primarily but spreads to the temporal lobe over time (Seeley et al., 2008; Broe et al., 2003). This behavior is predicted by our model: after the third eigenmode corresponding to bvFTD has run its course (half-life 1/λ3), subsequent degeneration will primarily follow eigenmode 2 (much longer half-life 1/λ2) corresponding to AD and exhibiting prominent temporal involvement. This may also explain repeated findings of AD pathology in clinically diagnosed bvFTD (Broe et al., 2003; Neary and Snowden, 1996).
The fourth and higher eigenmodes probably capture degenerative processes occurring less frequently, as well as the heterogeneity found in common dementias. Since higher modes are eventually overtaken by more persistent modes, they are harder to isolate in aged populations. The parietal and cingulate atrophic pattern of the fourth eigenmode in Figure S3 is somewhat suggestive of Huntington’s disease and corticobasal degeneration (Rosas et al., 2008; Boxer et al., 2006) and might act as a conduit for these rare genetic diseases.
Taken together, the spatial patterns described by our eigenmodes are homologous to dementia patterns described in several studies and to our own small sample of AD and bvFTD subjects; they also bear a resemblance to recently observed spatially distinct networks characterized internally by close functional correlations (Zhou et al., 2010; Du et al., 2007; Seeley et al., 2009).
Correlation with Measured Atrophy Patterns
The t-statistic of parcellated diseased versus young healthy volumes was correlated against each hypothesized eigenmode and plotted in Figure 6. In addition we show correlations involving the mean young healthy ROI volume data, tvol, in order to test our supposition that the first eigenmode, u1, simply reflects the size of each region. Pearson’s correlation coefficient and the p value of a one-sided t test are also given, and they indicate statistically significant correlation at the level of α < 0.05 for the diagonal plots, but not for the “cross” plots. The sole discordant result is the high correlation observed between u2 and bvFTD, which is again attributable to the unusually high temporal involvement seen in our bvFTD subjects. The strong correlation between normal aging and the first eigenmode (Figure S4) supports the hypothesis that the latter corresponds to normal aging. While the ROI-wise correlation is highly significant and the match is very good in proximate neighborhoods, small discrepancies are apparent (Figures 2, 3, 4, and 5) and preclude complete correspondence between measured and predicted atrophy. These discrepancies might be attributed to methodological limitations, the small sample size, clinical/pathological heterogeneity, and possible misdiagnosis of dementia patients.
Figure 6. Correlations between Measured Atrophy of AD/bvFTD versus Predicted Atrophy from the First Three Eigenmodes of the Young Healthy Network.

The x axis in each panel represents a measured statistic: normal ROI volume (top), t-score of ROI volume of AD versus age-matched control groups (middle), and t-score of ROI volume of bvFTD versus age-matched control (bottom). The y axes are eigenmodes of the healthy network: u1 (left column), u2 (middle column), and u3 (right column). Each dot in the scatter plots represents a single GM region, and dots are color coded by lobe. A line of best fit is also shown in each panel. Correlations within diagonally located panels are high, and correlations in off-diagonal panels are low. Plots that show significance in both Pearson correlation and the two-group t test are indicated by green boxes, and they are along the diagonal panels. This validates our hypothesis that there is a one-to-one correspondence between eigenmodes and dementia atrophy.
See also Figures S4 and S5 and Supplemental Experimental Procedures.
To overcome the problem of multiple comparisons, we assessed a separate measure of statistical significance. As in Seeley et al. (2009), we separate the measured atrophy pattern of each disease state into two groups of ROIs: (1) atrophied ROIs (t-statistic > 1), and (2) the remaining ROIs. The atrophied ROIs coincided with well-known regions affected in each disease. (For the young healthy subjects’ ROI volume data, tvol, the set 1 consists simply of the largest regions by volume.) Then we use a one-tailed t test to test whether the predicted atrophy pattern of nodes in these two sets (1 and 2) are statistically different and report the p values in Figure 6 under p2. Thus, two separate measures of significance are used to substantiate our main hypothesis—that there is a one-to-one correspondence between dementias and network eigenmodes.
Diagnostic Power of Persistent Modes
We now show that persistent modes form an effective and parsimonious basis on which atrophy data can be projected for differential diagnosis. Figure 7A shows the mean within each dementia group of the relative strength of the dot product, d(k,n), which is a projection of the atrophy pattern of the kth subject onto the nth eigenmode. A one-to-one correspondence between dementias and eigenmodes is obvious: the normal aging group exhibits the highest contribution from the first eigenmode, u1; the AD group displays the highest contribution from u2; and the bvFTD displays the highest contribution from u3. Figure 7B is a scatter plot of d(k,n = 1,2,3) for AD and bvFTD subjects. There is visually appreciable separation between the two groups, indicating that the eigenmodes are acting as an effective basis for dimensionality reduction and classification. The classification receiver operating characteristic (ROC) curve using projections onto the four smallest eigenmodes is shown in Figure 7D, along with the ROC of a direct dimensionality reduction using principal components analysis (PCA). It is noteworthy that PCA, which is conventionally the “optimum” reduced-space representation, does not produce better classification than eigenmodes. Since classifier accuracy depends on the number of basis vectors, in Figure 7C we plot the area under the ROC curve as a function of the dimensionality of the feature space for both eigenmodes and PCA. Clearly, eigenmodes appear to do a better job of dimensionality reduction and diagnostic classification than PCA. Note that some false positives for both classifiers are expected due to clinical misdiagnosis.
Figure 7. Demonstrating the Utility of the Eigenmodes for Dimensionality Reduction, Differential Diagnosis, and Classification.

(A) Mean dot product between atrophy and the first three eigenmodes for each dementia group. The aged but cognitively normal group shows mixed presence of all three eigenmodes, whereas the other two disease groups show primary presence of the eigenmode hypothesized to be associated with the disease.
(B) Scatter plot of the dot product in (A) for AD and bvFTD subjects, showing clear separation of the two groups after projection onto the eigenmodes.
(C) Area under the ROC curve of three-way classification at various dimensions of feature space, based on eigenmodes as well as PCA. This plot shows that the eigenmodes are doing at least as good a job of dimensionality reduction as the principal components analysis.
(D) ROC curve of both classifiers, using four features each. The blue curve corresponds to classification using the first four eigenmodes of network diffusion, while the red curve corresponds to classification using the first four principle components of the atrophy z-scores. Clearly, the eigenmodes provide better classifiability in terms of area under the ROC curve.
See also Figure S5.
Prediction of Population-wide Prevalence Rates
Figure 8 (left) shows the correlation between 1/λi and published prevalence rates of three major degenerative disorders. The predicted order of prevalence matches published data: AD (highest prevalence), then bvFTD, then Huntington’s (which was included as an example of a rare degenerative disorder with similarities to the fourth eigenmode). Figure 8 (right) shows that the prevalence of AD and bvFTD as a function of age generally agrees with the curves predicted by our model at almost all ages. Since theoretical prevalence relies on the unknown disease progression rate, β, and the age of onset (i.e., when to consider t = 0)—neither of which are available a priori—we optimized these for best fit with published data. This is justified, because the unknown parameters are not arbitrary but fully natural physiological parameters. The model correctly predicts that early prevalence of bvFTD should be higher than AD, equaling AD at around 60 years of age, mirroring recent prevalence studies of AD and bvFTD under 65 years (Ratnavalli et al., 2002). The model also correctly predicts that with age the relative prevalence of AD versus bvFTD should increase (Boxer et al., 2006). While predicted bvFTD prevalence is a bit higher than published prevalence, we note that FTD is now considered highly under-diagnosed (Ratnavalli et al., 2002). Considering the highly variable and cohort-dependent nature of known prevalence studies, the strong agreement provides further support to the model.
Figure 8. Prevalence Rate of Various Dementias as Percentage of All Dementias.
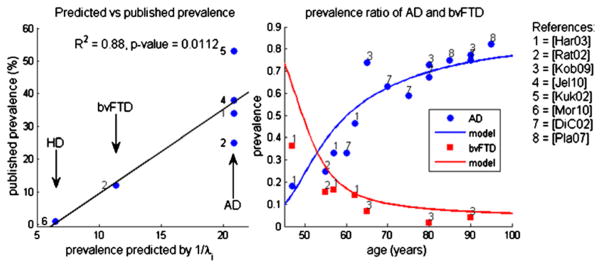
(Left) Published prevalence versus survival time predicted by network model. Note the strength of linear regression showing highly significant correlation.
(Right) Published and predicted relative prevalence of AD versus bvFTD as a function of age. The numbers indicate the publication from which the nearby data point was obtained. Solid curves pertain to parameter-optimized model prediction. The curve shows extremely good fit of the model to published prevalence data, especially in later stages of life for which we have more reliable prevalence data. The theoretical prevalence of bvFTD is higher than measured prevalence in early stages of life, perhaps due to either model error or systematic under-estimation of bvFTD in younger populations.
Bootstrap Analysis of Variability among Subjects
Although our hypotheses were validated using group means of atrophy and connectivity, individual subjects are known to vary greatly in both. Hence, we must address the question of natural intersubject variability. How sensitive are the presented results to the choice of particular subjects used in our study, given our moderate sample size? We performed a principled statistical analysis using bootstrap sampling with replacement (details in Supplemental Experimental Procedures) which simulates the variability within a sample group by resampling the group multiple times. In Figure S5, we show histograms of various test statistics germane to this paper. We conclude that the data available in this study provide self-consistent results, with no bias associated with our choice of group-mean networks and atrophy.
DISCUSSION
We have shown that the macroscopic modeling of dementia patterns as a diffusive prion-like propagation can recapitulate classic patterns of common dementias. Our conclusions are not liable to be significantly altered due to choice of volumetric or network algorithm (Figure 5) or due to intersubject variability (Figure S5). There are several implications of these findings.
Clinical and Diagnostic Implications
The predicted time evolution of various eigenmodes of the diffusion model bears a strong correlation with the age-dependent prevalence rates of both AD and bvFTD. To our knowledge, no other existing model can accurately match this strong age dependence observed in prevalence studies in dementia. From the classification and principal components analysis (Figure 7) we conclude that network diffusion eigenmodes are an effective basis for dimensionality reduction of atrophy in dementia, producing even better classification accuracy than the optimal basis identified by PCA. This suggests a possible role for our model in unsupervised, automated, and regionally unbiased differential diagnosis of various dementias. Instead of dealing with high-dimensional and complex whole-brain atrophy patterns, future neuroradiologists might simply look at the relative contribution of the first three to four eigenmodes in any person’s brain and treat them as clinical biomarkers. This approach could be especially helpful in cases of mixed dementia, where classical region-based atrophy descriptors might prove unsatisfactory.
However, the most important clinical application of this model could well be in the prediction of cognitive decline. Starting from baseline MRI volumetrics for estimation of model parameters, the model in Equation 1 can be subsequently used to predict future atrophy of an individual subject. If the measured and predicted “future” atrophy are deemed statistically close, then it would serve to further validate our hypotheses as well as provide a valuable prognostic aid to the clinician. This will allow a neurologist to predict what the patient’s neuroanatomic, and therefore cognitive, state will be at any given point in the future. Knowledge of what the future holds will allow patients to make informed choices regarding their lifestyle and therapeutic interventions.
Relationship to Network Degeneration Hypothesis
Figures 2, 3, 4, and 5 present an uncanny parallel to recent findings of network degeneration. That brain networks are altered in neurodegeneration is now established (He et al., 2008; Lo et al., 2010). Distinct, nonoverlapping spatial patterns are seen in AD and bvFTD (Zhou et al., 2010; Du et al., 2007), which Seeley et al. characterized as belonging to the default mode and salience networks, respectively. The relation between dementia and separate intrinsic connectivity networks (ICNs) (Seeley et al., 2009) appears convincing, but the underlying cause remains unexplained. Conjectures regarding selective vulnerability of different functional networks sharing synchronous neural activity, region-specific functional loads, or some as yet unknown structural, metabolic, and physiological aspects of neural network biology were put forth (Saxena and Caroni, 2011). Buckner et al. (2005) conjectured that early metabolic activity in the default network is somehow later implicated in AD progression.
Interestingly, our macroscopic diffusion model can explain these findings without requiring any kind of selective vulnerability, regional specificity, or shared functional load. We note that our persistent eigenmodes and functional ICNs are roughly homologous, because ultimately they are both the result of eigen decomposition (PCA) of implicit brain networks. When ICNs are obtained using hierarchical graph clustering of functional correlation networks, they are mathematically congruent with eigenmodes of network Laplacian (Kondor and Lafferty, 2002). This congruence may explain why dementias appear to fall into distinct ICNs—a strictly mechanical consequence of diffusive network dynamics. Even with possibly random starting configurations, network dynamics are sufficient to produce regional specificity; however, this does not imply that the conventional focal origin or selective vulnerability hypotheses are incorrect. It could be that the starting configuration is dictated by selective vulnerability due to various stressors (Saxena and Caroni, 2011; Palop et al., 2006; Braak et al., 2000; Seeley et al., 2009), but the subsequent patterns are determined by macroscopic network dynamics. Our model merely accommodates a conception of these diseases that is fully consistent with known findings but does not require focal origin or selective vulnerability.
Relationship to Prion-like Cerebral Proteopathy
Our model is based on current evidence of prion-like protein misfolding, which propagates within neurons as well as transsynaptically, where retrograde axonal transport deficits cut off the growth-factor supply to projection neurons, begetting axonal degeneration, synapse loss, and postsynaptic dendrite retraction. There is mounting neuropathological evidence that numerous disease proteins, including tau, alpha-synuclein, beta-amyloid, and TDP-43, have the capacity to misfold and march through neural circuits via transsynaptic spread (Palop and Mucke, 2010; Frost et al., 2009b).
If a common concentration-dependent diffusive prion-like process can reproduce subsequent atrophy patterns, this raises a somewhat unorthodox possibility that diverse degenerative etiologies have common macroscopic consequences. Indeed, our model does not differentiate between individual proteopathic carriers, bunching them together into a generalized “disease factor.” This is justified on two grounds. First, there is a considerable diversity of published opinion on the etiology of neurodegeneration (Saxena and Caroni, 2011) and the effect of individual misfolding proteins (Whitwell et al., 2009; Palop and Mucke, 2010; Frost et al., 2009b). Second, and more important, the specific biochemical properties of the prion-like agent may be inconsequential for the macroscopic and chronic manifestation of disease, as evidenced from recent joint histopathological/morphometric studies. The idea that proteopathic carriers with varied etiology can have a shared progression mechanism via “permissible templating” was first raised by Hardy (2005). The spatial distribution of beta amyloid pathology in AD is poorly correlated with whole brain atrophy patterns (Rabinovici et al., 2010), while tau is well-correlated. However, neither tau nor beta amyloid are specific to AD and are found in semantic dementia, frontotemporal lobar degeneration (FTLD) subtype (Pereira et al., 2009), dementia with Lewy bodies and posterior cortical atrophy (Rabinovici and Jagust, 2009), etc. PIB-positive binding to A-beta and plaques were observed in 25%–45% of cognitively normal older subjects in postmortem autopsy studies (Rabinovici and Jagust, 2009). BvFTD accommodates an even more bewildering array of pathological correlates, including alpha-synuclein, tau, ubiquitin, TDP-43, and Lewy bodies (Whitwell et al., 2005; Forman et al., 2006; Pereira et al., 2009). Pereira et al. found that clinical variants of bvFTD, but not histologic variants, correlated with regional atrophy, and that there was no volumetric difference between tau and ubiquitin bvFTD pathology regardless of clinical subtype. No group-wise differences were found in the atrophy patterns of tau-positive versus TDP-43-positive FTLD cases (Whitwell et al., 2009). These results indicate that clinical presentation of dementias are only dependent on the brain regions they affect, rather than their histopathological correlates.
If true, these findings would provide strong support for our work, which infers macroscopic consequences of proteopathic progression without being encumbered by their specifics. The main contribution of the proposed network diffusion model is that it turns qualitative understanding of proteopathic transmission into a quantitative, fully testable model and provides a plausible alternative explanation for the apparent selective vulnerability of brain regions in various dementias. The network diffusion model does not support the “retrogenesis” hypothesis that AD is a WM-specific disease and is caused by demyelination of late myelinating fiber pathways (Bartzokis, 2004).
Limitations
First-Order Approximation
A model that is informed by the minutiae of the neuropathology of degeneration, melding the most current and detailed histopathological findings, might prove more accurate. Nevertheless, we note that as a first-order approximation, the presented model appears to capture the essential patterns of dementia atrophy. Simple models can sometimes capture the emergent behavior of large-scale complex systems like the brain, which can be surprisingly linear within large phase domains bounded by (nonlinear) phase transitions. Indeed, the emergence of predictable and regular behavior from chaotic ensembles is considered a hallmark of complexity (Shalizi, 2001). For example, the admittance of large electrical networks of capacitative and resistive elements is known to be chaotic, yet its frequency response is essentially linear in large frequency ranges (Almond et al., 2011). This kind of predictable, regular emergent behavior is seen in complex systems as varied as the flocking of geese (Martinez et al., 2007) and complex biological signaling networks (Bhalla, 2002).
Although both atrophy and the network itself must dynamically evolve due to degeneration, our model assumes static networks in order to avoid non-linearity, which will make the eigenmodes uninterpretable. By causing increasing network disconnection, white matter damage may in fact accentuate rather than destroy the main feature of the model, viz separate persistent modes of atrophy. Nevertheless, we intend to investigate nonlinear models in our future work. We will also investigate network models based on neuronal excitability (Santos et al., 2010) rather than proteopathic transmission.
The model should apply to other dementias like Huntington’s, corticobasal syndrome, semantic dementia, and posterior cortical atrophy, but this aspect will require more data. We expect the multiple-comparisons problem will be exacerbated and may become statistically untenable (e.g., 36 comparisons for six dementias). Estimates of both higher eigenmodes and rarer dementias are going to be noisier, and establishing their equivalence may require more accurate brain networks than current technology allows.
Methodology
Several technical challenges are inherent in our processing pipeline. Spatial and angular resolution of current HARDI data is poor, sometimes making co-registration with T1 MRI difficult. Highly atrophied subjects sometimes fail to co-register properly. These problems necessitated manual inspection of co-registration outcomes and rejection of problematic cases. SPM- and FreeSurfer-based volumetrics are known to be noisy, with less-than-perfect test-retest reliability. Although we have mitigated these effects by choosing a relatively coarse network with only 90 large-sized ROIs, they cannot be completely ruled out. Tractography is limited by a “distance bias” and lack of spatial and angular resolution (Behrens et al., 2007). Conventional tractography fails to capture many important but short-curved U-shaped fibers, whereas probabilistic tractography sometimes leads to unrealistic fiber tracts having little anatomic justification. Finally, brain network statistics are liable to vary with the choice and definition of nodes; hence, we have used anatomically defined parcellations to define nodes—an approach that we feel has more physical basis than arbitrary choice of nodes. Although we showed that our results are largely unchanged under two quite different parcellation schemes (SPM and FreeSurfer), the effect of other choices of network nodes remains untested.
EXPERIMENTAL PROCEDURES
Development of a Network Diffusion Model
We model dementia progression as a diffusion process on a hypothesized brain network
 = {
= {
 ,
,
 } whose nodes vi ∈
represent the ith cortical or subcortical gray matter structure, and whose edges, ei,j ∈
, represent white-matter fiber pathways connecting structures i and j. Structures vi comes from parcellation of brain MRI, and connection strength, ci,j, is measured by fiber tractography (Behrens et al., 2007). Consider an isolated population of fibers from an affected (R2) to an unaffected (R1) region. The number of diseased afferents from R2 to R1 is the product of the concentration, x2, of the disease factor and the inter-region connection strength, c1,2. Conversely, there is a reverse diffusion from R1 to R2 proportional to x1c2,1. The total concentration of the disease factor in R1 will therefore increase by β(x2−x1)c1,2
δt in a (short) instant δt, where β is the diffusivity constant controlling propagation speed. Assuming bidirectional pathways, this leads, in the limit δt → 0, to the first-order differential equation:
} whose nodes vi ∈
represent the ith cortical or subcortical gray matter structure, and whose edges, ei,j ∈
, represent white-matter fiber pathways connecting structures i and j. Structures vi comes from parcellation of brain MRI, and connection strength, ci,j, is measured by fiber tractography (Behrens et al., 2007). Consider an isolated population of fibers from an affected (R2) to an unaffected (R1) region. The number of diseased afferents from R2 to R1 is the product of the concentration, x2, of the disease factor and the inter-region connection strength, c1,2. Conversely, there is a reverse diffusion from R1 to R2 proportional to x1c2,1. The total concentration of the disease factor in R1 will therefore increase by β(x2−x1)c1,2
δt in a (short) instant δt, where β is the diffusivity constant controlling propagation speed. Assuming bidirectional pathways, this leads, in the limit δt → 0, to the first-order differential equation:
| (Equation 1) |
A Random Walker Network-Diffusion Model of Propagation
Spectral graph theory provides us with an elegant generalization of Equation 1 to the entire network. Suppose the disease factor at time t at each node in the network is represented by the vector x(t) = {x(v,t), v ∈
}. Then Equation 1 generalizes to the so-called “network heat equation” (Kondor and Lafferty, 2002),
| (Equation 2) |
where H is the well-known graph Laplacian, with
| (Equation 3) |
This is the graph equivalent of the Laplacian diffusion operator, Δx ≜ ∇2x. Since all brain regions are not the same size, we normalize each row and column of the Laplacian by their sums. Note that this model only depends on the long-range transmission of proteopathic carriers, and not on their local “leaking” via synapses and dendrites, which will be restricted to the local microenvironment of gray matter. Since our diffusion model uses relatively large, anatomically distinct structures as brain network nodes, the effect of localized transmission will be predominantly intranode. Disregarding the limited effect of local internode leaking, the network Laplacian H does not depend on self-connectivity within a node.
We hypothesize cortical atrophy in region k to be the accumulation of the disease process in k, modeled as the integral
On the whole brain, this gives . From matrix algebra, Equation 2 is satisfied by
| (Equation 4) |
where x0 is the initial pattern of the disease process, on which the term e−βHt acts essentially as a spatial and temporal blurring operator. We therefore call e−βHt the diffusion kernel, and Equation 4 is interpreted as the impulse response function of the network.
Persistent Modes of Propagation
The computation of Equation 4 is accomplished via the eigenvalue decomposition H = UΛU†, where U = [u1 … uN], giving
| (Equation 5) |
The eigenvalues λi of the Laplacian H are in the interval [0,1], with a single 0 eigenvalue and a small number of near-zero eigenvalues (see Figure S1). Most eigenmodes, ui, correspond to large eigenvalues that quickly decay due to exponentiation, leaving only the small eigenmodes, whose absolute values we denote by “persistent modes,” to contribute (see Figure S2A).
Dynamics
The time evolution of hypothesized atrophy is a linear combination of eigenmodes,
| (Equation 6) |
consisting of a sum of two parts, a deterministic exponential part and a case-dependent random part, determined by the initial configuration x0 of the disease. Figure S2B shows the deterministic part of the first three eigenmodes. Atrophy in all modes increases with time, but lasting and substantial effect is observed only in the persistent modes. The slower the decay rate, the more widespread and severe is the damage.
Relationship to Prevalence Rates
The rate of progression of the ith eigenmode is λi, and its eventual atrophy is . We hypothesize that if eigenmodes are good models of dementia, then population-wide prevalence rates should be reflected by the overall magnitude and rate of progression of the eigenmodes. Assuming that new neurodegenerative attacks target all modes equally, and ignoring genetic predisposition, then for the entire population, 1/λi should roughly translate into eventual prevalence rates of the corresponding dementia. Relative prevalence rates of various dementias as a function of time can similarly be predicted from the relative values of the decay curves (Equation 6) of each eigenmode. We investigate this relationship in subsequent analysis.
Incorporating Time-Varying Neurodegenerative Attacks
Given a time-varying externally driven disease process, a(t), the actual dynamics of the system will be given by its convolution with the diffusion kernel:
| (Equation 7) |
Equation 7 implies that although the disease dynamics depends on an unknown and possibly random external attack process, a(t), its behavior is still constrained within a small number of distinct eigenmodes. Thus, the pathophysiological nature, location, and frequency of neurodegenerative attacks are irrelevant in this model.
Data Description
Healthy Cohort
Axial T1 weighted FSPGR scans (TE = 1.5 ms, TR = 6.3 ms, TI = 400 ms, 15° flip angle) with 230 × 230 × 156 isotropic 1 mm voxels were acquired on a 3 Tesla GE Signa EXCITE scanner from 14 young healthy volunteers under an existing institutional-review-board-approved study, whose details were previously described (Raj and Chen, 2011). All participants signed written consent for this study in fulfillment of the Helsinki Declaration. High Angular Resolution Diffusion Imaging (HARDI) data (55 directions, b = 1000 s/mm2, 72 1.8-mm thick interleaved slices, 128 × 128 matrix size) were also acquired. Age-matched normal, AD, and bvFTD cohorts: Eighteen AD, 18 bvFTD, and 19 age- and gender-matched cognitive normal (CN) fully consenting subjects were scanned on a 4 Tesla (Bruker/Siemens) MRI system with a 3D volumetric MPRAGE sequence (TR/TE/TI = 2300/3/950 ms, 7° flip angle, 1.0 × 1.0 × 1.0 mm3 resolution, 157 continuous sagittal slices) at University of California at San Francisco (UCSF). AD was diagnosed according to published clinical criteria (McKhann et al., 1984, and bvFTD according to consensus clinical criteria established by Neary and Snowden (1996). Clinical diagnoses were not validated using histopathology or imaging, thus opening the possibility of misdiagnosis and pathological heterogeneity, especially in the bvFTD group, whose clinical presentation can frequently look similar to AD or semantic dementia (Rabinovici and Jagust, 2009). Study subject characteristics are summarized in Table 1.
Table 1.
Study Subject Characteristics
| Gender | Healthy Young Control (Age) | Healthy Age-Matched Control | Alzheimer’s | bvFTD |
|---|---|---|---|---|
| Female | 5 (23 ± 5.8) | 8 (61.5 ± 6.8) | 7 (62.1 ± 6.6) | 6 (61.8 ± 8.9) |
| Male | 9 (23.2 ± 4.3) | 11 (61.5 ± 12.5) | 11 (63.2 ± 7.7) | 12 (62.3 ± 11.8) |
Number of subjects (age range, mean ± SD).
Image Processing
Gray-matter (GM) brain regions were parcellated from all subjects’ T1-MRI scans using an atlas-based parcellation scheme (SPM [Klauschen et al., 2009] and individual brain atlases using SPM [IBASPM; Alemán-Gómez et al., 2005]) to extract 116 ROIs, collected in the vector v = {vi|i ∈ [1, N]}. The mean and standard deviation of the ROI volumes were determined for each disease group. Whole-brain networks were extracted from HARDI scans of young healthy subjects only, using previously described methodology (Raj and Chen, 2011; Iturria-Medina et al., 2008). Briefly, Q-ball reconstruction using spherical harmonic decomposition (Hess et al., 2006) is performed to get orientation distribution functions at each voxel. The gray-white interface voxels of the parcellated ROIs of the coregistered MRI/HARDI volumes are used as seed points for probabilistic tractography (Behrens et al., 2007), with 1000 streamlines drawn per seed voxel. Each streamline is assigned a probability score according to established criteria (Iturria-Medina et al., 2008). The connection strength, ci,j, of each ROI pair i,j is estimated by summing the probabilities of the streamlines terminating in regions i and j. Cerebellar structures are removed, giving a symmetric 90 × 90 connectivity matrix for each of 14 young healthy subjects. A combined connectivity matrix C is then obtained by averaging across healthy subjects. Prior to averaging, the individual network edges are made robust by applying a threshold obtained from hypothesis testing at significance level p = 0.001, following Raj and Chen (2011).
Validation of Persistent Modes
To validate our hypothesis that persistent modes are homologous to known patterns of atrophy in several degenerative diseases, we compared the persistent modes with atrophy from our AD/bvFTD/normal aging cohort as follows: Persistent modes were computed using the average young-healthy-brain connectivity network. Normalized atrophy was given by the t-statistic between the diseased group and the healthy group, i.e.,
and formed the corresponding atrophy vector tAD = {tAD (i)|i ∈ [1,N]}, and similarly tFTD and taging. To these data we add a vector tvol of ROI volumes obtained from the mean of young healthy subjects, because we wish to determine whether the first eigenmode corresponds to ROI volume. These statistical atrophy maps were visually compared with the persistent modes and plotted in a wire-and-ball brain map (Figures 2 and 3), where the wires denote (healthy) network connections and the balls represent gray-matter ROIs. Cortical atrophy and eigenmode values were mapped onto the cortical surface of the 90-region cerebral atlas (Figure 4). The same study was repeated using Free-Surfer volumetrics (Fischl et al., 2002) and a different 86-region FreeSurfer atlas. Healthy-brain connectivity networks were recomputed using this new atlas for the purpose of seeding tracts. In order to perform statistically rigorous hypothesis testing, we adopted a simple correlation approach. The t-statistic of atrophy within each disease group and for all cortical ROIs was correlated with the absolute values of all hypothesized eigenmodes, and the R2 and p values of Pearson correlation coefficients were calculated. The statistical atrophy of each disease was plotted against each persistent mode.
Prediction of Population-wide Prevalence of Diseases
The prevalence rates of various dementias were collected from literature survey. Unfortunately, prevalence estimates vary wildly among sources, age groups, and ethnicity, especially at low prevalence rates in younger populations. We grouped studies into decadal age ranges from 50 to 90+ and restricted ourselves to studies in advanced (OECD) nations. For each age range, we computed prevalence rate as a percentage of each dementia over prevalence of ALL dementias. These data were taken from the following studies: (Harvey 2003; Ratnavalli et al., 2002; Kobayashi et al., 2009; Jellinger and Attems, 2010; Kukull et al., 2002; Morrison, 2010; Di Carlo et al., 2002; Plassman et al., 2007). To this published data we compared the theoretical prevalence that would be predicted by our model, as described in the subsection titled Development of a Network Diffusion Model. Since the model has two parameters (age of onset and diffusivity constant β) whose true values cannot be uniquely determined from the literature, we estimated them by fitting the model to published data using a simple minimization routine.
Diagnostic Power of Persistent Modes
Finally we wish to determine whether the most persistent eigenmodes have utility for the purpose of diagnosing and classifying various dementias. Atrophy of each subject in the aged groups was normalized using the young healthy subjects, giving a z-score, zk, for the kth subject. We computed the dot product between zk and the nth eigenmode, giving . In order to remove the effect of different overall extent of atrophy in different dementias, this figure was normalized to d̄(k, n) such that Σnd̄(k, n) = 1. The latter values were fed into a three-way (normal aging, AD, bvFTD) linear discriminate analysis (LDA) classifier. ROC curves were obtained after repeated leave-one-out analysis whereby each subject was classified based on training over all the other subjects. For comparison, we also implemented a conventional classifier based directly on atrophy z-scores, zk, after dimensionality reduction using PCA.
Supplementary Material
Acknowledgments
This research was supported in part by the following grants from the National Institutes of Health: R01 NS075425, F32 EB012404-01, P41 RR023953-02, P41 RR023953-02S1, and R21 EB008138-02.
Footnotes
Supplemental Information includes five figures and Supplemental Experimental Procedures and can be found with this article online at doi:10.1016/j. neuron.2011.12.040.
Author Contributions: A.R. conceptualized this study and developed the mathematical model, performed all correlations and statistical tests, and wrote the manuscript. He is responsible for the classification results as well as the disease prevalence results and the corresponding model predictions. A.K. performed volumetric analysis of AD/bvFTD/aged patients and extracted the healthy-brain structural network. She also helped fine-tune the manuscript. M.W. provided guidance, clinical input, and interpretation, MRI data for volumetric analysis, and improvement of the manuscript. A.R. would like to thank Dr. Norman Relkin for valuable advice.
References
- Acosta-Cabronero Julio, Williams Guy B, Pengas George, Nestor Peter J. Absolute diffusivities define the landscape of white matter degeneration in Alzheimer’s disease. Brain. 2010;133:529–539. doi: 10.1093/brain/awp257. [DOI] [PubMed] [Google Scholar]
- Alemán-Gómez Y, Melie-García L, Valdés-Hernandez P. IBASPM: toolbox for automatic parcellation of brain structures. Presented at the 12th Annual Meeting of the Organization for Human Brain Mapping; Florence, Italy. 2005. [Google Scholar]
- Almond DP, Budd CJ, McCullen NJ. Emergent behaviour in large electrical networks. In: Georgoulis E, Iske A, Levesley J, editors. Approximation Algorithms for Complex Systems. New York: Springer; 2011. pp. 3–26. [Google Scholar]
- Apostolova LG, Steiner CA, Akopyan GG, Dutton RA, Hayashi KM, Toga AW, Cummings JL, Thompson PM. Three-dimensional gray matter atrophy mapping in mild cognitive impairment and mild Alzheimer disease. Arch Neurol. 2007;64:1489–1495. doi: 10.1001/archneur.64.10.1489. [DOI] [PMC free article] [PubMed] [Google Scholar]
- Barreda JL, Zhou HX. A solvable model for the diffusion and reaction of neurotransmitters in a synaptic junction. BMC Biophys. 2011;4:5. doi: 10.1186/2046-1682-4-5. [DOI] [PMC free article] [PubMed] [Google Scholar]
- Bartzokis G. Age-related myelin breakdown: a developmental model of cognitive decline and Alzheimer’s disease. Neurobiol Aging. 2004;25:5–18. doi: 10.1016/j.neurobiolaging.2003.03.001. author reply 49–62. [DOI] [PubMed] [Google Scholar]
- Behrens TEJ, Berg HJ, Jbabdi S, Rushworth MFS, Woolrich MW. Probabilistic diffusion tractography with multiple fibre orientations: What can we gain? Neuroimage. 2007;34:144–155. doi: 10.1016/j.neuroimage.2006.09.018. [DOI] [PMC free article] [PubMed] [Google Scholar]
- Bhalla US. Understanding complex signaling networks through models and metaphors. Prog Biophys Mol Biol. 2002;81:45–65. doi: 10.1016/s0079-6107(02)00046-9. [DOI] [PubMed] [Google Scholar]
- Boxer AL, Miller BL. Clinical features of frontotemporal dementia. Alzheimer Dis Assoc Disord. 2005;19(Suppl 1):S3–S6. doi: 10.1097/01.wad.0000183086.99691.91. [DOI] [PubMed] [Google Scholar]
- Boxer AL, Geschwind MD, Belfor N, Gorno-Tempini ML, Schauer GF, Miller BL, Weiner MW, Rosen HJ. Patterns of brain atrophy that differentiate corticobasal degeneration syndrome from progressive supranuclear palsy. Arch Neurol. 2006;63:81–86. doi: 10.1001/archneur.63.1.81. [DOI] [PubMed] [Google Scholar]
- Braak H, Del Tredici K, Schultz C, Braak E. Vulnerability of select neuronal types to Alzheimer’s disease. Ann N Y Acad Sci. 2000;924:53–61. doi: 10.1111/j.1749-6632.2000.tb05560.x. [DOI] [PubMed] [Google Scholar]
- Broe M, Hodges JR, Schofield E, Shepherd CE, Kril JJ, Halliday GM. Staging disease severity in pathologically confirmed cases of frontotemporal dementia. Neurology. 2003;60:1005–1011. doi: 10.1212/01.wnl.0000052685.09194.39. [DOI] [PubMed] [Google Scholar]
- Buckner RL, et al. Molecular, structural, and functional characterization of Alzheimer’s disease: evidence for a relationship between default activity, amyloid, and memory. J Neurosci. 2005;25:7709–7717. doi: 10.1523/JNEUROSCI.2177-05.2005. [DOI] [PMC free article] [PubMed] [Google Scholar]
- Carlo AD, et al. Incidence of dementia, Alzheimer’s disease, and vascular dementia in Italy. The ILSA Study. J Am Geriatr Soc. 2002;50:41–48. doi: 10.1046/j.1532-5415.2002.50006.x. [DOI] [PubMed] [Google Scholar]
- Curtis CE, D’Esposito M. Persistent activity in the prefrontal cortex during working memory. Trends Cogn Sci. 2003;7:415–423. doi: 10.1016/s1364-6613(03)00197-9. [DOI] [PubMed] [Google Scholar]
- Du AT, Schuff N, Kramer JH, Rosen HJ, Gorno-Tempini ML, Rankin K, Miller BL, Weiner MW. Different regional patterns of cortical thinning in Alzheimer’s disease and frontotemporal dementia. Brain. 2007;130:1159–1166. doi: 10.1093/brain/awm016. [DOI] [PMC free article] [PubMed] [Google Scholar]
- Englund E, Brun A, Alling C. White matter changes in dementia of Alzheimer’s type. Biochemical and neuropathological correlates. Brain. 1988;111:1425–1439. doi: 10.1093/brain/111.6.1425. [DOI] [PubMed] [Google Scholar]
- Fischl B, et al. Whole brain segmentation: automated labeling of neuroanatomical structures in the human brain. Neuron. 2002;33:341–355. doi: 10.1016/s0896-6273(02)00569-x. [DOI] [PubMed] [Google Scholar]
- Forman MS, et al. Frontotemporal dementia: clinicopathological correlations. Ann Neurol. 2006;59:952–962. doi: 10.1002/ana.20873. [DOI] [PMC free article] [PubMed] [Google Scholar]
- Frost B, Diamond MI. Prion-like mechanisms in neurodegenerative diseases. Nat Rev Neurosci. 2010;11:155–159. doi: 10.1038/nrn2786. [DOI] [PMC free article] [PubMed] [Google Scholar]
- Frost B, Jacks RL, Diamond MI. Propagation of tau misfolding from the outside to the inside of a cell. J Biol Chem. 2009a;284:12845–12852. doi: 10.1074/jbc.M808759200. [DOI] [PMC free article] [PubMed] [Google Scholar]
- Frost B, Ollesch J, Wille H, Diamond MI. Conformational diversity of wild-type Tau fibrils specified by templated conformation change. J Biol Chem. 2009b;284:3546–3551. doi: 10.1074/jbc.M805627200. [DOI] [PMC free article] [PubMed] [Google Scholar]
- Goldberg II, Harel M, Malach R. When the brain loses its self: prefrontal inactivation during sensorimotor processing. Neuron. 2006;50:329–339. doi: 10.1016/j.neuron.2006.03.015. [DOI] [PubMed] [Google Scholar]
- Gorno-Tempini ML, Dronkers NF, Rankin KP, Ogar JM, Phengrasamy L, Rosen HJ, Johnson JK, Weiner MW, Miller BL. Cognition and anatomy in three variants of primary progressive aphasia. Ann Neurol. 2004;55:335–346. doi: 10.1002/ana.10825. [DOI] [PMC free article] [PubMed] [Google Scholar]
- Hardy J. Expression of normal sequence pathogenic proteins for neurodegenerative disease contributes to disease risk: “permissive templating” as a general mechanism underlying neurodegeneration. Biochem Soc Trans. 2005;33:578–581. doi: 10.1042/BST0330578. [DOI] [PubMed] [Google Scholar]
- Harvey RJ. The prevalence and causes of dementia in people under the age of 65 years. J Neurol Neurosurg Psychiatry. 2003;74:1206–1209. doi: 10.1136/jnnp.74.9.1206. [DOI] [PMC free article] [PubMed] [Google Scholar]
- He Y, Chen Z, Evans A. Structural insights into aberrant topological patterns of large-scale cortical networks in Alzheimer’s disease. J Neurosci. 2008;28:4756–4766. doi: 10.1523/JNEUROSCI.0141-08.2008. [DOI] [PMC free article] [PubMed] [Google Scholar]
- Hess CP, Mukherjee P, Han ET, Xu D, Vigneron DB. Q-ball reconstruction of multimodal fiber orientations using the spherical harmonic basis. Magn Res Med. 2006;56:104–117. doi: 10.1002/mrm.20931. [DOI] [PubMed] [Google Scholar]
- Iturria-Medina Y, Canales-Rodriguez EJ, Aleman-Gomez Y, Sotero RC, Melie-Garcia L. Studying the human brain anatomical network via diffusion-weighted MRI and graph theory. Neuroimage. 2008;40:1064–1076. doi: 10.1016/j.neuroimage.2007.10.060. [DOI] [PubMed] [Google Scholar]
- Jellinger KA, Attems J. Prevalence of dementia disorders in the oldest-old: an autopsy study. Acta Neuropathol. 2010;119:421–433. doi: 10.1007/s00401-010-0654-5. [DOI] [PubMed] [Google Scholar]
- Klauschen F, Goldman A, Barra V, Meyer-Lindenberg A, Lundervold A. Evaluation of automated brain MR image segmentation and volume-try methods. Hum Brain Mapp. 2009;30:1310–1327. doi: 10.1002/hbm.20599. [DOI] [PMC free article] [PubMed] [Google Scholar]
- Kobayashi M, Sato T, Sato A, Imamura T. Oldest-old dementia in a Japanese memory clinic. Brain and Nerve. 2009;61:972–978. [PubMed] [Google Scholar]
- Kondor RI, Lafferty J. Diffusion kernels on graphs and other discrete structures. Proc. 19th Intl. Conf. on Machine Learning; 2002. pp. 315–322. [Google Scholar]
- Kuczynski B, Targan E, Madison C, Weiner M, Zhang Yu, Reed B, Chui HC, Jagust W. White matter integrity and cortical metabolic associations in aging and dementia. Alzheimers Dement. 2010;6:54–62. doi: 10.1016/j.jalz.2009.04.1228. [DOI] [PMC free article] [PubMed] [Google Scholar]
- Kukull WA, Higdon R, Bowen JD, McCormick WC, Teri L, Schellenberg GD, van Belle G, Jolley L, Larson EB. Dementia and Alzheimer disease incidence: a prospective cohort study. Arch Neurol. 2002;59:1737–1746. doi: 10.1001/archneur.59.11.1737. [DOI] [PubMed] [Google Scholar]
- Lo CY, Wang PN, Chou KH, Wang J, He Y, Lin CP. Diffusion tensor tractography reveals abnormal topological organization in structural cortical networks in Alzheimer’s disease. J Neurosci. 2010;30:16876–16885. doi: 10.1523/JNEUROSCI.4136-10.2010. [DOI] [PMC free article] [PubMed] [Google Scholar]
- Lomasko T, Lumsden CJ. One-hit stochastic decline in a mechanochemical model of cytoskeleton-induced neuron death III: diffusion pulse death zones. J Theor Biol. 2009;256:104–116. doi: 10.1016/j.jtbi.2008.08.025. [DOI] [PubMed] [Google Scholar]
- Martinez S, Cortes J, Bullo F. Motion coordination with distributed information. IEEE Contr Syst. 2007;27:75–88. [Google Scholar]
- McKhann G, Drachman D, Folstein M, Katzman R, Price D, Stadlan EM. Clinical diagnosis of Alzheimer’s disease: report of the NINCDS-ADRDA Work Group under the auspices of Department of Health and Human Services Task Force on Alzheimer’s Disease. Neurology. 1984;34:939–944. doi: 10.1212/wnl.34.7.939. [DOI] [PubMed] [Google Scholar]
- Morrison PJ. Accurate prevalence and uptake of testing for Huntington’s disease. Lancet Neurol. 2010;9:1147. doi: 10.1016/S1474-4422(10)70287-8. [DOI] [PubMed] [Google Scholar]
- Neary D, Snowden J. Frontotemporal dementia: nosology, neuropsychology, and neuropathology. Brain Cogn. 1996;31:176–187. doi: 10.1006/brcg.1996.0041. [DOI] [PubMed] [Google Scholar]
- Neary D, Snowden JS, Gustafson L, Passant U, Stuss D, Black S, Freedman M, Kertesz A, Robert PH, Albert M, et al. Frontotemporal lobar degeneration: a consensus on clinical diagnostic criteria. Neurology. 1998;51:1546–1554. doi: 10.1212/wnl.51.6.1546. [DOI] [PubMed] [Google Scholar]
- Palop JJ, Mucke L. Amyloid-β-induced neuronal dysfunction in Alzheimer’s disease: from synapses toward neural networks. Nat Neurosci. 2010;13:812–818. doi: 10.1038/nn.2583. [DOI] [PMC free article] [PubMed] [Google Scholar]
- Palop JJ, Chin J, Mucke L. A network dysfunction perspective on neurodegenerative diseases. Nature. 2006;443:768–773. doi: 10.1038/nature05289. [DOI] [PubMed] [Google Scholar]
- Pereira JMS, Williams GB, Acosta-Cabronero J, Pengas G, Spillantini MG, Xuereb JH, Hodges JR, Nestor PJ. Atrophy patterns in histologic vs clinical groupings of frontotemporal lobar degeneration. Neurology. 2009;72:1653–1660. doi: 10.1212/WNL.0b013e3181a55fa2. [DOI] [PMC free article] [PubMed] [Google Scholar]
- Plassman BL, Langa KM, Fisher GG, Heeringa SG, Weir DR, Ofstedal MB, Burke JR, Hurd MD, Potter GG, Rodgers WL, et al. Prevalence of dementia in the United States: the aging, demographics, and memory study. Neuroepidemiology. 2007;29:125–132. doi: 10.1159/000109998. [DOI] [PMC free article] [PubMed] [Google Scholar]
- Rabinovici GD, Jagust WJ. Amyloid imaging in aging and dementia: testing the amyloid hypothesis in vivo. Behav Neurol. 2009;21:117–128. doi: 10.3233/BEN-2009-0232. [DOI] [PMC free article] [PubMed] [Google Scholar]
- Rabinovici GD, Furst AJ, Alkalay A, Racine CA, O’Neil PJ, Janabi M, Baker SL, Agarwal N, Bonasera SJ, Mormino EC, et al. Increased metabolic vulnerability in early-onset Alzheimer’s disease is not related to amyloid burden. Brain. 2010;133:512–528. doi: 10.1093/brain/awp326. [DOI] [PMC free article] [PubMed] [Google Scholar]
- Raj A, Chen Y. The wiring economy principle: connectivity determines anatomy in the human brain. PLoS ONE. 2011;6:e14832. doi: 10.1371/journal.pone.0014832. [DOI] [PMC free article] [PubMed] [Google Scholar]
- Ratnavalli E, Brayne C, Dawson K, Hodges JR. The prevalence of frontotemporal dementia. Neurology. 2002;58:1615–1621. doi: 10.1212/wnl.58.11.1615. [DOI] [PubMed] [Google Scholar]
- Rosas HD, Salat DH, Lee SY, Zaleta AK, Pappu V, Fischl B, Greve D, Hevelone N, Hersch SM. Cerebral cortex and the clinical expression of Huntington’s disease: complexity and heterogeneity. Brain. 2008;131:1057–1068. doi: 10.1093/brain/awn025. [DOI] [PMC free article] [PubMed] [Google Scholar]
- Santos SF, Pierrot N, Octave JN. Network excitability dysfunction in Alzheimer’s disease: insights from in vitro and in vivo models. Rev Neurosci. 2010;21:153–171. doi: 10.1515/revneuro.2010.21.3.153. [DOI] [PubMed] [Google Scholar]
- Saxena S, Caroni P. Selective neuronal vulnerability in neurodegenerative diseases: from stressor thresholds to degeneration. Neuron. 2011;71:35–48. doi: 10.1016/j.neuron.2011.06.031. [DOI] [PubMed] [Google Scholar]
- Seeley WW, Crawford R, Rascovsky K, Kramer JH, Weiner M, Miller BL, Gorno-Tempini ML. Frontal paralimbic network atrophy in very mild behavioral variant frontotemporal dementia. Arch Neurol. 2008;65:249–255. doi: 10.1001/archneurol.2007.38. [DOI] [PMC free article] [PubMed] [Google Scholar]
- Seeley WW, Crawford RK, Zhou J, Miller BL, Greicius MD. Neurodegenerative diseases target large-scale human brain networks. Neuron. 2009;62:42–52. doi: 10.1016/j.neuron.2009.03.024. [DOI] [PMC free article] [PubMed] [Google Scholar]
- Shalizi C. PhD thesis. University of Wisconsin; Madison, WI: 2001. Causal architecture, complexity and self-organization in time series and cellular automata. ( http://www.cscs.umich.edu/crshalizi/thesis/) [Google Scholar]
- Smith SM, et al. Advances in functional and structural MR image analysis and implementation as FSL. Neuroimage. 2004;23(Suppl 1):S208–S219. doi: 10.1016/j.neuroimage.2004.07.051. [DOI] [PubMed] [Google Scholar]
- Thompson PM, et al. Dynamics of gray matter loss in Alzheimer’s disease. J Neurosci. 2003;23:994–1005. doi: 10.1523/JNEUROSCI.23-03-00994.2003. [DOI] [PMC free article] [PubMed] [Google Scholar]
- Villain N, Desgranges B, Viader F, Sayette V, de la Mézenge F, Landeau B, Baron J-C, Eustache F, Chételat G. Relationships between hippocampal atrophy, white matter disruption, and gray matter hypometabolism in Alzheimer’s disease. J Neurosci. 2008;28:6174–6181. doi: 10.1523/JNEUROSCI.1392-08.2008. [DOI] [PMC free article] [PubMed] [Google Scholar]
- Whitwell JL, Josephs KA, Rossor MN, Stevens JM, Revesz T, Holton JL, Al-Sarraj S, Godbolt AK, Fox NC, Warren JD. Magnetic resonance imaging signatures of tissue pathology in frontotemporal dementia. Arch Neurol. 2005;62:1402–1408. doi: 10.1001/archneur.62.9.1402. [DOI] [PubMed] [Google Scholar]
- Whitwell JL, Jack CR, Senjem ML, Parisi JE, Boeve BF, Knopman DS, Dickson DW, Petersen RC, Josephs KA. MRI correlates of protein deposition and disease severity in postmortem frontotemporal lobar degeneration. Neurodegener Dis. 2009;6:106–117. doi: 10.1159/000209507. [DOI] [PMC free article] [PubMed] [Google Scholar]
- Wu M, Rosano C, Lopez-Garcia P, Carter CS, Aizenstein HJ. Optimum template selection for atlas-based segmentation. Neuroimage. 2007;34:1612–1618. doi: 10.1016/j.neuroimage.2006.07.050. [DOI] [PubMed] [Google Scholar]
- Zhou J, et al. Divergent network connectivity changes in behavioural variant frontotemporal dementia and Alzheimer’s disease. Brain. 2010;133:1352–1367. doi: 10.1093/brain/awq075. [DOI] [PMC free article] [PubMed] [Google Scholar]
Associated Data
This section collects any data citations, data availability statements, or supplementary materials included in this article.