

Abstract
In a previous phase 3 study, the cure rates that occurred in patients with hospital-acquired pneumonia treated with tigecycline at the approved dose were lower than those seen with patients treated with imipenem and cilastatin (imipenem/cilastatin). We hypothesized that a higher dose of tigecycline is necessary in patients with hospital-acquired pneumonia. This phase 2 study compared the safety and efficacy of two higher doses of tigecycline with imipenem/cilastatin in subjects with hospital-acquired pneumonia. Subjects with hospital-acquired pneumonia were randomized to receive one of two doses of tigecycline (150 mg followed by 75 mg every 12 h or 200 mg followed by 100 mg every 12 h) or 1 g of imipenem/cilastatin every 8 h. Empirical adjunctive therapy was administered for initial coverage of methicillin-resistant Staphylococcus aureus and Pseudomonas aeruginosa infection, depending on the randomization regimen. Clinical response, defined as cure, failure of treatment, or indeterminate outcome, was assessed 10 to 21 days after the last day of therapy. In the clinically evaluable population, clinical cure with tigecycline 100 mg (17/20, 85.0%) was numerically higher than with tigecycline 75 mg (16/23, 69.6%) and imipenem/cilastatin (18/24, 75.0%). No new safety signals with the high-dose tigecycline were identified. A numerically higher clinical response was observed with the 100-mg dose of tigecycline. This supports our hypothesis that a higher area under the concentration-time curve over 24 h in the steady state divided by the MIC (AUC/MIC ratio) may be necessary to achieve clinical cure in patients with hospital-acquired pneumonia. Further studies are necessary. (The ClinicalTrials.gov identifier for this clinical trial is NCT00707239.)
INTRODUCTION
Hospital-acquired pneumonia (HAP) remains an important problem in the care of critically ill patients and has significant clinical and economic consequences, including a 30% to 70% mortality rate (1–4). Mortality among patients with HAP associated with mechanical ventilation is approximately twice that of patients with HAP not associated with mechanical ventilation (5). The initial management of patients with HAP includes obtaining appropriate respiratory samples for culture and sensitivity and initiating therapy with broad-spectrum antibiotics that are active against likely pathogens (6).
Tigecycline has a broad spectrum of antibacterial activity (7), including activity against many multidrug-resistant organisms and efficacy in treatment of community-acquired pneumonia (8–10). A single-dose study that collected lung tissue from uninfected subjects undergoing elective surgery showed a ratio of lung area under the concentration time-curve (AUC) to serum AUC, which is also known as lung penetration, of 2.0 (11). Results from a multiple-dose study with tigecycline that measured serum, pulmonary epithelial lining fluid (ELF), and alveolar cell concentrations in healthy volunteers demonstrated ELF penetration of 1.32 (12). These results, together with the observation by Crandon et al. (13) that, in the presence of Acinetobacter baumannii lung infection in neutropenic ICR mice, ELF penetration increased 2- to 3-fold compared with the penetration seen with uninfected mice, suggested that tigecycline might be valuable in the treatment of patients with HAP.
In a phase 3 study, the levels of safety and efficacy of administration of intravenous (i.v.) tigecycline at the dose used in the approved amounts (100 mg initially followed by 50 mg every 12 h) were compared with those seen with imipenem and cilastatin (imipenem/cilastatin) for the treatment of HAP (14). Tigecycline did not achieve the preestablished efficacy endpoints in the study. In the clinically evaluable (CE) population, the cure rates that occurred in patients with ventilator-associated pneumonia (VAP) treated with tigecycline were lower than those in patients treated with imipenem/cilastatin (47.9% versus 70.1%, respectively). In patients without VAP, tigecycline cure rates were similar to those of imipenem/cilastatin for both the CE and the clinical modified intention to treat (c-mITT) populations.
Pharmacokinetic (PK) and pharmacodynamic (PD) analyses from the prior study showed that the mean AUC observed in patients with VAP was 15% lower than the AUC observed in patients without VAP and also showed a 60% lower unbound area under the concentration-time curve over 24 h in the steady state divided by the MIC (AUC/MIC ratio) (fAUC0–24/MIC), assuming an unbound fraction of 20% (14). However, the median fAUC0–24/MIC ratios, 1.73 and 4.39 for subjects with VAP and with HAP, respectively, in this trial were lower than those observed in other tigecycline trials (14). The median AUC0–24/MIC ratios in patients being treated for complicated intra-abdominal infections and complicated skin and skin structure infections were 15.6 (15) and 29.0 (24), respectively, which would correspond to fAUC0–24/MIC ratios of 3.1 and 5.8, respectively, assuming an unbound fraction of 20%.
Based on these data, it was hypothesized that a higher dose of tigecycline is necessary in patients with HAP or VAP. To test this hypothesis, a phase 2 study was conducted to compare two higher doses of tigecycline with imipenem/cilastatin in patients with HAP. Here we present the results of this phase 2 study.
MATERIALS AND METHODS
This was a global, phase 2, multicenter, randomized, double-blind study comparing tigecycline to imipenem/cilastatin for safety and efficacy in the treatment of HAP and included 75 sites in Europe, Asia, Latin America, the United States, Canada, and Australia (http://clinicaltrials.gov/). Subjects were randomized in a 1:1:1 ratio to receive dosing for up to 14 consecutive days; the exact duration of treatment was at the discretion of the investigator. Patients were stratified at randomization by VAP status with a plan to enroll at least 70% of subjects with VAP in each treatment group.
Adult subjects with HAP or VAP meeting inclusion and exclusion criteria, based on the previous phase 3 trial (14) and FDA guidance for the development of antimicrobial drugs for nosocomial pneumonia (16), were eligible for study participation; those with known Pseudomonas aeruginosa infection were excluded. HAP was defined as pneumonia with the onset of symptoms 48 h or more after admission to an acute care hospital or chronic care facility or 7 days or less after discharge from the hospital (initial hospitalization must have been 3 days or more). VAP was defined as the onset of pneumonia 48 h or more after endotracheal intubation.
Two doses of i.v. tigecycline were studied in parallel (150 mg followed by 75 mg every 12 h and 200 mg followed by 100 mg every 12 h). Imipenem/cilastatin was dosed at 1 g i.v. every 8 h. Patients randomized to tigecycline also received adjunctive i.v. therapy (ceftazidime 2 g every 8 h and tobramycin 7 mg/kg of body weight daily or amikacin 20 mg/kg daily and vancomycin placebo) at the start of therapy unless there was no concern regarding P. aeruginosa or methicillin-resistant Staphylococcus aureus infection. Adjunctive i.v. therapy was given to patients randomized to receive imipenem/cilastatin (vancomycin 15 mg/kg and tobramycin or amikacin dosed as described above, plus ceftazidime placebo). Adjunctive therapies were discontinued based on available cultures; subjects with P. aeruginosa isolated from the baseline culture were withdrawn from the study. The unblinded dispenser (pharmacy or nursing staff) covered infusion bags and tubing to maintain blinding. Subjects were followed for treatment efficacy until test of cure (TOC) assessment, 10 to 21 days after the last day of therapy.
The study was performed in compliance with the Declaration of Helsinki and the International Conference on Harmonization Good Clinical Practice guidelines. Institutional review board-approved informed consent was received from all subjects before the initiation of the study.
Efficacy, safety, and PK/PD evaluations.
The primary efficacy outcome was clinical response in the CE population at TOC assessment. Secondary outcomes were clinical response in the c-mITT population at TOC assessment, clinical response in the VAP/non-VAP subject populations, and microbiologic responses at the subject and pathogen levels. Safety data and PK/PD data also were evaluated.
(i) Clinical efficacy.
Clinical response was categorized as cure, failure of treatment, or indeterminate outcome; cure and failure were the only categories used to describe the CE population. Cure was defined as all signs and symptoms of pneumonia present at the time of enrollment having improved or resolved at TOC, chest radiographs improved or not worsening, no further antibiotic therapy necessary, and no worsening or appearance of new signs and symptoms of pneumonia. Failure was defined as a lack of response during treatment requiring additional intervention, initial recovery from the infection followed by deterioration before the assessment, or death after study day 2 related to the pneumonia. Outcomes were defined as indeterminate for subjects who did not have an outcome determination for reasons unrelated to study drug or infection (e.g., lost to follow-up, withdrawal of consent, withdrawal from study owing to infection caused by P. aeruginosa), died within 2 days after the first dose of study drug for any reason, or died after 2 days but before the TOC assessment because of an infection other than pneumonia or for noninfection reasons.
CE subjects met inclusion and exclusion criteria at randomization, did not receive any potentially effective concomitant systemic or aerosolized antibacterial treatment other than the study medication, received less than 24 h of antibiotic therapy for the infection before enrollment, and had an evaluable TOC assessment 10 to 21 days after the last day of therapy. Microbiologically evaluable patients satisfied all criteria for the CE population and had a pulmonary culture at baseline with at least one isolate susceptible to the study regimens.
(ii) Safety.
All subjects who received at least one dose of study drug were included in the safety population. Adverse events (AEs) were recorded through the TOC assessment or 15 days after the last day of therapy; the collection of serious adverse events was extended to 30 days following a protocol amendment.
(iii) PK/PD methods.
Tigecycline serum concentrations were collected at baseline, on day 3 just before and immediately after the infusion, and then at 2, 4, and 8 h after the start of the infusion and were analyzed separately by liquid chromatography with tandem mass spectrometry. All concentration-time data were combined and analyzed using population PK methods (17); data were analyzed for important covariates, including VAP diagnosis. Model-predicted AUC for each individual was determined. Efficacy analysis using AUC included the calculation of individual AUC/MIC ratios, summary of AUC/MIC ratios by clinical and microbiologic response, and logistic regression to assess contribution of AUC/MIC ratios to probability of clinical and microbiologic response. Safety analysis using AUC was performed to evaluate the incidence of nausea and vomiting; logistic regression analysis was performed to assess the contribution of AUC to the probability of nausea and vomiting. Calculations were made using total concentrations, and no adjustments were made for unbound fractions.
Statistical analysis.
Noninferiority of each tigecycline dose group compared with imipenem/cilastatin was evaluated for clinical response by using a two-sided 70% confidence interval (CI) for the true difference in efficacy; a 70% CI was deemed sufficient to determine the dose that would be evaluated further in potential phase 3 trials in patients with HAP. Noninferiority required a lower limit of the two-sided 70% CI (or a one-sided 85% CI) of −20% or more. Statistical testing was done at 15% alpha. A supportive analysis of differences between independent proportions adjusted for stratification was performed. The noninferiority of tigecycline compared with imipenem/cilastatin was evaluated as described previously and adjusted for stratification variable (VAP versus non-VAP).
Assuming an evaluability rate of at least 50%, enrollment of approximately 210 subjects (70 per group) was planned to obtain 105 CE subjects (35 per group) to ensure that the lower bound of a two-sided 70% CI for the cure rate difference between the tigecycline dose and imipenem/cilastatin did not exceed −20%. Owing to the small sample size at the time of study termination, no formal statistical analysis was conducted. The clinical responses (rate of cure) for the difference were presented with 70% CIs.
RESULTS
Study population.
The study was conducted between December 2008 and June 2011 and was terminated early owing to difficulties in the enrollment of subjects with VAP. At the time of study termination, 108 of the planned 210 subjects were randomized and a total of 105 subjects received study medication and constituted the safety population. Since no subjects were excluded, the safety and c-mITT populations are the same. Approximately 64% of subjects were clinically evaluable (Fig. 1). The most common causes for nonevaluability were no assessment at the TOC visit, TOC outside the specified window, and P. aeruginosa present in a baseline culture. Demographics are shown in Table 1. Significant baseline differences in sex, ethnicity, and prior antibiotic failure were identified. However, subgroup analysis did not reveal treatment interactions or an effect on clinical response (data not shown). Differences likely occurred owing to the small study sample size. The majority of subjects had HAP or VAP of late onset (5 days or more after hospitalization or mechanical ventilation). The mean Acute Physiology and Chronic Health Evaluation II (APACHE) score was 13.8; scores did not differ among treatment groups (P = 0.835). Treatment durations were similar in all treatment groups (P = 0.245). No differences in the numbers of doses or durations of adjunctive therapy were observed; more subjects received adjunctive ceftazidime or vancomycin than received adjunctive aminoglycoside (Table 1).
Fig 1.

Study analysis populations and subject distribution. n values by dosage are shown in parentheses. *, individual subjects may have met two or more exclusion criteria. IMI/CIL, imipenem/cilastatin; ITT, intention to treat; mITT, modified intention to treat; TGC, tigecycline.
Table 1.
Demographics (safety population)a
| Parameter | Value for indicated antibiotic(s) |
P value or one-way ANOVA value | ||
|---|---|---|---|---|
| Tigecycline (75 mg) | Tigecycline (100 mg) | Imipenem/cilastatin | ||
| Subjects, n | 36 | 35 | 34 | |
| Age (yr), mean ± SD | 60.3 ± 14.8 | 61.5 ± 16.1 | 64.9 ± 15.3 | 0.445b |
| Male, n (%) | 23 (63.9) | 19 (54.3) | 29 (85.3) | 0.019c |
| Race, n (%) | 0.037c | |||
| White | 20 (55.6) | 25 (71.4) | 17 (50.0) | |
| Black | 2 (5.6) | 0 | 0 | |
| Asian | 7 (19.4) | 7 (20.0) | 15 (44.1) | |
| Other | 7 (19.4) | 3 (8.6) | 2 (5.9) | |
| Wt (kg), mean ± SD | 71.8 ± 16.2 | 70.6 ± 20.3 | 73.7 ± 17.0 | 0.770b |
| Diagnosis, n (%) | 0.501c | |||
| Non-VAP | 23 (63.9) | 23 (65.7) | 18 (52.9) | |
| VAP | 13 (36.1) | 12 (34.3) | 16 (47.1) | |
| APACHE II score, n (%) | ||||
| ≤15 | 24 (66.7) | 26 (74.3) | 23 (67.7) | 0.752c |
| >15 | 12 (33.3) | 9 (25.7) | 11 (32.4) | |
| Mean CPIS score (minimum, maximum) | 6.2 (3.0, 9.0) | 5.3 (2.0, 9.0) | 6.1 (2.0, 10.0) | 0.077b |
| Prior antibiotic failure, n (%) | 4 (11.1) | 12 (34.3) | 5 (14.7) | 0.033c |
| Late onset of HAP ≥ 5 days after admission, n (%) | 31 (86.1) | 28 (80.0) | 25 (73.5) | 0.421c |
| Mean duration of therapy, days | 7.5 | 8.9 | 8.6 | 0.245b |
| Mean duration of adjunctive ceftazidime/vancomycin therapy, days (n receiving) | 4.8 (22) | 5.7 (19) | 6.1 (22) | 0.430b |
| Mean duration of adjunctive aminoglycoside, days (n receiving) | 4.7 (17) | 3.9 (16) | 3.0 (10) | 0.222b |
ANOVA, analysis of variance; APACHE, Acute Physiology and Chronic Health Evaluation; CPIS, clinical pulmonary infection score; HAP, hospital-acquired pneumonia; VAP, ventilator-associated pneumonia.
One-way analysis of variance value with treatment as a factor.
P value for chi-square test.
Study outcomes.
Clinical response in the CE population (primary outcome) and the c-mITT and microbiologically evaluable populations (secondary outcomes) is shown in Table 2. The clinical response at TOC was numerically higher with the tigecycline 100 mg regimen (17/20, 85.0%) than with the tigecycline 75 mg regimen (16/23, 69.6%) and the imipenem/cilastatin regimen (18/24, 75.0%).
Table 2.
Clinical response at test of cure in the clinically evaluable (primary-outcome), clinical modified intention to treat (secondary-outcome), and microbiologically evaluable (secondary-outcome) populationsa
| Parameter | Tigecycline (75 mg) | Tigecycline (100 mg) | Imipenem/cilastatin |
|---|---|---|---|
| CE population | |||
| Subjects, n | 23 | 20 | 24 |
| Cure, n (%) | 16 (69.6) | 17 (85.0) | 18 (75.0) |
| Differenceb (70% CI) | −5.4 (−21.6, 10.9) | 10.0 (−6.1, 24.8) | N/A |
| c-mITT population | |||
| Subjects, n | 36 | 35 | 34 |
| Cure, n (%) | 19 (52.8) | 25 (71.4) | 18 (52.9) |
| Differenceb (70% CI) | −0.2 (−14.3, 14.0) | 18.5 (4.3, 31.8) | N/A |
| ME population | |||
| Subjects, n | 13 | 10 | 15 |
| Cure, n (%) | 9 (69.2) | 8 (80.0) | 12 (80.0) |
| Differenceb (70% CI) | −10.8 (−32.0, 10.9) | 0.0 (−23.8, 20.9) | N/A |
CE, clinically evaluable; CI, confidence interval; c-mITT, clinical modified intention to treat; ME, microbiologically evaluable; N/A, not applicable.
Tigecycline versus imipenem/cilastatin.
Subgroup analyses were consistent with the primary efficacy results. Clinical response data stratified by VAP, APACHE II score, clinical pulmonary infection score (CPIS), and prior antibiotic failure are shown in Table 3. In patients with VAP and higher APACHE II score, higher CPIS score, or prior antibiotic failure, clinical response was numerically higher with tigecycline 100 mg relative to tigecycline 75 mg and the control group. Within the primary efficacy population, clinical responses stratified by adjunctive therapy or primary therapy alone also were numerically higher with tigecycline 100 mg than with tigecycline 75 mg and the control group (data not shown).
Table 3.
Subgroup analysis of clinical response at test of cure (clinically evaluable population)
| Parametera | No. of subjects with indicated antibiotic test value/total no. of subjects (%) |
||
|---|---|---|---|
| Tigecycline (75 mg) | Tigecycline (100 mg) | Imipenem/cilastatin | |
| Diagnosis | |||
| Non-VAP | 11/16 (68.8) | 11/13 (84.6) | 11/15 (73.3) |
| VAP | 5/7 (71.4) | 6/7 (85.7) | 7/9 (77.8) |
| APACHE II score | |||
| ≤15 | 14/17 (82.4) | 13/16 (81.3) | 14/17 (82.4) |
| >15 | 2/6 (33.3) | 4/4 (100) | 4/7 (57.1) |
| CPIS score | |||
| ≤6 | 10/12 (83.3) | 13/15 (86.7) | 11/14 (78.6) |
| >6 | 6/11 (54.5) | 4/5 (80.0) | 7/10 (70.0) |
| Prior antibiotic failure | |||
| Yes | 1/3 (33.3) | 5/6 (83.3) | 1/3 (33.3) |
| No | 15/20 (75.0) | 12/14 (85.7) | 17/21 (81.0) |
APACHE, Acute Physiology and Chronic Health Evaluation; CPIS, clinical pulmonary infection score; VAP, ventilator-associated pneumonia.
Clinical response by pathogen is reported in Table 4. The results for the tigecycline 100 mg group with baseline S. aureus (including methicillin-resistant S. aureus) and Enterobacteriaceae were consistent with clinical response in the primary efficacy population.
Table 4.
Cure rate by pathogen in the microbiologically evaluable population
| Speciesa | No. of subjects with indicated antibiotic test value/total no. of subjects (%) |
||
|---|---|---|---|
| Tigecycline (75 mg) | Tigecycline (100 mg) | Imipenem/cilastatin | |
| Acinetobacter calcoaceticus | 2/3 (66.7) | 1/2 (50.0) | 2/3 (66.7) |
| Enterobacteriaceaeb | 2/4 (50.0) | 3/4 (75.0) | 4/7 (57.1) |
| Haemophilus spp. | 1/1 (100.0) | 0/1 (0) | 0/1 (0) |
| Staphylococcus aureus | 6/8 (75.0) | 5/6 (83.3) | 8/9 (88.9) |
| MSSA | 3/4 (75.0) | 3/4 (75.0) | 4/5 (80.0) |
| MRSA | 3/4 (75.0) | 2/2 (100.0) | 4/4 (100.0) |
| Streptococcus spp.c | 3/3 (100.0) | 0/1 (0) | 1/1 (100.0) |
MRSA, methicillin-resistant Staphylococcus aureus; MSSA, methicillin-sensitive Staphylococcus aureus.
Includes Enterobacter cloace, Escherichia coli, Klebsiella oxytoca, Klebsiella pneumoniae, and Serratia marcescens.
Includes Streptococcus mitis, Streptococcus oralis, and Streptococcus pneumoniae.
Safety.
Adverse events (AEs) were reported in 86 (81.9%) subjects; 31 (29.5%) subjects experienced AEs that were considered treatment related. The most frequent AEs were gastrointestinal, with 12.4% related to treatment. There was a significant (P = 0.002) difference in the incidence of gastrointestinal disorders, such as diarrhea, nausea, and vomiting, between subjects receiving tigecycline and those receiving imipenem/cilastatin. Diarrhea was the most-common treatment-related gastrointestinal event, and the incidence was highest in the tigecycline 100 mg treatment group (tigecycline 75 mg, 2.8%; tigecycline 100 mg, 14.3%; imipenem/cilastatin, 2.9%; P = 0.190). Treatment-related nausea was highest in the tigecycline 100 mg treatment group (tigecycline 75 mg, 2.8%; tigecycline 100 mg, 8.6%; imipenem/cilastatin, 0%; P = 0.218). The incidence of vomiting was also highest in the tigecycline 100 mg treatment group (tigecycline 75 mg, 2.8%; tigecycline 100 mg, 5.7%; imipenem/cilastatin, 0%; P = 0.654). Most treatment-related AEs were considered mild or moderate in severity. Thirty-one (29.5%) subjects experienced serious adverse events, with similar numbers in all treatment groups (tigecycline 75 mg, n = 12; tigecycline 100 mg, n = 9; imipenem/cilastatin, n = 10; P = 0.801). Comparable numbers of patients in all treatment groups discontinued treatment because of AEs. A total of 17 deaths were recorded during the study, with 7 (19.4%) in the tigecycline 75 mg treatment group, 3 (8.6%) in the tigecycline 100 mg treatment group, and 7 (20.6%) in the imipenem/cilastatin treatment group. None of the deaths were related to study medication. The most common AE with an outcome of death was septic shock (tigecycline 75 mg, n = 4; tigecycline 100 mg, n = 1; imipenem/cilastatin, n = 1).
PK/PD results.
A total of 197 tigecycline serum concentrations were collected from 39 individuals, 20 of whom received 150 mg and then 75 mg every 12 h and 19 of whom received 200 mg and then 100 mg every 12 h. A two-compartment model was found to describe the data adequately. No covariates were found to be significant. Table 5 shows the population PK results for the two doses of tigecycline. As expected, peak tigecycline serum concentrations were highly variable and concentrations increased with dose (Fig. 2). PK/PD assessment of clinical or microbiological outcome could not be made because MIC data were available for only the 25 subjects for whom PK data were available. The mean AUC/MIC ratios were 24.3 ± 20.4 for subjects with a clinical cure (n = 17) and 22.8 ± 9.59 for subjects with treatment failure or an indeterminate outcome (n = 8). Acknowledging that death is a major concern in the treatment of patients with HAP, a post hoc analysis was performed to assess a potential relationship between the AUC/MIC ratio and death. A total of 4 deaths were observed among the 25 subjects for whom AUC/MIC ratio values were available. The 25 AUC/MIC ratio values were divided into groups corresponding to 5 cohorts of 5 subjects each. The median, minimum, and maximum values and numbers of deaths for each cohort are shown in Table 6. The values for subjects who died did not aggregate at the low AUC/MIC ratio quintiles; however, the very small numbers and the complexity of the patient groups make it difficult to interpret the results.
Table 5.
Population pharmacokinetic results in patients with hospital-acquired pneumonia (base/final model parameter estimates)
| Parametera | Estimate | Relative SE, % | Interindividual variability, % | 90% CIb |
|---|---|---|---|---|
| CL (liters/h) | 22.6 | 6.99 | 39.2 | 19.4, 26.4 |
| Vc (liters) | 108 | 26.6 | 158 | 33.3, 184 |
| Q (liters/h) | 55.1 | 10.3 | 44.1, 67.2 | |
| Vp (liters) | 190 | 16.3 | 141, 310 | |
| Residual variability | 22.1% | |||
| ηCL shrinkage | 5. 7% | |||
| ηVc shrinkage | 12.7% | |||
| ϵ shrinkage | 17.8% |
CL, clearance; Q, intercompartmental clearance; Vc, volume of distribution; Vp, volume of plasma compartment.
Confidence intervals (CI) calculated from bootstrap values.
Fig 2.

Mean ± tigecycline (TGC) serum concentrations in subjects with hospital-acquired pneumonia after intravenous infusions.
Table 6.
AUC/MIC ratios and deaths by tigecycline cohorta
| Cohort (n) | Median AUC/MIC ratio | Minimum-maximum AUC/MIC ratios | No. of deaths |
|---|---|---|---|
| 1 (5) | 10.1 | 5.99–11.1 | 1 |
| 2 (5) | 15.7 | 11.4–16.4 | 1 |
| 3 (5) | 18.3 | 16.9–20.6 | 1 |
| 4 (5) | 25.0 | 21.3–29.7 | 1 |
| 5 (5) | 53.5 | 31.5–77.9 | 0 |
Data represent the results determined for 25 patients for whom PK data were available.
Similarly, the small number of individuals with PK data did not permit a robust assessment of the relationship between exposure and nausea and/or vomiting. Logistic regression analysis did not demonstrate a correlation with the probability of experiencing nausea and/or vomiting as a function of AUC.
DISCUSSION
The current study was designed to test the hypothesis that a tigecycline dose higher than 100 mg followed by 50 mg every 12 h was needed to treat hospital-acquired pneumonia. The doses selected for the current study were 1.5 and 2 times the doses previously used. These doses were selected after considering previous study results (14) as well as the AUC0–24/MIC observed in successfully treated infections. The need for higher doses seemed to arise from both the lower AUCs and higher MICs that were observed in patients with HAP, most particularly those with VAP. The former seemed to represent a minor difference. Although the results of the phase 3 study (14) showed that the AUC in patients with VAP was 15% lower than the AUC in patients with HAP, a population PK analysis that included the same HAP concentration data as well as data from 2 phase 3 studies of patients with CAP (18) failed to identify infection type as a significant covariate. When MICs were also considered, a larger difference between VAP and non-VAP patients in the phase 3 trial was observed. Comparing the fAUC0–24/MIC values, the median value in patients with VAP was 60% lower than the value observed in patients without VAP. A separate, model-based analysis of the same data showed similar but more pronounced results with respect to the differences in the fAUC0–24/MIC values observed in patients with and without VAP (19). Simulations were performed to identify the dosing regimen which would provide higher exposures and yet remain within the range of doses which had been identified as likely to be tolerated (20).
The results of the current study suggest that the clinical failure in patients with VAP in the previous study may have been related to suboptimal tigecycline doses. However, the tigecycline doses required for a positive clinical response may be less than the 5-fold increase which may be understood to be suggested by the exposure-response analyses described by Ambrose et al. (19) and Bhavnani et al. (21). Clinical responses to higher doses of tigecycline in the CE and c-mITT populations in this phase 2 study were compared with the clinical responses to the approved dose (50 mg every 12 h) in the previous phase 3 study (Fig. 3) (14). In the CE population, the imipenem/cilastatin clinical responses were similar in the two trials, and the 75 mg tigecycline dose clinical response was similar to the clinical response in the previous phase 3 trial at the 50-mg dose. The clinical response with the 100-mg dose of tigecycline was higher than that with either the 75 mg tigecycline dose or the imipenem/cilastatin control.
Fig 3.
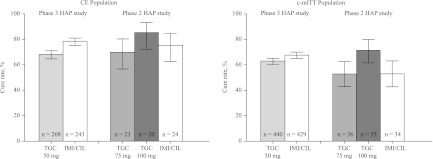
Clinical responses in phase 2 and phase 3 hospital-acquired pneumonia (HAP) trials, comparing different doses of tigecycline (TGC) and imipenem/cilastatin (IMI/CIL; 70% confidence intervals). CE, clinically evaluable; c-mITT, clinical modified intention to treat.
Although the data set available for PK/PD analysis was too small for definitive conclusions, important information was gathered. The PK parameters were similar to what has been observed in previous clinical studies (20). As expected given the previous demonstration of linearity in clearance of tigecycline, the AUC increased in proportion with increased tigecycline doses.
One possible explanation for the need of higher doses of tigecycline is that antibiotic concentrations in the extracellular fluid in critically ill patients with HAP or VAP may be more important that previously recognized. Burkhardt et al. (22) previously noted that the ELF/plasma concentration ratio of tigecycline is suboptimal with the use of the approved tigecycline dose. Another potential explanation for the need for higher AUC/MIC ratios of tigecycline is the possibility of extracellular fluid leak in septic patients with HAP or VAP (23). This change in lung exposure, in the presence of similar serum exposure, could explain a reduced response with traditional tigecycline dosing and subsequent AUC and would support the need for increasing tigecycline doses to counterbalance the extracellular fluid leak.
The study has important strengths and critical limitations. Despite early termination and a sample size that was smaller than expected, the results are consistent with the overall hypothesis and clinical responses in important subgroups (e.g., higher APACHE II score and VAP) were consistent with the primary efficacy results. Importantly, safety and tolerability at the higher tigecycline doses did not appear prohibitive to further exploration. The critical limitations of this phase 2 study are that it failed to enroll the expected number of subjects and that it was terminated early. Subjects with VAP were of paramount interest given the prior study results but represented only 39% of subjects. The limited amount of microbiology data precluded sufficient correlation with clinical results.
In conclusion, numerically higher efficacy values were observed with the tigecycline 100 mg twice-daily dose relative to lower doses of tigecycline and imipenem/cilastatin in the treatment of HAP. The safety profile of the higher doses of tigecycline was similar to the known safety profile of the approved dose of tigecycline. The conclusions of this study remain speculative given the study limitations but suggest that further studies evaluating the higher dose of tigecycline in patients with VAP should be performed.
ACKNOWLEDGMENTS
This study was sponsored by Wyeth Research, which was acquired by Pfizer Inc. in October 2009. Julio Ramirez has received research grants, consulting fees, and speaker fees from Pfizer Inc. Nathalie Dartois, Jean Li Yan, Joan Korth-Bradley, and Paul C. McGovern are employees of Pfizer Inc. Hassan Gandjini was an employee of Pfizer Inc. at the time that this study was conducted.
Pharmacokinetic analytical support was provided by Michael Tortorici, an employee of Pfizer Inc. Medical writing support was provided by Charlotte Kenreigh of UBC Scientific Solutions and was funded by Pfizer Inc.
Footnotes
Published ahead of print 28 January 2013
REFERENCES
- 1. Fagon JY, Chastre J, Vuagnat A, Trouillet JL, Novara A, Gibert C. 1996. Nosocomial pneumonia and mortality among patients in intensive care units. JAMA 275:866–869 [PubMed] [Google Scholar]
- 2. Ibrahim EH, Ward S, Sherman G, Kollef MH. 2000. A comparative analysis of patients with early-onset vs late-onset nosocomial pneumonia in the ICU setting. Chest 117:1434–1442 [DOI] [PubMed] [Google Scholar]
- 3. Richards MJ, Edwards JR, Culver DH, Gaynes RP. 1999. Nosocomial infections in medical intensive care units in the United States. National Nosocomial Infections Surveillance System. Crit. Care Med. 27:887–892 [DOI] [PubMed] [Google Scholar]
- 4. Vincent JL, Bihari DJ, Suter PM, Bruining HA, White J, Nicolas-Chanoin MH, Wolff M, Spencer RC, Hemmer M. 1995. The prevalence of nosocomial infection in intensive care units in Europe. Results of the European Prevalence of Infection in Intensive Care (EPIC) Study. EPIC International Advisory Committee. JAMA 274:639–644 [PubMed] [Google Scholar]
- 5. Safdar N, Dezfulian C, Collard HR, Saint S. 2005. Clinical and economic consequences of ventilator-associated pneumonia: a systematic review. Crit. Care Med. 33:2184–2193 [DOI] [PubMed] [Google Scholar]
- 6. American Thoracic Society; Infectious Disease Society of America 2005. Guidelines for the management of adults with hospital-acquired, ventilator-associated, and healthcare-associated pneumonia. Am. J. Respir. Crit. Care Med. 171:388–416 [DOI] [PubMed] [Google Scholar]
- 7. Wyeth Pharmaceuticals Inc 2011. Tygacil (tigecycline) for injection for intravenous use (highlights of prescribing information). Wyeth Pharmaceuticals Inc., Philadelphia, PA: http://labeling.pfizer.com/ShowLabeling.aspx?id=491 [Google Scholar]
- 8. Bergallo C, Jasovich A, Teglia O, Oliva ME, Lentnek A, de Wouters L, Zlocowski JC, Dukart G, Cooper A, Mallick R; 308 Study Group 2009. Safety and efficacy of intravenous tigecycline in treatment of community-acquired pneumonia: results from a double-blind randomized phase 3 comparison study with levofloxacin. Diagn. Microbiol. Infect. Dis. 63:52–61 [DOI] [PubMed] [Google Scholar]
- 9. Tanaseanu C, Bergallo C, Teglia O, Jasovich A, Oliva ME, Dukart G, Dartois N, Cooper CA, Gandjini H, Mallick R; 308 Study Group 2008. Integrated results of 2 phase 3 studies comparing tigecycline and levofloxacin in community-acquired pneumonia. Diagn. Microbiol. Infect. Dis. 61:329–338 [DOI] [PubMed] [Google Scholar]
- 10. Tanaseanu C, Milutinovic S, Calistru PI, Strausz J, Zolubas M, Chernyak V, Dartois N, Castaing N, Gandjini H, Cooper CA; 313 Study Group 2009. Efficacy and safety of tigecycline versus levofloxacin for community-acquired pneumonia. BMC Pulm. Med. 9:44 doi:10.1186/1471-2466-9-44 [DOI] [PMC free article] [PubMed] [Google Scholar]
- 11. Rodvold KA, Gotfried MH, Cwik M, Korth-Bradley JM, Dukart G, Ellis-Grosse EJ. 2006. Serum, tissue and body fluid concentrations of tigecycline after a single 100 mg dose. J. Antimicrob. Chemother. 58:1221–1229 [DOI] [PubMed] [Google Scholar]
- 12. Conte JE, Jr, Golden JA, Kelly MG, Zurlinden E. 2005. Steady-state serum and intrapulmonary pharmacokinetics and pharmacodynamics of tigecycline. Int. J. Antimicrob. Agents 25:523–529 [DOI] [PubMed] [Google Scholar]
- 13. Crandon JL, Kim A, Nicolau DP. 2009. Comparison of tigecycline penetration into the epithelial lining fluid of infected and uninfected murine lungs. J. Antimicrob. Chemother. 64:837–839 [DOI] [PubMed] [Google Scholar]
- 14. Freire AT, Melnyk V, Kim MJ, Datsenko O, Dzyublik O, Glumcher F, Chuang YC, Maroko RT, Dukart G, Cooper CA, Korth-Bradley JM, Dartois N, Gandjini H; 311 Study Group 2010. Comparison of tigecycline with imipenem/cilastatin for the treatment of hospital-acquired pneumonia. Diagn. Microbiol. Infect. Dis. 68:140–151 [DOI] [PubMed] [Google Scholar]
- 15. Passarell JA, Meagher AK, Liolios K, Cirincione BB, Van Wart SA, Babinchak T, Ellis-Grosse EJ, Ambrose PG. 2008. Exposure-response analyses of tigecycline efficacy in patients with complicated intra-abdominal infections. Antimicrob. Agents Chemother. 52:204–210 [DOI] [PMC free article] [PubMed] [Google Scholar]
- 16. Department of Health and Human Services, U. S. Food and Drug Administration 2010. Guidance for industry. Hospital-acquired bacterial pneumonia and ventilator-associated bacterial pneumonia: developing drugs for treatment. Department of Health and Human Services, U.S. Food and Drug Administration, Silver Spring, MD [Google Scholar]
- 17. Department of Health and Human Services, U. S. Food and Drug Administration 1999. Guidance for industry. Population pharmacokinetics. U.S. Food and Drug Administration, Rockville, MD [Google Scholar]
- 18. Rubino CM, Forrest A, Bhavnani SM, Dukart G, Cooper A, Korth-Bradley J, Ambrose PG. 2010. Tigecycline population pharmacokinetics in patients with community- or hospital-acquired pneumonia. Antimicrob. Agents Chemother. 54:5180–5186 [DOI] [PMC free article] [PubMed] [Google Scholar]
- 19. Ambrose PG, Bhavnani SM, Grosse EJE, Drusano GL. 2010. Pharmacokinetic-pharmacodynamic considerations in the design of hospital-acquired or ventilator-associated bacterial pneumonia studies: look before you leap! Clin. Infect. Dis. 51:S103–S110 [DOI] [PubMed] [Google Scholar]
- 20. Muralidharan G, Micalizzi M, Speth J, Raible D, Troy S. 2005. Pharmacokinetics of tigecycline after single and multiple doses in healthy subjects. Antimicrob. Agents Chemother. 49:220–229 [DOI] [PMC free article] [PubMed] [Google Scholar]
- 21. Bhavnani SM, Rubino CM, Hammel JP, Forrest A, Dartois N, Cooper CA, Korth-Bradley J, Ambrose PG. 2012. Pharmacological and patient-specific response determinants in patients with hospital-acquired pneumonia treated with tigecycline. Antimicrob. Agents Chemother. 56:1065–1072 [DOI] [PMC free article] [PubMed] [Google Scholar]
- 22. Burkhardt O, Rauch K, Kaever V, Hadem J, Kielstein JT, Welte T. 2009. Tigecycline possibly underdosed for the treatment of pneumonia: a pharmacokinetic viewpoint. Int. J. Antimicrob. Agents 34:101–102 [DOI] [PubMed] [Google Scholar]
- 23. Krüttgen A, Rose-John S. 2012. Interleukin-6 in sepsis and capillary leakage syndrome. J. Interferon Cytokine Res. 32:60–65 [DOI] [PubMed] [Google Scholar]
- 24. Meagher AK, Passarell JA, Cirincione BB, Van Wart SA, Liolios K, Babinchak T, Ellis-Grosse EJ, Ambrose PG. 2007. Exposure-response analyses of tigecycline efficacy in patients with complicated skin and skin-structure infections. Antimicrob. Agents Chemother. 51:1939–1945 [DOI] [PMC free article] [PubMed] [Google Scholar]